
THIRD QUARTER 2021 FINANCIAL RESULTS OCTOBER 26, 2021

2 THIRD QUARTER 2021 FINANCIAL RESULTS | OCTOBER 26, 2021 CAUTIONARYSTATEMENT This presentation contains forward-looking statements concerning Advanced Micro Devices, Inc. (AMD) such as the features, functionality, performance, availability, timing and expected benefits of AMD products; the Xilinx, Inc. transaction remaining on track to close by end of year; AMD’s expected fourth quarter 2021 and fiscal year 2021 financial outlook, including revenue, non-GAAP gross margin, non-GAAP operating expenses, non-GAAP operating expenses as a percentage of revenue, non-GAAP interest expense, taxes and other, non-GAAP tax rates and diluted share count; and AMD’s leadership roadmaps, increasing market share, execution excellence and strong shareholder returns, which are made pursuant to the Safe Harbor provisions of the Private Securities Litigation Reform Act of 1995. Forward-looking statements are commonly identified by words such as "would," "may," "expects," "believes," "plans," "intends," "projects" and other terms with similar meaning. Investors are cautioned that the forward-looking statements in this presentation are based on current beliefs, assumptions and expectations, speak only as of the date of this presentation and involve risks and uncertainties that could cause actual results to differ materially from current expectations. Such statements are subject to certain known and unknown risks and uncertainties, many of which are difficult to predict and generally beyond AMD's control, that could cause actual results and other future events to differ materially from those expressed in, or implied or projected by, the forward-looking information and statements. Material factors that could cause actual results to differ materially from current expectations include, without limitation, the following: Intel Corporation’s dominance of the microprocessor market and its aggressive business practices; global economic uncertainty; the loss of a significant customer; the impact of the COVID-19 pandemic on AMD’s business, financial condition and results of operations; the competitive markets in which AMD’s products are sold; quarterly and seasonal sales patterns; market conditions of the industries in which AMD products are sold; the cyclical nature of the semiconductor industry; AMD's ability to adequately protect its technology or other intellectual property; unfavorable currency exchange rate fluctuations; the ability of third party manufacturers to manufacture AMD's products on a timely basis in sufficient quantities and using competitive technologies; the availability of essential equipment, materials, substrates or manufacturing processes; expected manufacturing yields for AMD’s products; AMD's ability to introduce products on a timely basis with features and performance levels that provide value to its customers; AMD's ability to generate revenue from its semi-custom SoC products; potential security vulnerabilities; potential IT outages, data loss, data breaches and cyber-attacks; uncertainties involving the ordering and shipment of AMD’s products; AMD’s reliance on third-party intellectual property to design and introduce new products in a timely manner; AMD's reliance on third-party companies for the design, manufacture and supply of motherboards, software and other computer platform components; AMD's reliance on Microsoft Corporation and other software vendors' support to design and develop software to run on AMD’s products; AMD’s reliance on third-party distributors and add-in-board partners; the impact of modification or interruption of AMD’s internal business processes and information systems; compatibility of AMD’s products with some or all industry-standard software and hardware; costs related to defective products; the efficiency of AMD's supply chain; AMD's ability to rely on third party supply-chain logistics functions; AMD’s ability to effectively control the sales of its products on the gray market; the impact of government actions and regulations such as export administration regulations, tariffs and trade protection measures; AMD’s ability to realize its deferred tax assets; potential tax liabilities; current and future claims and litigation; the impact of environmental laws, conflict minerals-related provisions and other laws or regulations; the impact of acquisitions, joint ventures and/or investments on AMD's business, including the announced acquisition of Xilinx, and the failure to integrate acquired businesses; AMD’s ability to complete the Xilinx merger; the impact of the announcement and pendency of the Xilinx merger on AMD’s business; the impact of any impairment of the combined company’s assets on the combined company’s financial position and results of operation; the restrictions imposed by agreements governing AMD’s notes and the revolving credit facility; AMD's indebtedness; AMD's ability to generate sufficient cash to service its debt obligations or meet its working capital requirements; AMD's ability to repurchase its outstanding debt in the event of a change of control; AMD's ability to generate sufficient revenue and operating cash flow or obtain external financing for research and development or other strategic investments; political, legal, economic risks and natural disasters; future impairments of goodwill and technology license purchases; AMD’s ability to attract and retain qualified personnel; AMD’s stock price volatility; and worldwide political conditions. Investors are urged to review in detail the risks and uncertainties in AMD’s Securities and Exchange Commission filings, including but not limited to AMD’s most recent reports on Forms 10-K and 10-Q. NON-GAAP FINANCIAL MEASURES In this presentation, in addition to GAAP financial results, AMD has provided non-GAAP financial measures including non-GAAP gross profit, non-GAAP operating expenses, non-GAAP operating income, non-GAAP net income and non-GAAP earnings per share. AMD uses a normalized tax rate in its computation of the non-GAAP income tax provision to provide better consistency across the reporting periods. For fiscal 2021, AMD uses a projected non-GAAP tax rate of 15%, which excludes the tax impact of pre-tax non-GAAP adjustments, reflecting currently available information. AMD also provided adjusted EBITDA and free cash flow as supplemental non-GAAP measures of its performance. These items are defined in the footnotes to the selected corporate data tables provided at the end of this presentation. AMD is providing these financial measures because it believes this non-GAAP presentation makes it easier for investors to compare its operating results for current and historical periods and also because AMD believes it assists investors in comparing AMD’s performance across reporting periods on a consistent basis by excluding items that it does not believe are indicative of its core operating performance and for the other reasons described in the footnotes to the selected data tables. The non-GAAP financial measures disclosed in this presentation should be viewed in addition to and not as a substitute for or superior to AMD’s reported results prepared in accordance with GAAP and should be read only in conjunction with AMD’s Consolidated Financial Statements prepared in accordance with GAAP. These non-GAAP financial measures referenced are reconciled to their most directly comparable GAAP financial measures in the data tables at the end of this presentation. This presentation also contains forward-looking non-GAAP gross margin concerning AMD’s financial outlook, which is based on current expectations as of October 26, 2021 and assumptions and beliefs that involve numerous risks and uncertainties. AMD undertakes no intent or obligation to publicly update or revise its outlook statements as a result of new information, future events or otherwise, except as may be required by law.

3 THIRD QUARTER 2021 FINANCIAL RESULTS | OCTOBER 26, 2021 OUR JOURNEY Best-in-Class Financial Performance Expanding Customer & Partner Ecosystem Best Product Portfolio in History Significant Business Acceleration
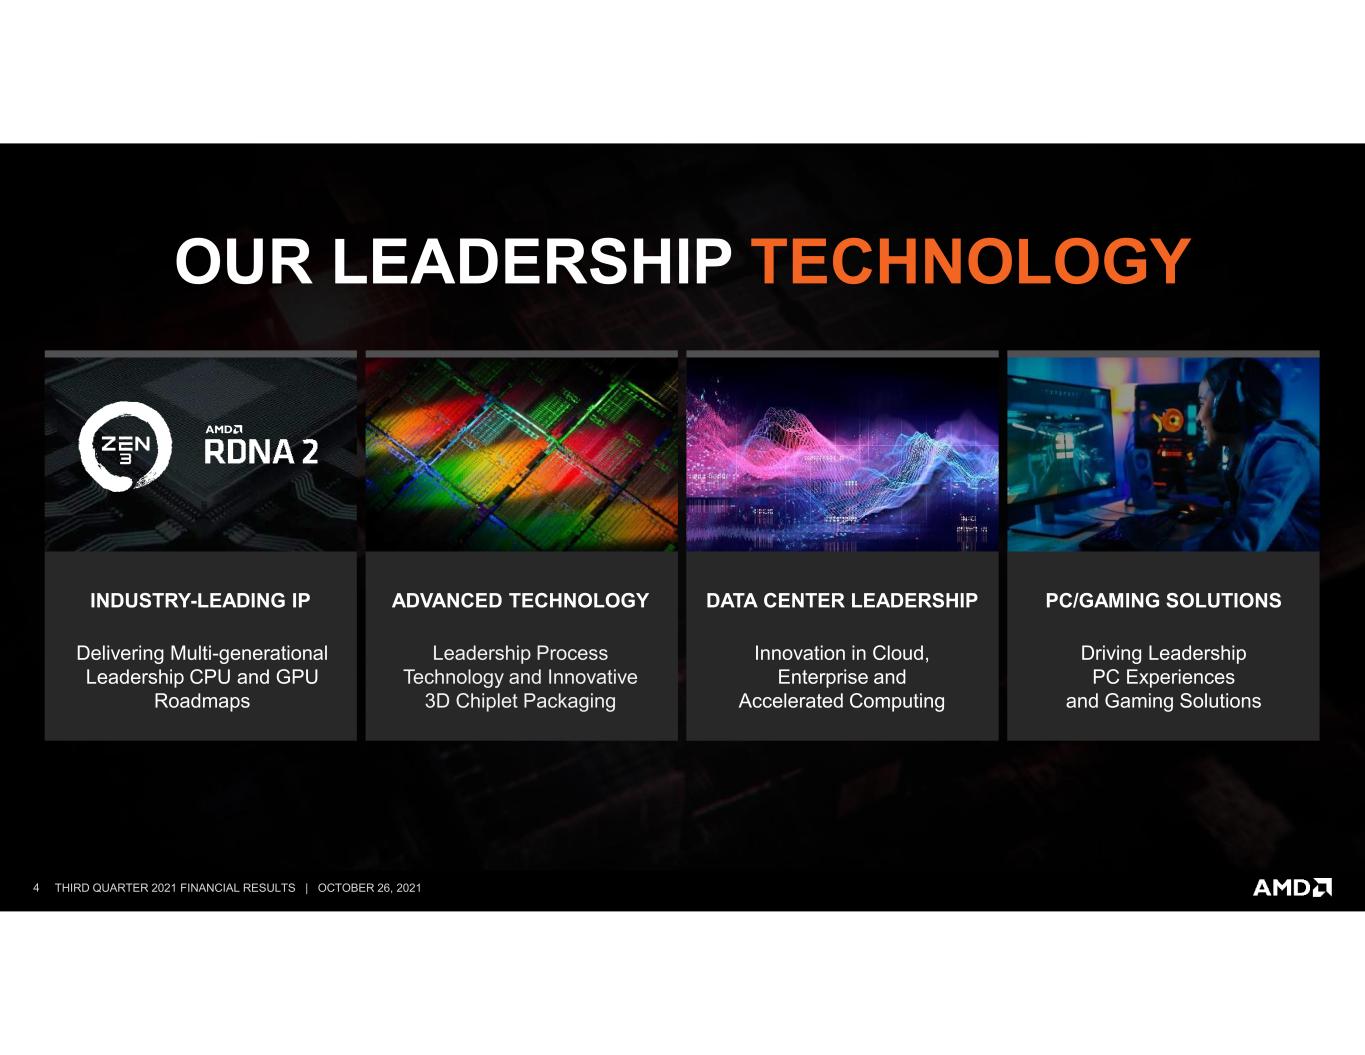
4 THIRD QUARTER 2021 FINANCIAL RESULTS | OCTOBER 26, 2021 Driving Leadership PC Experiences and Gaming Solutions PC/GAMING SOLUTIONS Leadership Process Technology and Innovative 3D Chiplet Packaging ADVANCED TECHNOLOGY Delivering Multi-generational Leadership CPU and GPU Roadmaps INDUSTRY-LEADING IP Innovation in Cloud, Enterprise and Accelerated Computing DATA CENTER LEADERSHIP OUR LEADERSHIP TECHNOLOGY
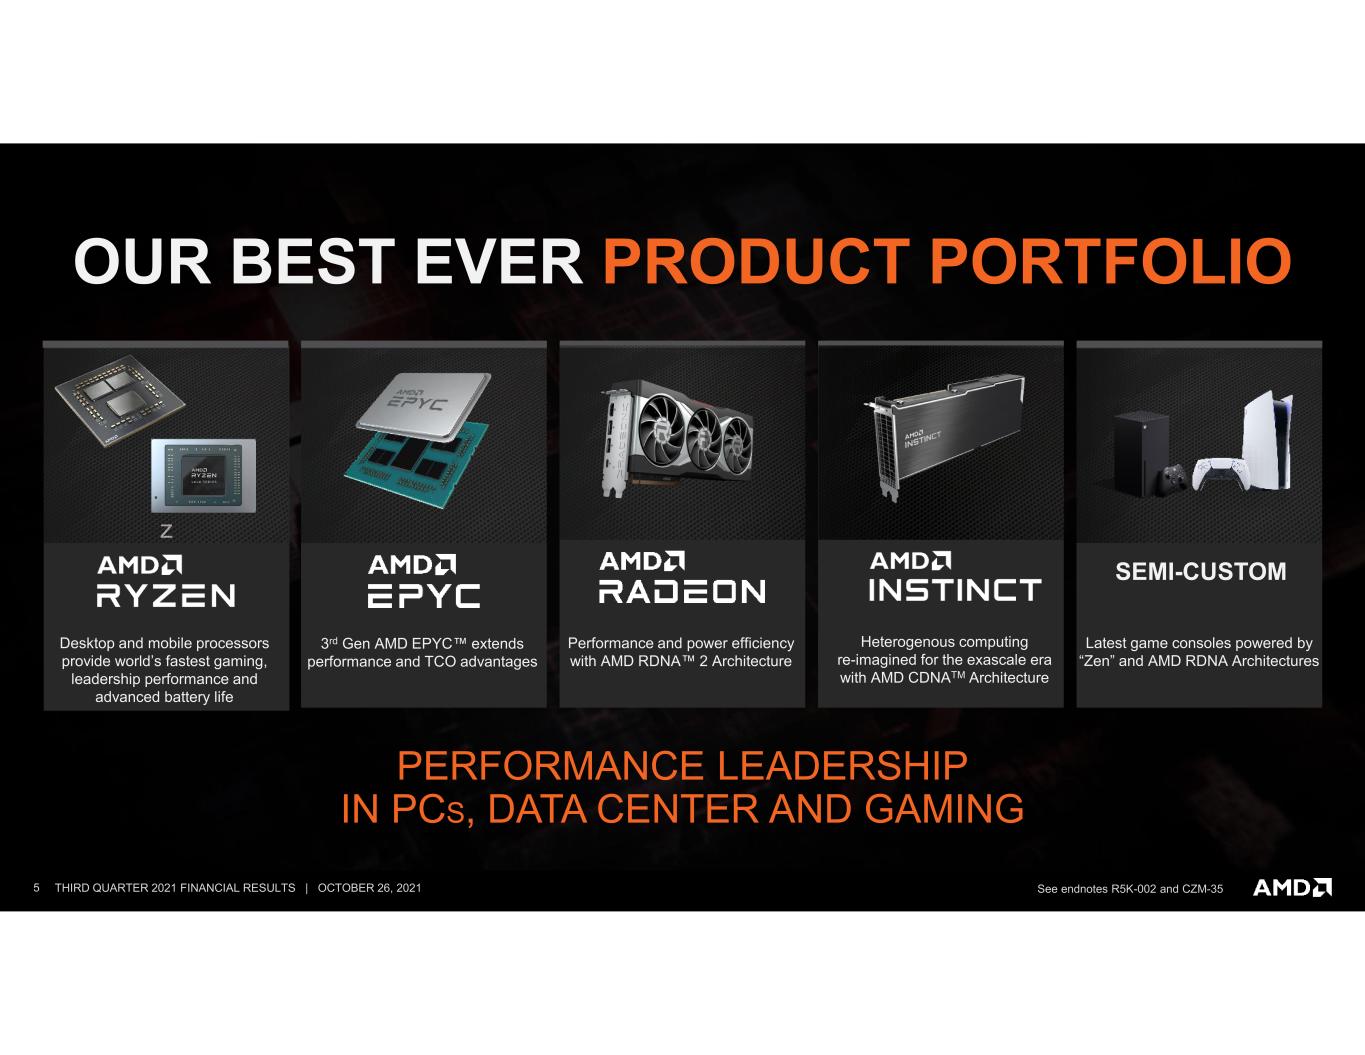
5 THIRD QUARTER 2021 FINANCIAL RESULTS | OCTOBER 26, 2021 z PERFORMANCE LEADERSHIP IN PCS, DATA CENTER AND GAMING OUR BEST EVER PRODUCT PORTFOLIO See endnotes R5K-002 and CZM-35 Desktop and mobile processors provide world’s fastest gaming, leadership performance and advanced battery life Performance and power efficiency with AMD RDNA™ 2 Architecture 3rd Gen AMD EPYC™ extends performance and TCO advantages Latest game consoles powered by “Zen” and AMD RDNA Architectures SEMI-CUSTOM Heterogenous computing re-imagined for the exascale era with AMD CDNATM Architecture
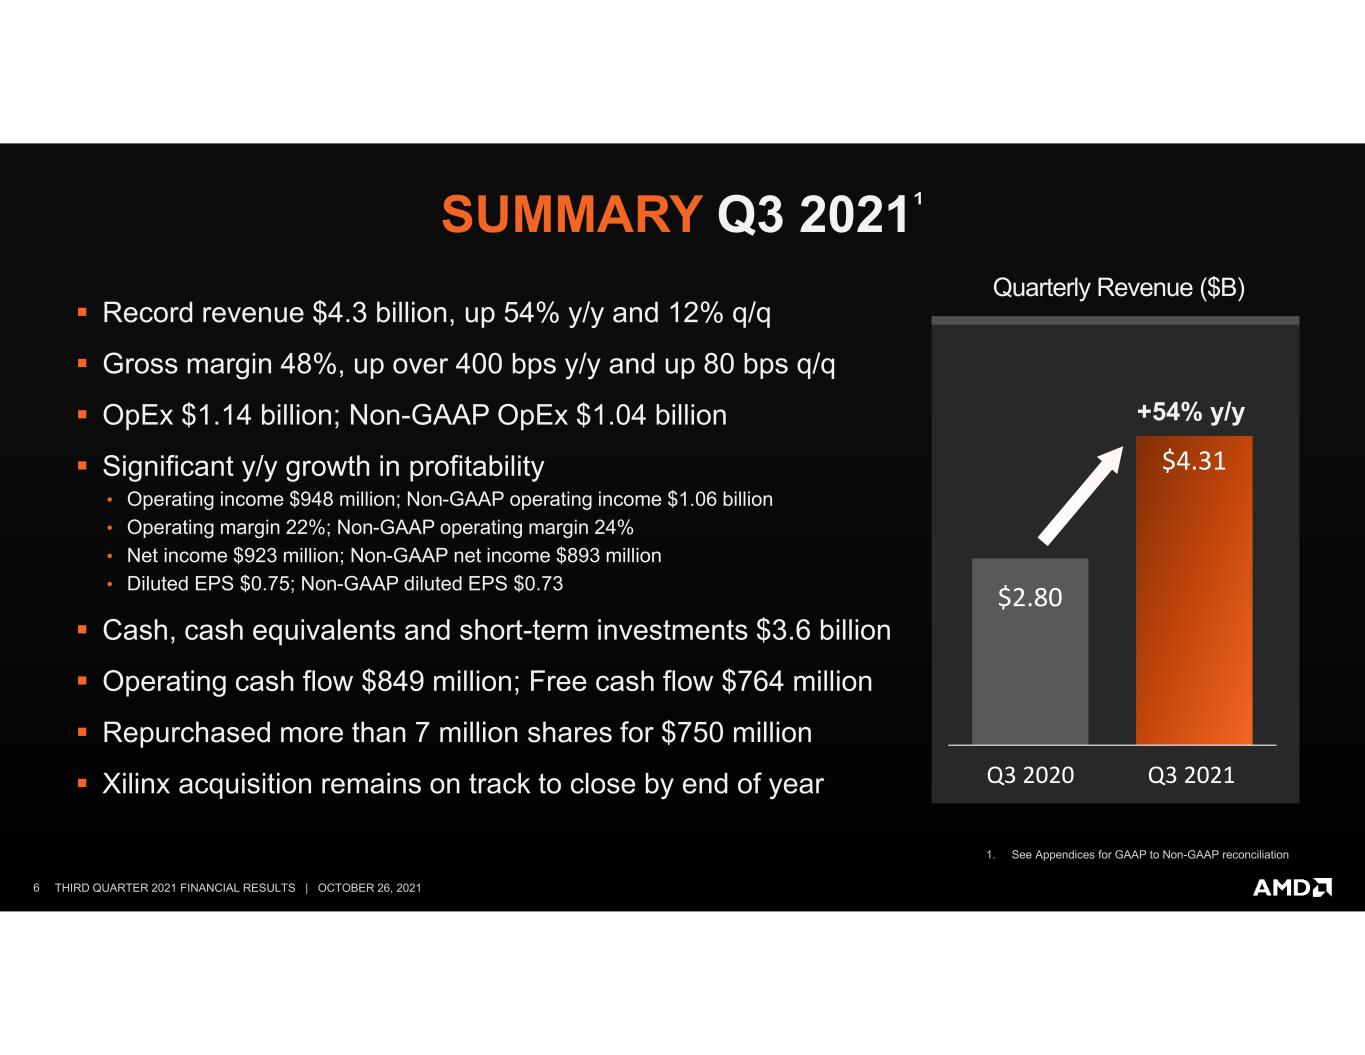
6 THIRD QUARTER 2021 FINANCIAL RESULTS | OCTOBER 26, 2021 1. See Appendices for GAAP to Non-GAAP reconciliation SUMMARY Q3 2021¹ $2.80 $4.31 Q3 2020 Q3 2021 +54% y/y Quarterly Revenue ($B) ▪ Record revenue $4.3 billion, up 54% y/y and 12% q/q ▪ Gross margin 48%, up over 400 bps y/y and up 80 bps q/q ▪ OpEx $1.14 billion; Non-GAAP OpEx $1.04 billion ▪ Significant y/y growth in profitability • Operating income $948 million; Non-GAAP operating income $1.06 billion • Operating margin 22%; Non-GAAP operating margin 24% • Net income $923 million; Non-GAAP net income $893 million • Diluted EPS $0.75; Non-GAAP diluted EPS $0.73 ▪ Cash, cash equivalents and short-term investments $3.6 billion ▪ Operating cash flow $849 million; Free cash flow $764 million ▪ Repurchased more than 7 million shares for $750 million ▪ Xilinx acquisition remains on track to close by end of year
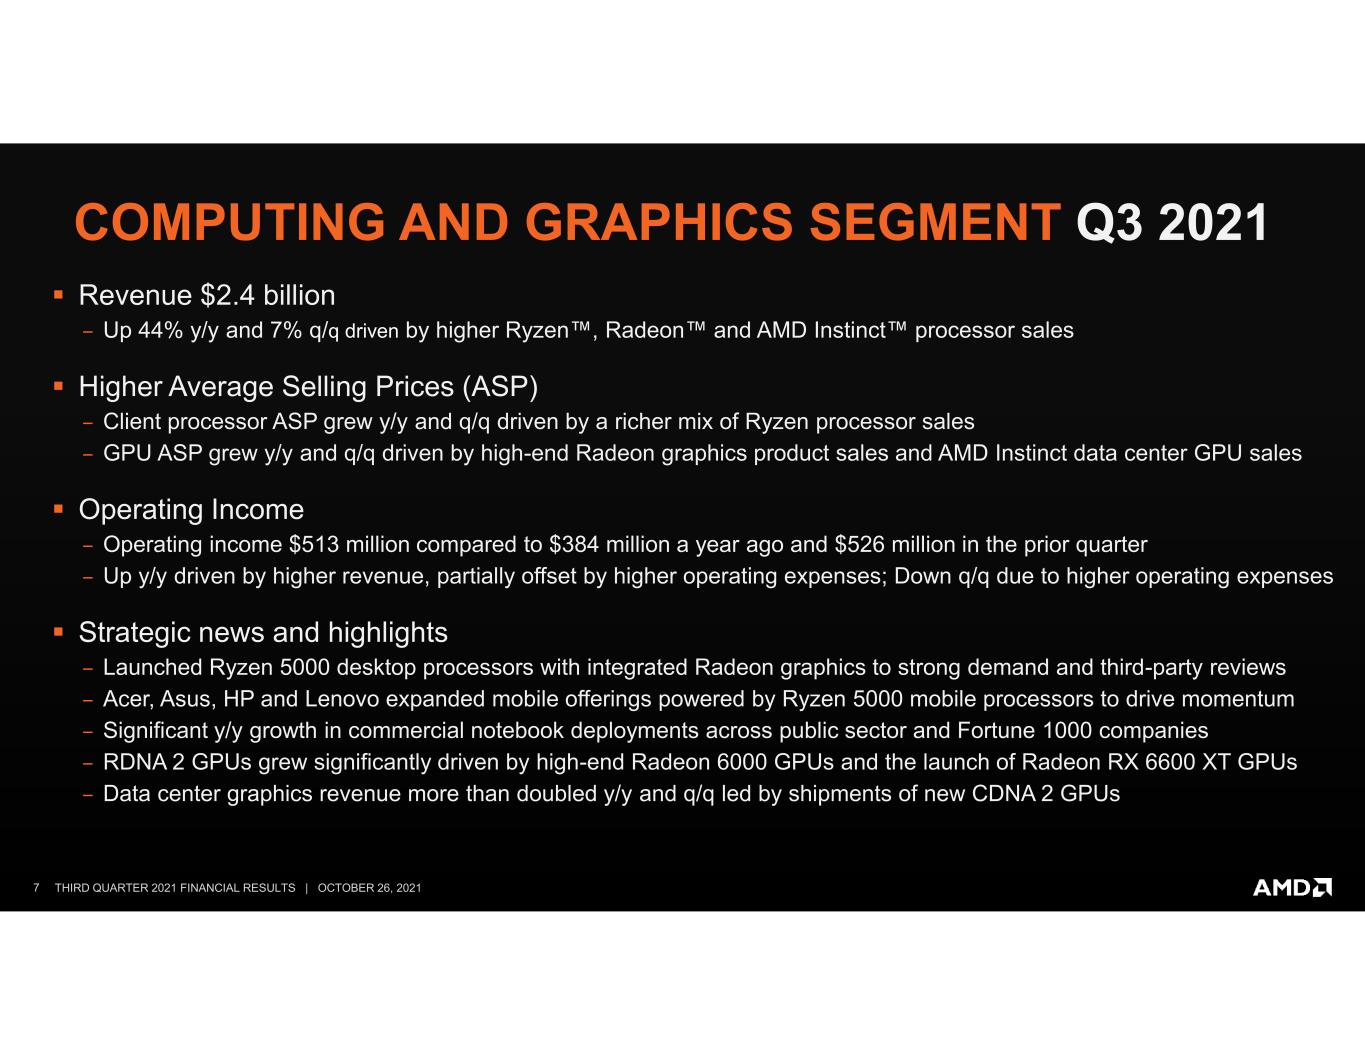
7 THIRD QUARTER 2021 FINANCIAL RESULTS | OCTOBER 26, 2021 COMPUTING AND GRAPHICS SEGMENT Q3 2021 ▪ Revenue $2.4 billion ‒ Up 44% y/y and 7% q/q driven by higher Ryzen™, Radeon™ and AMD Instinct™ processor sales ▪ Higher Average Selling Prices (ASP) ‒ Client processor ASP grew y/y and q/q driven by a richer mix of Ryzen processor sales ‒ GPU ASP grew y/y and q/q driven by high-end Radeon graphics product sales and AMD Instinct data center GPU sales ▪ Operating Income ‒ Operating income $513 million compared to $384 million a year ago and $526 million in the prior quarter ‒ Up y/y driven by higher revenue, partially offset by higher operating expenses; Down q/q due to higher operating expenses ▪ Strategic news and highlights ‒ Launched Ryzen 5000 desktop processors with integrated Radeon graphics to strong demand and third-party reviews ‒ Acer, Asus, HP and Lenovo expanded mobile offerings powered by Ryzen 5000 mobile processors to drive momentum ‒ Significant y/y growth in commercial notebook deployments across public sector and Fortune 1000 companies ‒ RDNA 2 GPUs grew significantly driven by high-end Radeon 6000 GPUs and the launch of Radeon RX 6600 XT GPUs ‒ Data center graphics revenue more than doubled y/y and q/q led by shipments of new CDNA 2 GPUs
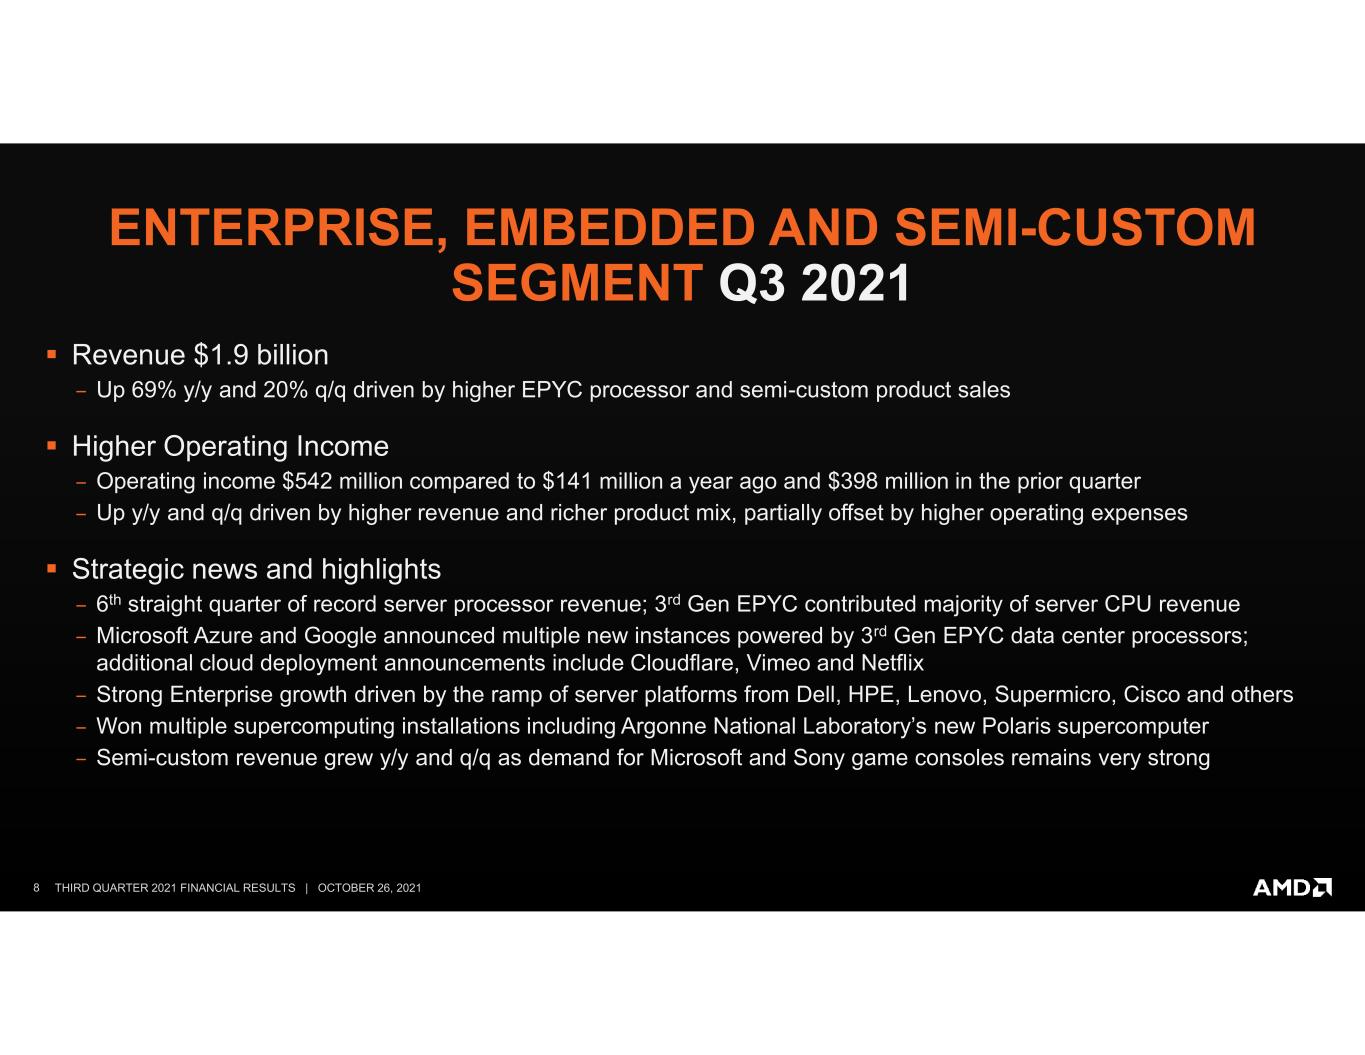
8 THIRD QUARTER 2021 FINANCIAL RESULTS | OCTOBER 26, 2021 ENTERPRISE, EMBEDDED AND SEMI-CUSTOM SEGMENT Q3 2021 ▪ Revenue $1.9 billion ‒ Up 69% y/y and 20% q/q driven by higher EPYC processor and semi-custom product sales ▪ Higher Operating Income ‒ Operating income $542 million compared to $141 million a year ago and $398 million in the prior quarter ‒ Up y/y and q/q driven by higher revenue and richer product mix, partially offset by higher operating expenses ▪ Strategic news and highlights ‒ 6th straight quarter of record server processor revenue; 3rd Gen EPYC contributed majority of server CPU revenue ‒ Microsoft Azure and Google announced multiple new instances powered by 3rd Gen EPYC data center processors; additional cloud deployment announcements include Cloudflare, Vimeo and Netflix ‒ Strong Enterprise growth driven by the ramp of server platforms from Dell, HPE, Lenovo, Supermicro, Cisco and others ‒ Won multiple supercomputing installations including Argonne National Laboratory’s new Polaris supercomputer ‒ Semi-custom revenue grew y/y and q/q as demand for Microsoft and Sony game consoles remains very strong
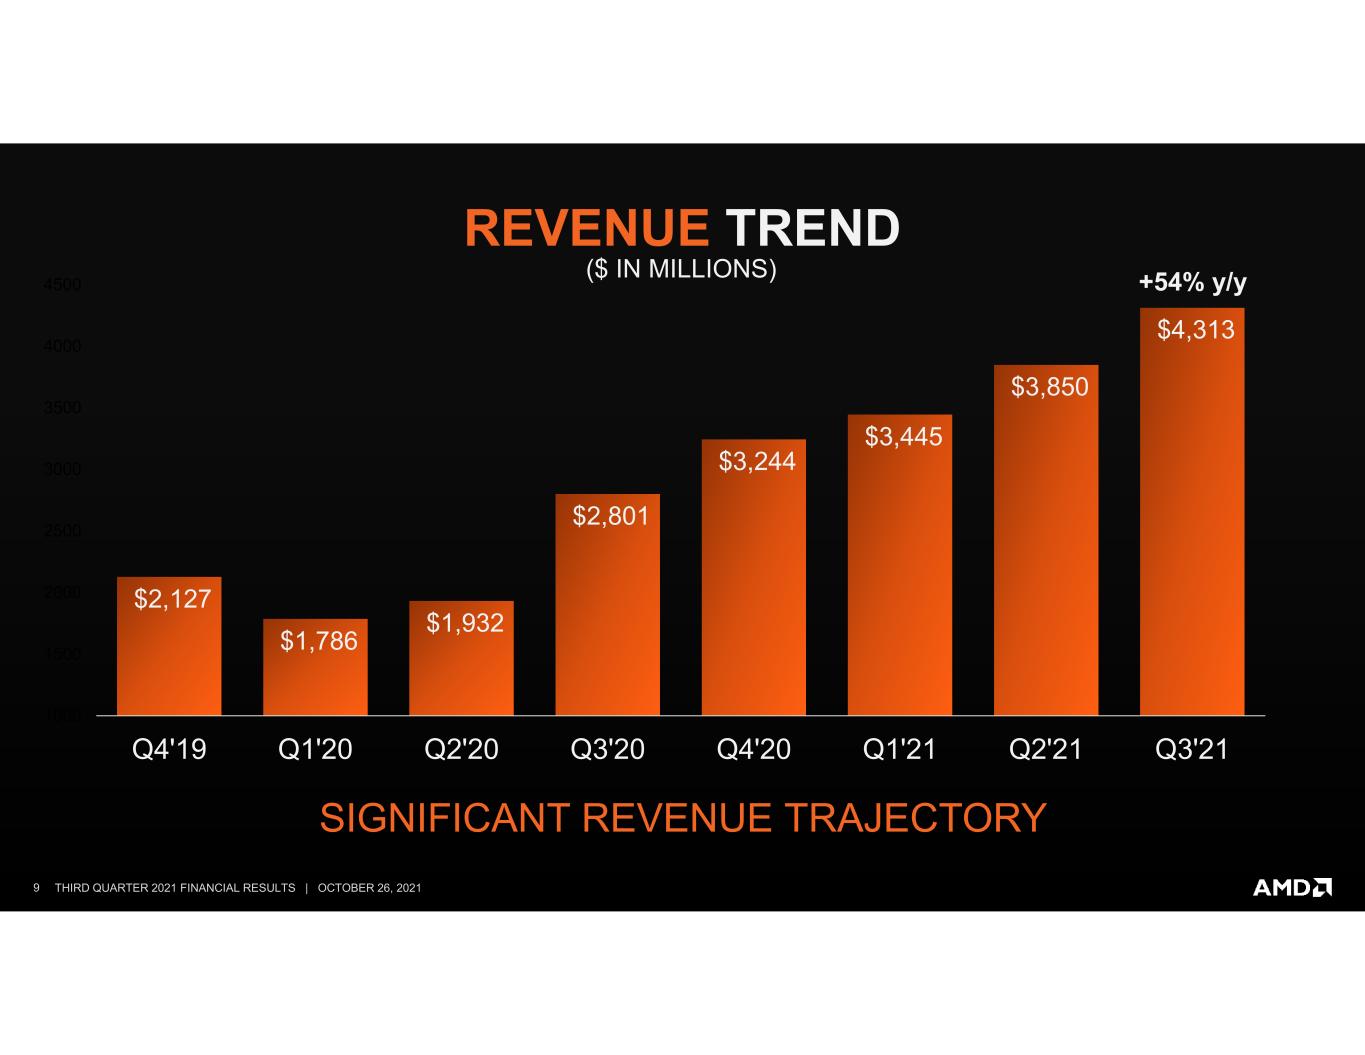
9 THIRD QUARTER 2021 FINANCIAL RESULTS | OCTOBER 26, 2021 $2,127 $1,786 $1,932 $2,801 $3,244 $3,445 $3,850 $4,313 1000 1500 2000 2500 3000 3500 4000 4500 Q4'19 Q1'20 Q2'20 Q3'20 Q4'20 Q1'21 Q2'21 Q3'21 +54% y/y REVENUE TREND ($ IN MILLIONS) SIGNIFICANT REVENUE TRAJECTORY
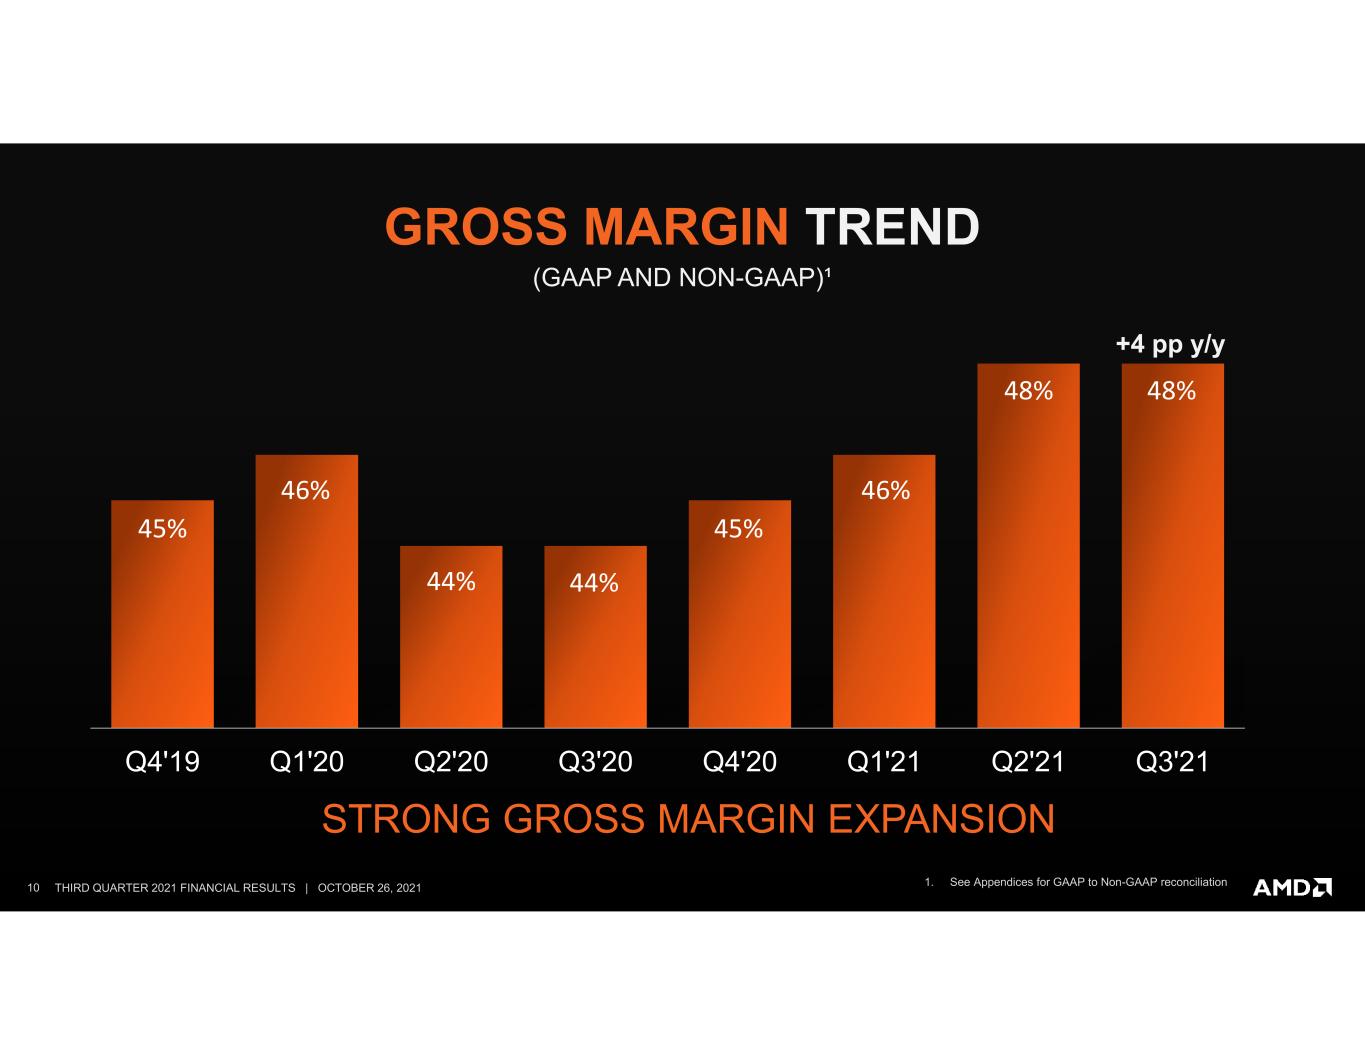
10 THIRD QUARTER 2021 FINANCIAL RESULTS | OCTOBER 26, 2021 45% 46% 44% 44% 45% 46% 48% 48% Q4'19 Q1'20 Q2'20 Q3'20 Q4'20 Q1'21 Q2'21 Q3'21 +4 pp y/y GROSS MARGIN TREND (GAAP AND NON-GAAP)¹ 1. See Appendices for GAAP to Non-GAAP reconciliation STRONG GROSS MARGIN EXPANSION
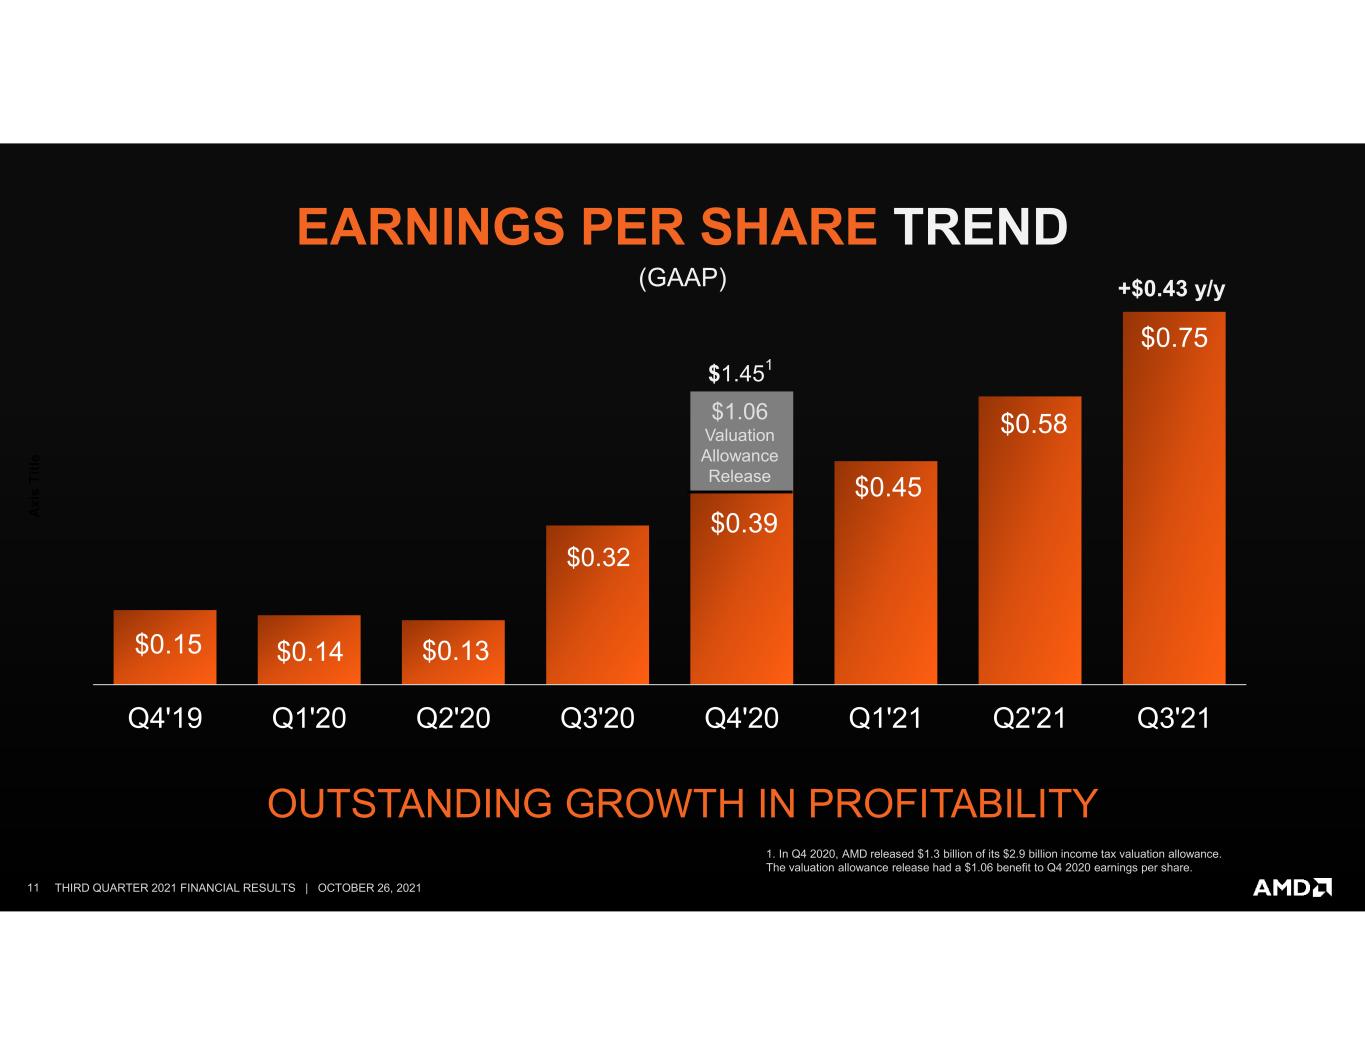
11 THIRD QUARTER 2021 FINANCIAL RESULTS | OCTOBER 26, 2021 EARNINGS PER SHARE TREND $0.15 $0.14 $0.13 $0.32 $0.39 $0.45 $0.58 $0.75 Q4'19 Q1'20 Q2'20 Q3'20 Q4'20 Q1'21 Q2'21 Q3'21 Ax is T itl e +$0.43 y/y(GAAP) $1.451 1. In Q4 2020, AMD released $1.3 billion of its $2.9 billion income tax valuation allowance. The valuation allowance release had a $1.06 benefit to Q4 2020 earnings per share. $1.06 Valuation Allowance Release OUTSTANDING GROWTH IN PROFITABILITY
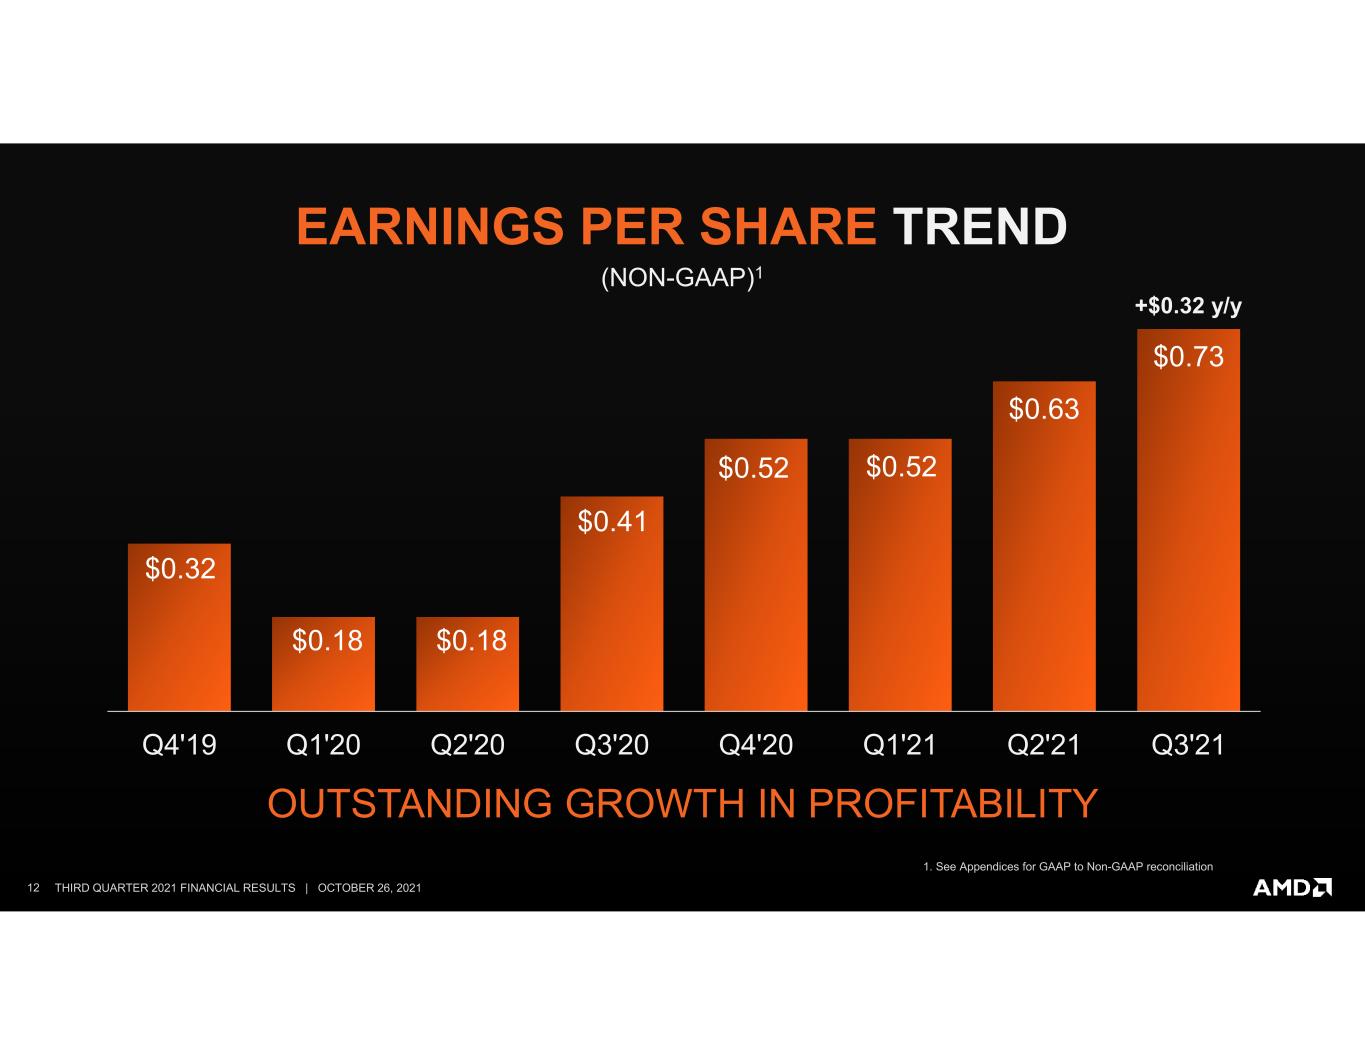
12 THIRD QUARTER 2021 FINANCIAL RESULTS | OCTOBER 26, 2021 $0.32 $0.18 $0.18 $0.41 $0.52 $0.52 $0.63 $0.73 Q4'19 Q1'20 Q2'20 Q3'20 Q4'20 Q1'21 Q2'21 Q3'21 +$0.32 y/y EARNINGS PER SHARE TREND (NON-GAAP)1 1. 1. See Appendices for GAAP to Non-GAAP reconciliation OUTSTANDING GROWTH IN PROFITABILITY
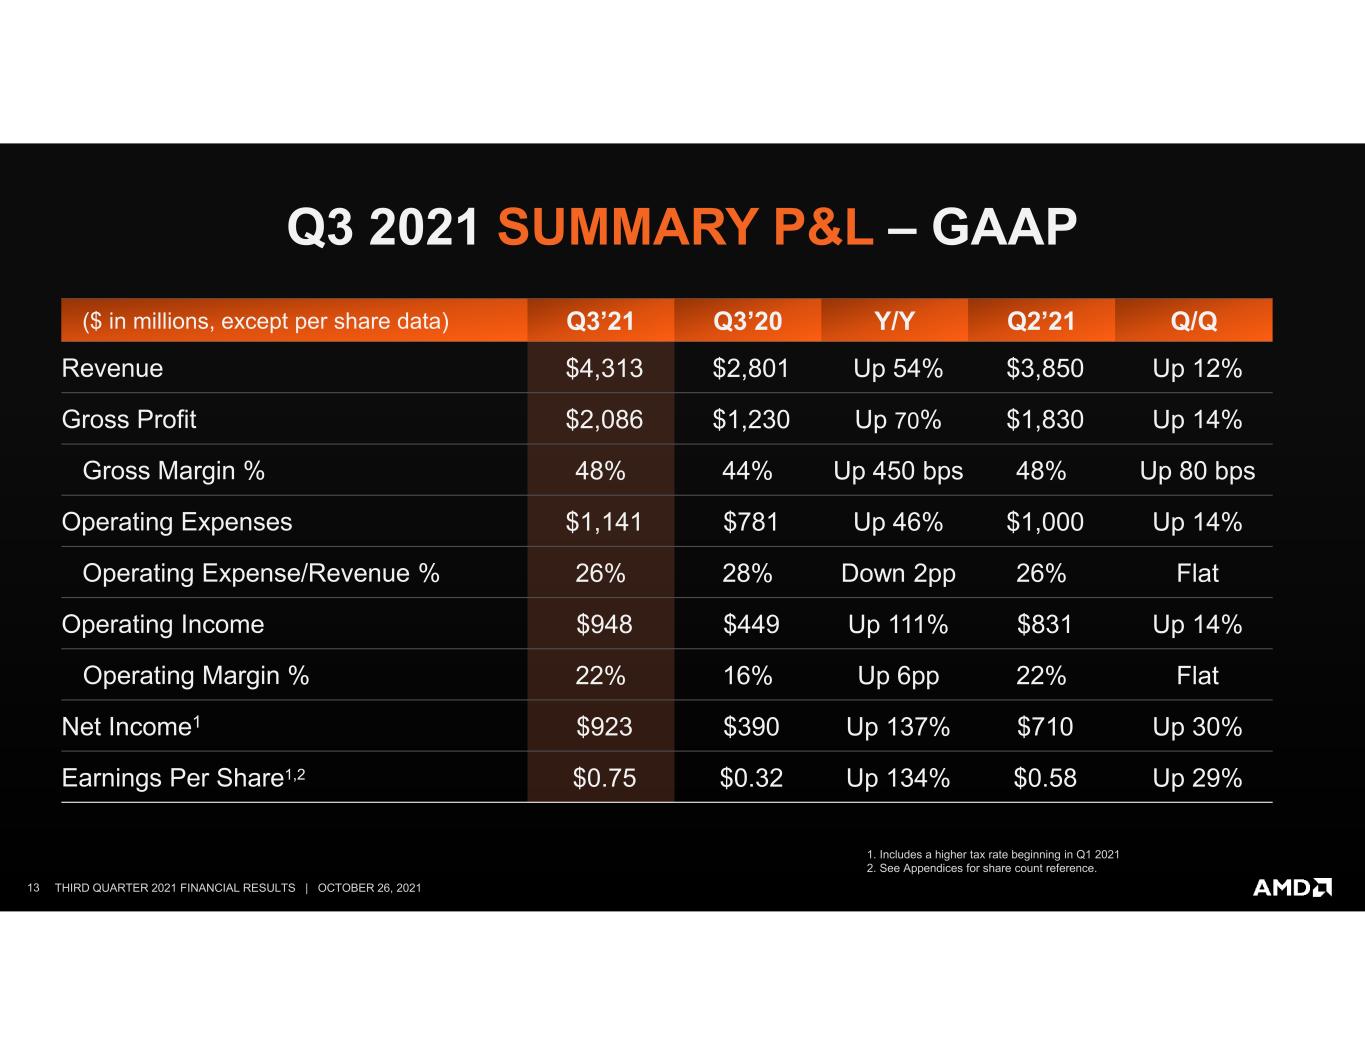
13 THIRD QUARTER 2021 FINANCIAL RESULTS | OCTOBER 26, 2021 ($ in millions, except per share data) Q3’21 Q3’20 Y/Y Q2’21 Q/Q Revenue $4,313 $2,801 Up 54% $3,850 Up 12% Gross Profit $2,086 $1,230 Up 70% $1,830 Up 14% Gross Margin % 48% 44% Up 450 bps 48% Up 80 bps Operating Expenses $1,141 $781 Up 46% $1,000 Up 14% Operating Expense/Revenue % 26% 28% Down 2pp 26% Flat Operating Income $948 $449 Up 111% $831 Up 14% Operating Margin % 22% 16% Up 6pp 22% Flat Net Income1 $923 $390 Up 137% $710 Up 30% Earnings Per Share1,2 $0.75 $0.32 Up 134% $0.58 Up 29% Q3 2021 SUMMARY P&L – GAAP 1. Includes a higher tax rate beginning in Q1 2021 2. See Appendices for share count reference.
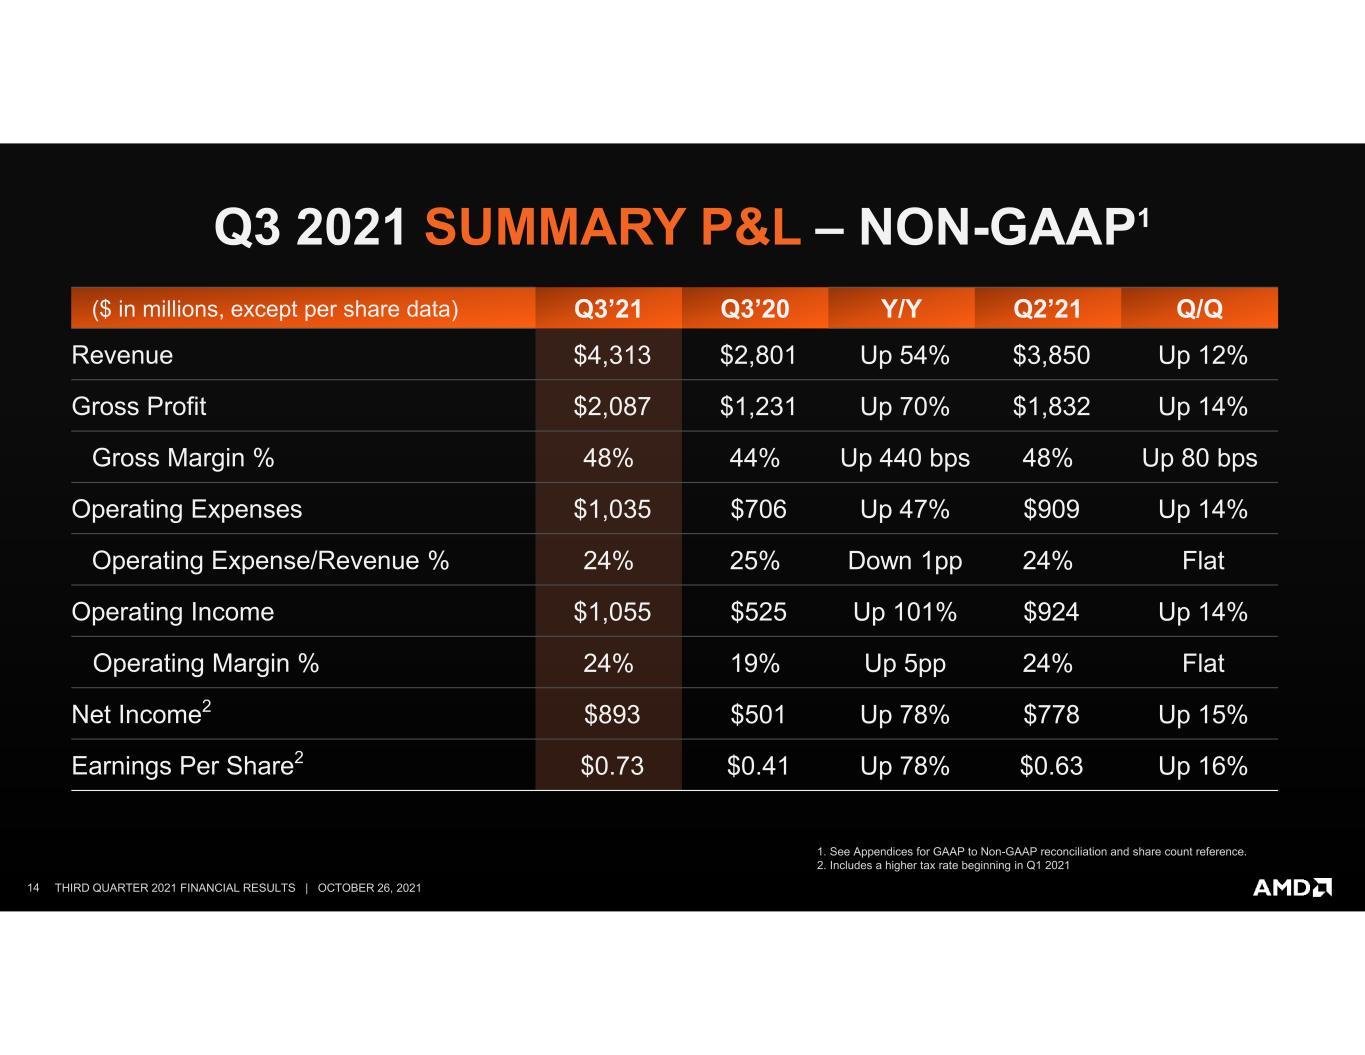
14 THIRD QUARTER 2021 FINANCIAL RESULTS | OCTOBER 26, 2021 ($ in millions, except per share data) Q3’21 Q3’20 Y/Y Q2’21 Q/Q Revenue $4,313 $2,801 Up 54% $3,850 Up 12% Gross Profit $2,087 $1,231 Up 70% $1,832 Up 14% Gross Margin % 48% 44% Up 440 bps 48% Up 80 bps Operating Expenses $1,035 $706 Up 47% $909 Up 14% Operating Expense/Revenue % 24% 25% Down 1pp 24% Flat Operating Income $1,055 $525 Up 101% $924 Up 14% Operating Margin % 24% 19% Up 5pp 24% Flat Net Income2 $893 $501 Up 78% $778 Up 15% Earnings Per Share2 $0.73 $0.41 Up 78% $0.63 Up 16% Q3 2021 SUMMARY P&L – NON-GAAP1 1. 1. See Appendices for GAAP to Non-GAAP reconciliation and share count reference. 2. 2. Includes a higher tax rate beginning in Q1 2021
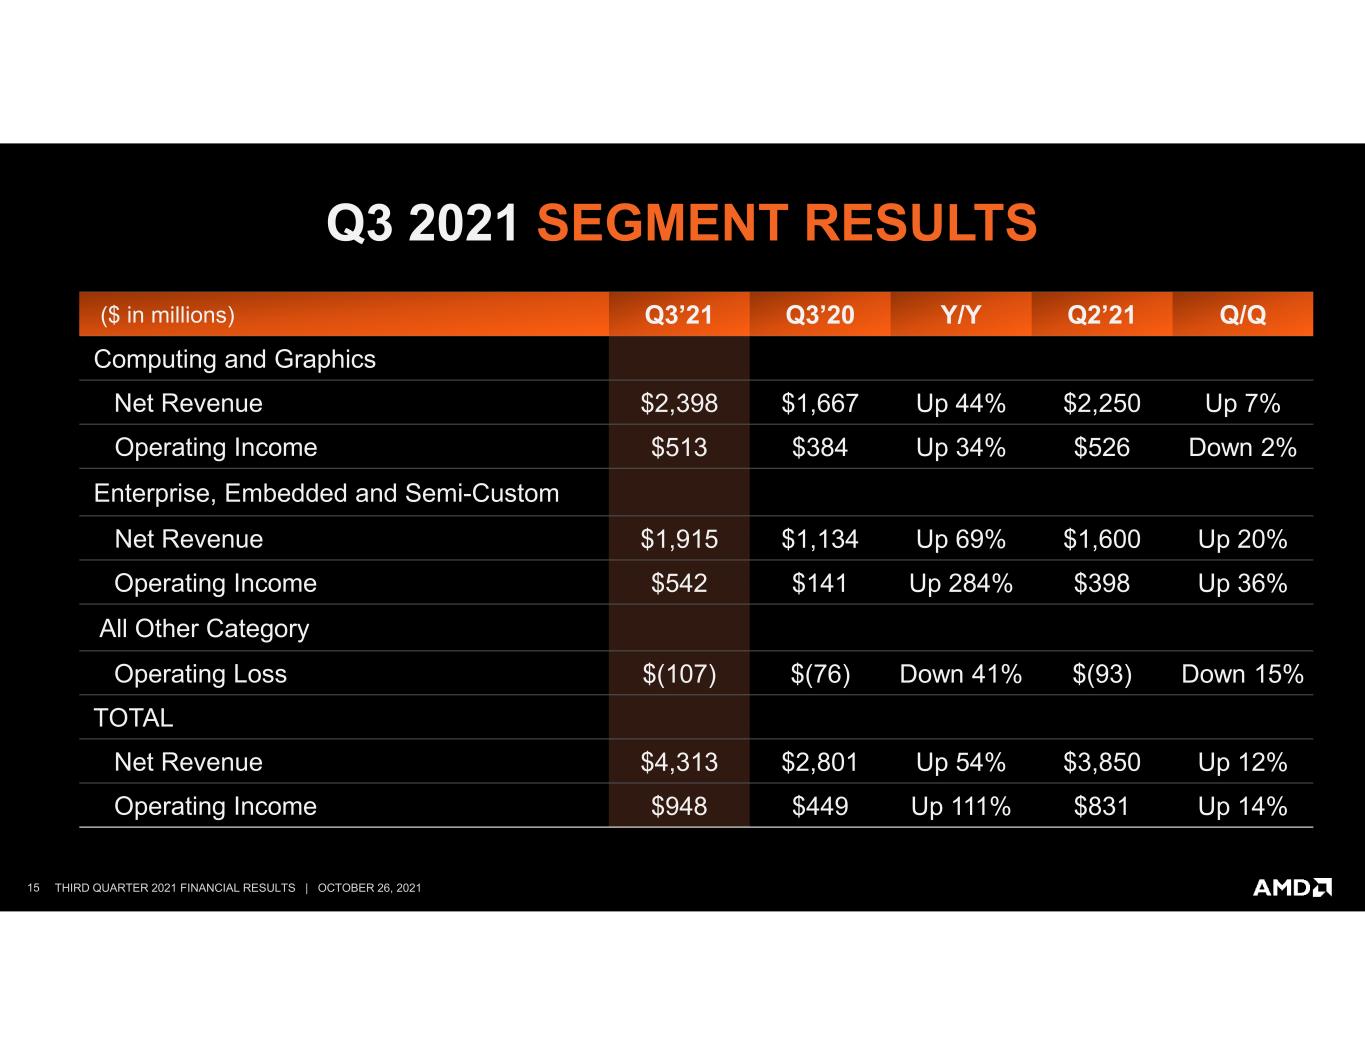
15 THIRD QUARTER 2021 FINANCIAL RESULTS | OCTOBER 26, 2021 Q3 2021 SEGMENT RESULTS ($ in millions) Q3’21 Q3’20 Y/Y Q2’21 Q/Q Computing and Graphics Net Revenue $2,398 $1,667 Up 44% $2,250 Up 7% Operating Income $513 $384 Up 34% $526 Down 2% Enterprise, Embedded and Semi-Custom Net Revenue $1,915 $1,134 Up 69% $1,600 Up 20% Operating Income $542 $141 Up 284% $398 Up 36% All Other Category Operating Loss $(107) $(76) Down 41% $(93) Down 15% TOTAL Net Revenue $4,313 $2,801 Up 54% $3,850 Up 12% Operating Income $948 $449 Up 111% $831 Up 14%
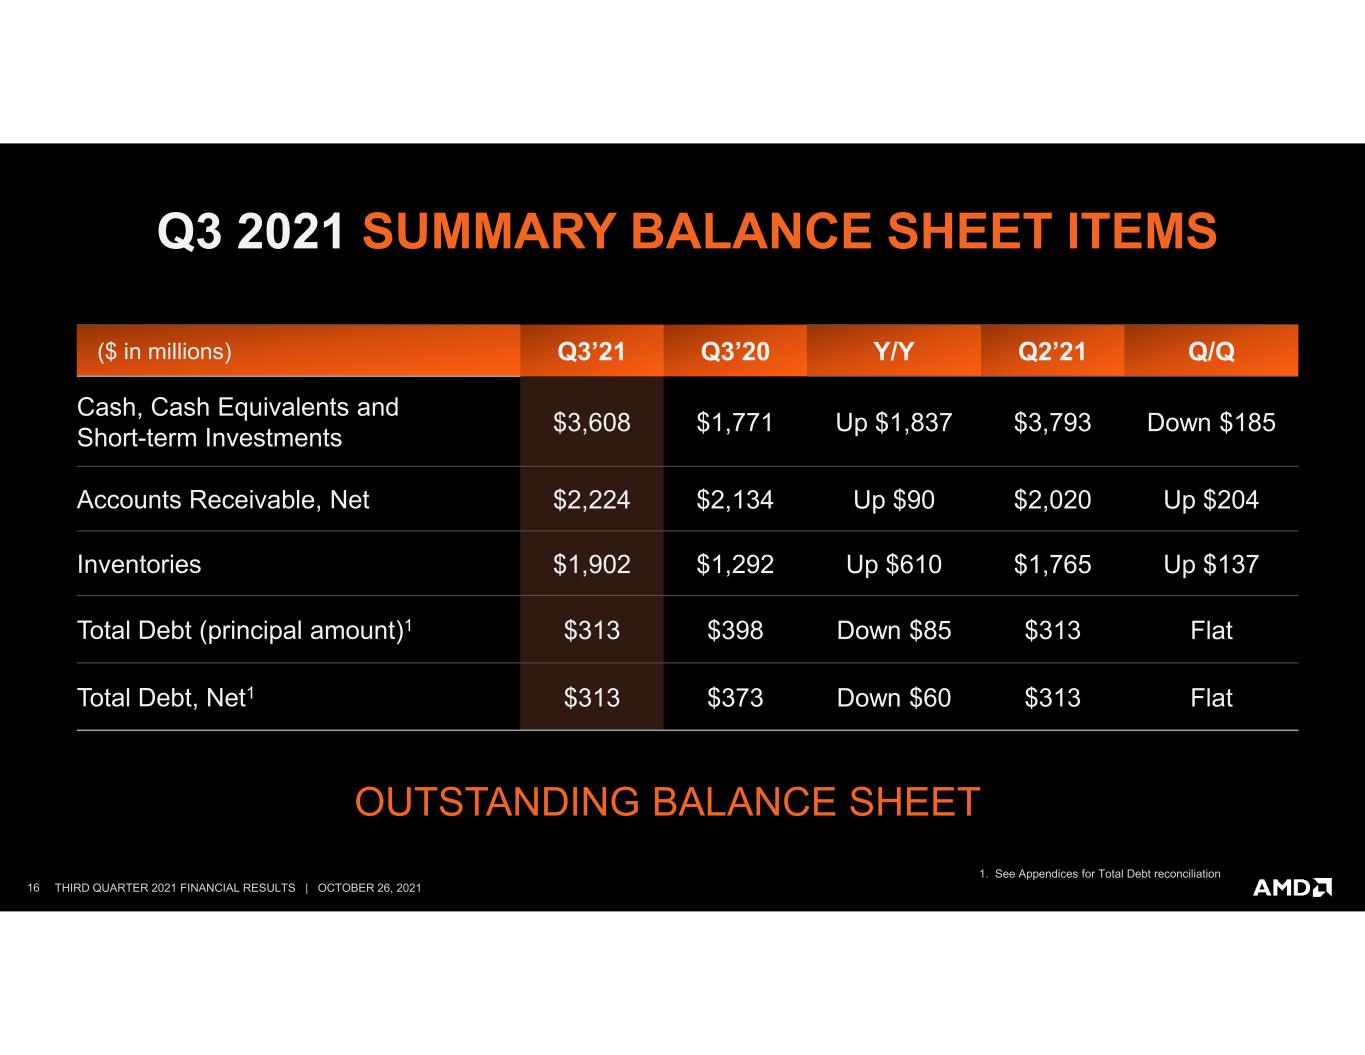
16 THIRD QUARTER 2021 FINANCIAL RESULTS | OCTOBER 26, 2021 Q3 2021 SUMMARY BALANCE SHEET ITEMS ($ in millions) Q3’21 Q3’20 Y/Y Q2’21 Q/Q Cash, Cash Equivalents and Short-term Investments $3,608 $1,771 Up $1,837 $3,793 Down $185 Accounts Receivable, Net $2,224 $2,134 Up $90 $2,020 Up $204 Inventories $1,902 $1,292 Up $610 $1,765 Up $137 Total Debt (principal amount)1 $313 $398 Down $85 $313 Flat Total Debt, Net1 $313 $373 Down $60 $313 Flat 1. See Appendices for Total Debt reconciliation OUTSTANDING BALANCE SHEET
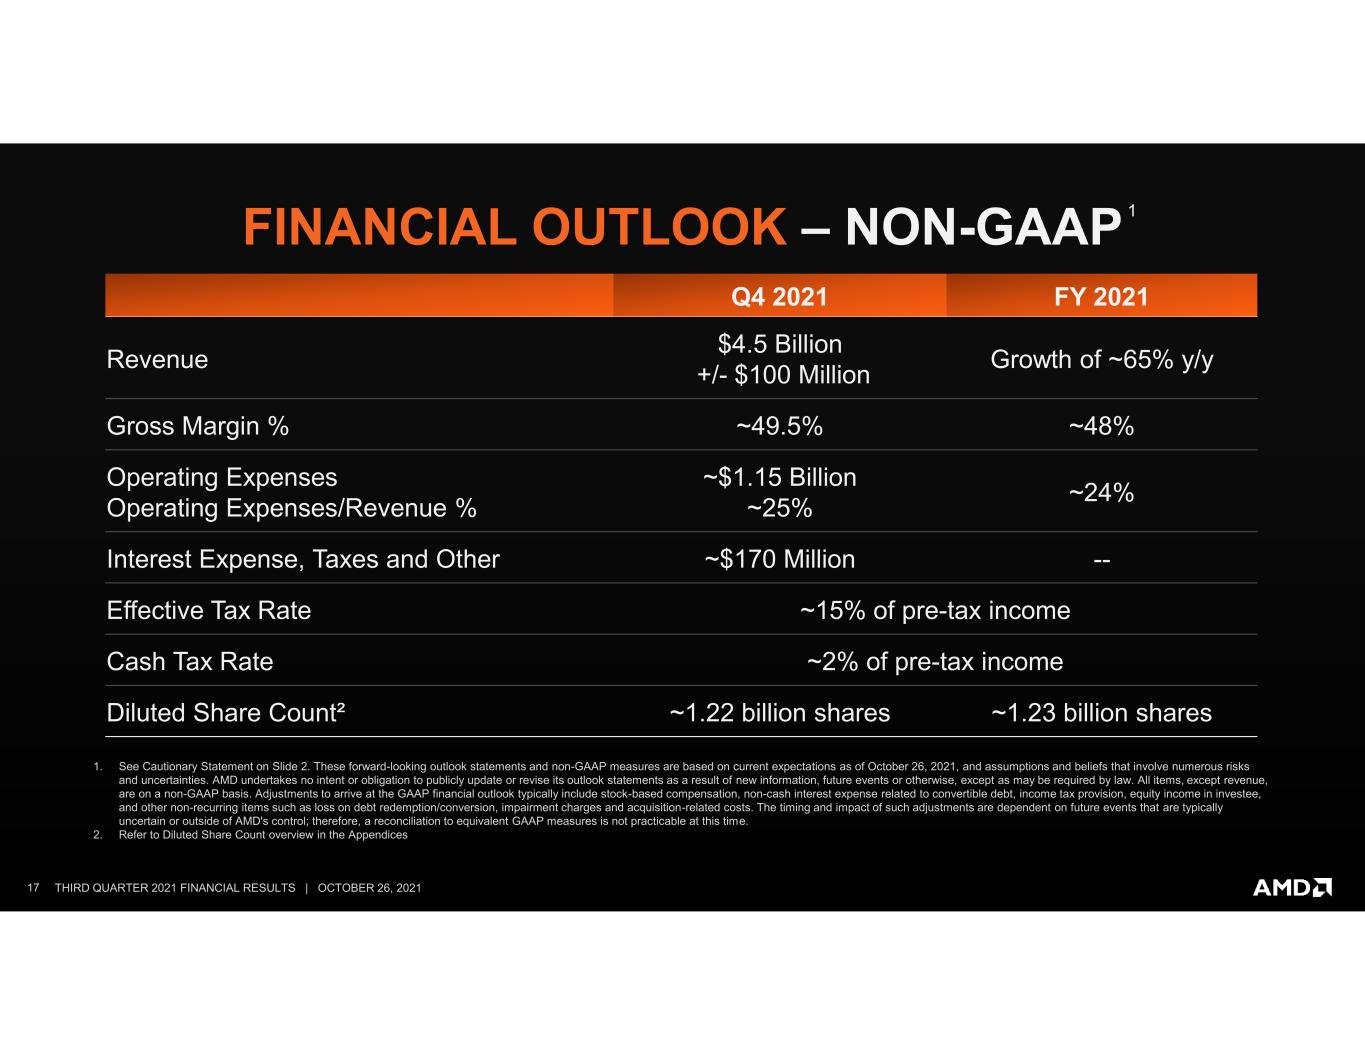
17 THIRD QUARTER 2021 FINANCIAL RESULTS | OCTOBER 26, 2021 1. See Cautionary Statement on Slide 2. These forward-looking outlook statements and non-GAAP measures are based on current expectations as of October 26, 2021, and assumptions and beliefs that involve numerous risks and uncertainties. AMD undertakes no intent or obligation to publicly update or revise its outlook statements as a result of new information, future events or otherwise, except as may be required by law. All items, except revenue, are on a non-GAAP basis. Adjustments to arrive at the GAAP financial outlook typically include stock-based compensation, non-cash interest expense related to convertible debt, income tax provision, equity income in investee, and other non-recurring items such as loss on debt redemption/conversion, impairment charges and acquisition-related costs. The timing and impact of such adjustments are dependent on future events that are typically uncertain or outside of AMD's control; therefore, a reconciliation to equivalent GAAP measures is not practicable at this time. 2. Refer to Diluted Share Count overview in the Appendices Q4 2021 FY 2021 Revenue $4.5 Billion +/- $100 Million Growth of ~65% y/y Gross Margin % ~49.5% ~48% Operating Expenses Operating Expenses/Revenue % ~$1.15 Billion ~25% ~24% Interest Expense, Taxes and Other ~$170 Million -- Effective Tax Rate ~15% of pre-tax income Cash Tax Rate ~2% of pre-tax income Diluted Share Count² ~1.22 billion shares ~1.23 billion shares FINANCIAL OUTLOOK – NON-GAAP 1

18 THIRD QUARTER 2021 FINANCIAL RESULTS | OCTOBER 26, 2021 Q3 2021 SUMMARY Operating Income Doubled Y/Y Gross Margin Grew More Than 4 pp Y/Y Quarterly Revenue Up 54% Y/Y, 12% Q/Q Repurchased $750M of Common Stock

19 THIRD QUARTER 2021 FINANCIAL RESULTS | OCTOBER 26, 2021 AMD’SCOMMITMENT TO ESG Steadfast commitment to environmental stewardship and contributing to our local communities ENVIRONMENTAL Delivering industry leading products with integrity, innovation and quality in order to help solve global challenges GOVERNANCE Creating a culture that drives innovation by fostering diversity, inclusion and belonging SOCIAL NEW CORPORATE RESPONSIBILITY REPORT ON AMD.COM

20 THIRD QUARTER 2021 FINANCIAL RESULTS | OCTOBER 26, 2021 BUILDING THE BEST Strong Shareholder Returns Execution Excellence Leadership Roadmaps Increasing Market Share
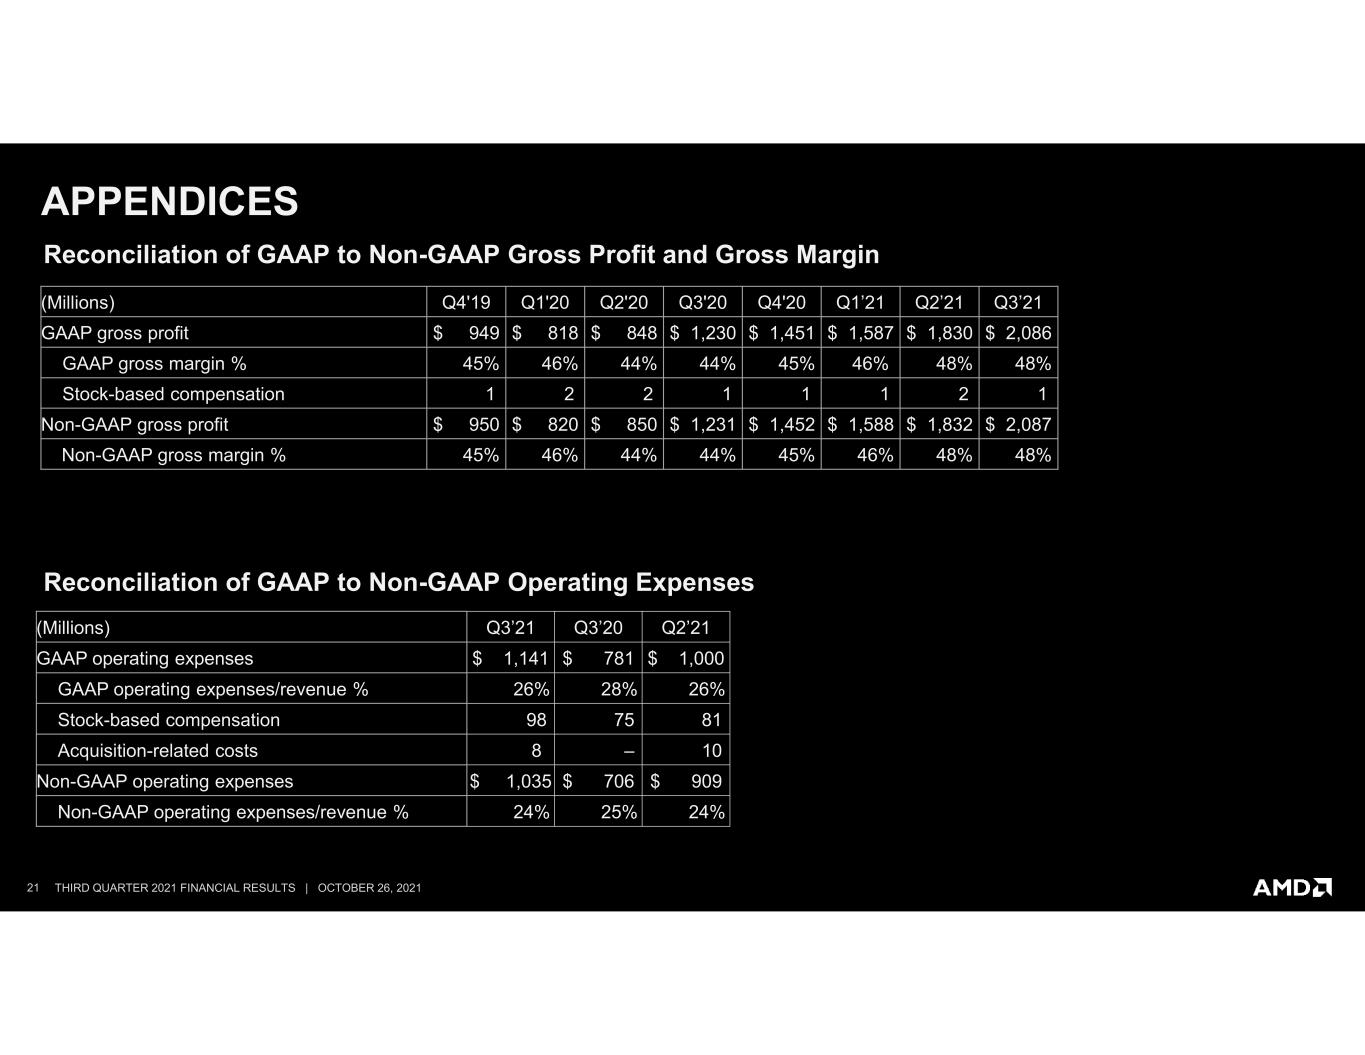
21 THIRD QUARTER 2021 FINANCIAL RESULTS | OCTOBER 26, 2021 APPENDICES Reconciliation of GAAP to Non-GAAP Gross Profit and Gross Margin (Millions) Q4'19 Q1'20 Q2'20 Q3'20 Q4'20 Q1’21 Q2’21 Q3’21 GAAP gross profit $ 949 $ 818 $ 848 $ 1,230 $ 1,451 $ 1,587 $ 1,830 $ 2,086 GAAP gross margin % 45% 46% 44% 44% 45% 46% 48% 48% Stock-based compensation 1 2 2 1 1 1 2 1 Non-GAAP gross profit $ 950 $ 820 $ 850 $ 1,231 $ 1,452 $ 1,588 $ 1,832 $ 2,087 Non-GAAP gross margin % 45% 46% 44% 44% 45% 46% 48% 48% Reconciliation of GAAP to Non-GAAP Operating Expenses (Millions) Q3’21 Q3’20 Q2’21 GAAP operating expenses $ 1,141 $ 781 $ 1,000 GAAP operating expenses/revenue % 26% 28% 26% Stock-based compensation 98 75 81 Acquisition-related costs 8 – 10 Non-GAAP operating expenses $ 1,035 $ 706 $ 909 Non-GAAP operating expenses/revenue % 24% 25% 24%
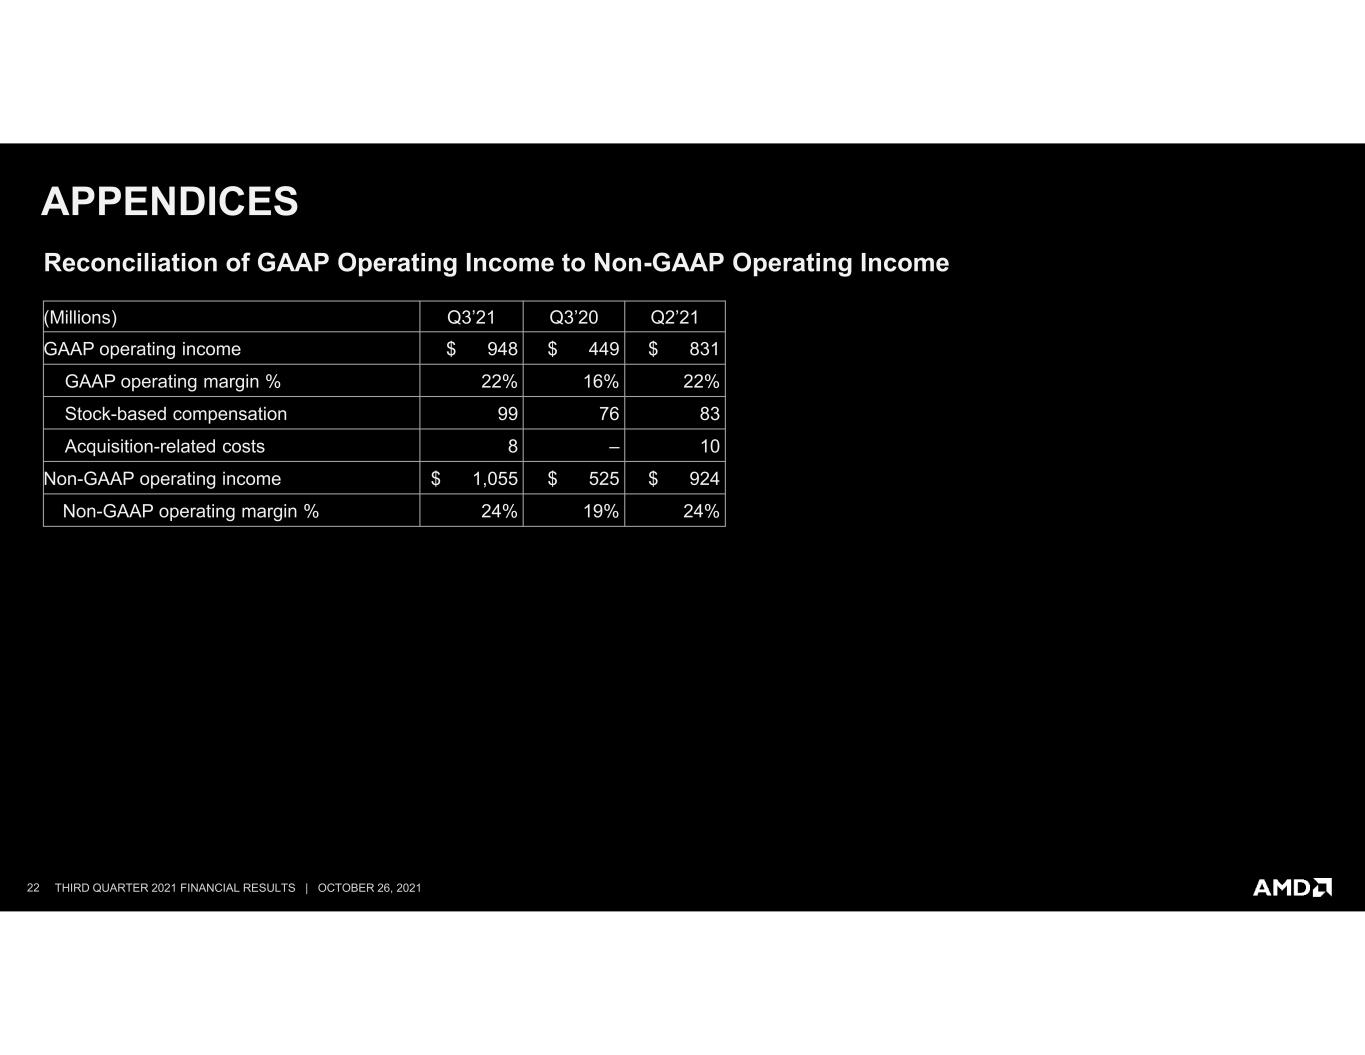
22 THIRD QUARTER 2021 FINANCIAL RESULTS | OCTOBER 26, 2021 APPENDICES Reconciliation of GAAP Operating Income to Non-GAAP Operating Income (Millions) Q3’21 Q3’20 Q2’21 GAAP operating income $ 948 $ 449 $ 831 GAAP operating margin % 22% 16% 22% Stock-based compensation 99 76 83 Acquisition-related costs 8 – 10 Non-GAAP operating income $ 1,055 $ 525 $ 924 Non-GAAP operating margin % 24% 19% 24%
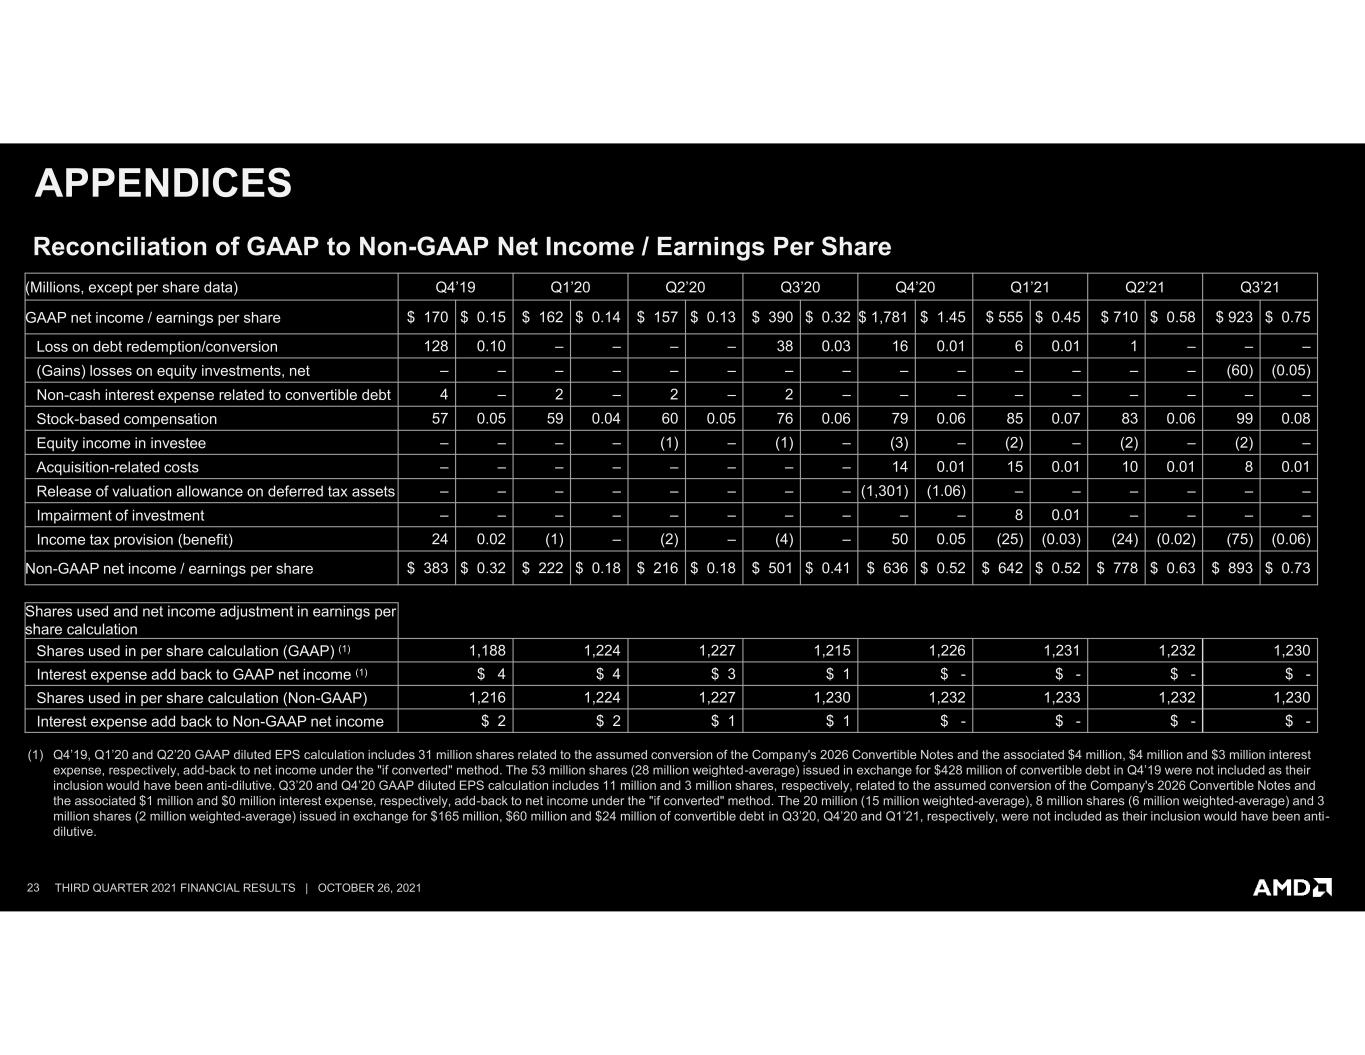
23 THIRD QUARTER 2021 FINANCIAL RESULTS | OCTOBER 26, 2021 APPENDICES Reconciliation of GAAP to Non-GAAP Net Income / Earnings Per Share (1) Q4’19, Q1’20 and Q2’20 GAAP diluted EPS calculation includes 31 million shares related to the assumed conversion of the Company's 2026 Convertible Notes and the associated $4 million, $4 million and $3 million interest expense, respectively, add-back to net income under the "if converted" method. The 53 million shares (28 million weighted-average) issued in exchange for $428 million of convertible debt in Q4’19 were not included as their inclusion would have been anti-dilutive. Q3’20 and Q4’20 GAAP diluted EPS calculation includes 11 million and 3 million shares, respectively, related to the assumed conversion of the Company's 2026 Convertible Notes and the associated $1 million and $0 million interest expense, respectively, add-back to net income under the "if converted" method. The 20 million (15 million weighted-average), 8 million shares (6 million weighted-average) and 3 million shares (2 million weighted-average) issued in exchange for $165 million, $60 million and $24 million of convertible debt in Q3’20, Q4’20 and Q1’21, respectively, were not included as their inclusion would have been anti- dilutive. (Millions, except per share data) Q4’19 Q1’20 Q2’20 Q3’20 Q4’20 Q1’21 Q2’21 Q3’21 GAAP net income / earnings per share $ 170 $ 0.15 $ 162 $ 0.14 $ 157 $ 0.13 $ 390 $ 0.32 $ 1,781 $ 1.45 $ 555 $ 0.45 $ 710 $ 0.58 $ 923 $ 0.75 Loss on debt redemption/conversion 128 0.10 – – – – 38 0.03 16 0.01 6 0.01 1 – – – (Gains) losses on equity investments, net – – – – – – – – – – – – – – (60) (0.05) Non-cash interest expense related to convertible debt 4 – 2 – 2 – 2 – – – – – – – – – Stock-based compensation 57 0.05 59 0.04 60 0.05 76 0.06 79 0.06 85 0.07 83 0.06 99 0.08 Equity income in investee – – – – (1) – (1) – (3) – (2) – (2) – (2) – Acquisition-related costs – – – – – – – – 14 0.01 15 0.01 10 0.01 8 0.01 Release of valuation allowance on deferred tax assets – – – – – – – – (1,301) (1.06) – – – – – – Impairment of investment – – – – – – – – – – 8 0.01 – – – – Income tax provision (benefit) 24 0.02 (1) – (2) – (4) – 50 0.05 (25) (0.03) (24) (0.02) (75) (0.06) Non-GAAP net income / earnings per share $ 383 $ 0.32 $ 222 $ 0.18 $ 216 $ 0.18 $ 501 $ 0.41 $ 636 $ 0.52 $ 642 $ 0.52 $ 778 $ 0.63 $ 893 $ 0.73 Shares used and net income adjustment in earnings per share calculation Shares used in per share calculation (GAAP) (1) 1,188 1,224 1,227 1,215 1,226 1,231 1,232 1,230 Interest expense add back to GAAP net income (1) $ 4 $ 4 $ 3 $ 1 $ - $ - $ - $ - Shares used in per share calculation (Non-GAAP) 1,216 1,224 1,227 1,230 1,232 1,233 1,232 1,230 Interest expense add back to Non-GAAP net income $ 2 $ 2 $ 1 $ 1 $ - $ - $ - $ -
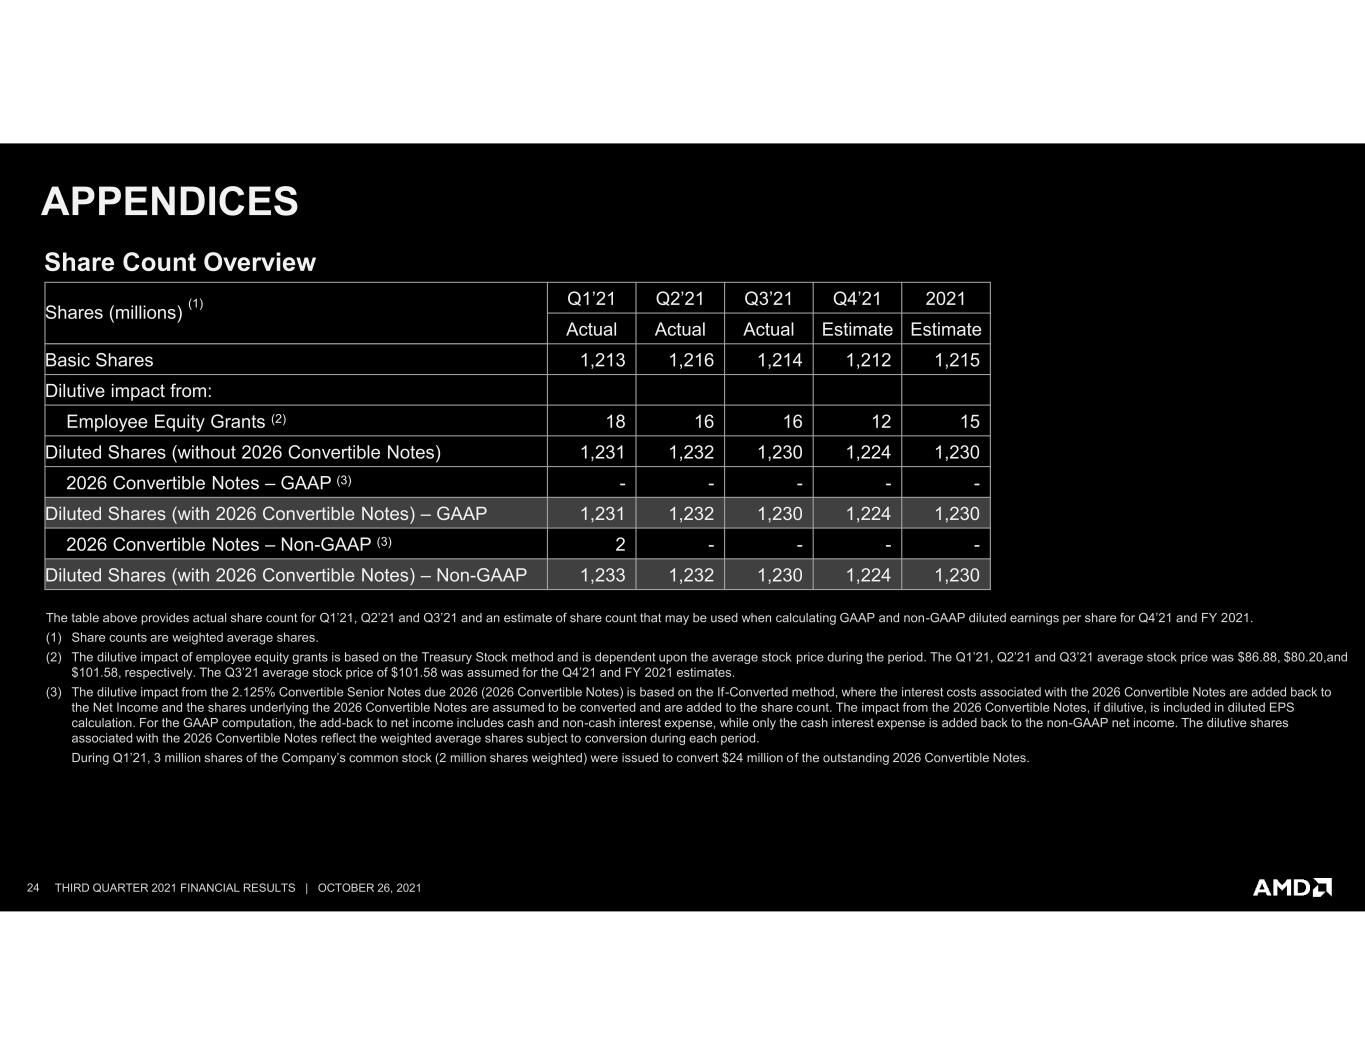
24 THIRD QUARTER 2021 FINANCIAL RESULTS | OCTOBER 26, 2021 APPENDICES Share Count Overview Shares (millions) (1) Q1’21 Q2’21 Q3’21 Q4’21 2021 Actual Actual Actual Estimate Estimate Basic Shares 1,213 1,216 1,214 1,212 1,215 Dilutive impact from: Employee Equity Grants (2) 18 16 16 12 15 Diluted Shares (without 2026 Convertible Notes) 1,231 1,232 1,230 1,224 1,230 2026 Convertible Notes – GAAP (3) - - - - - Diluted Shares (with 2026 Convertible Notes) – GAAP 1,231 1,232 1,230 1,224 1,230 2026 Convertible Notes – Non-GAAP (3) 2 - - - - Diluted Shares (with 2026 Convertible Notes) – Non-GAAP 1,233 1,232 1,230 1,224 1,230 The table above provides actual share count for Q1’21, Q2’21 and Q3’21 and an estimate of share count that may be used when calculating GAAP and non-GAAP diluted earnings per share for Q4’21 and FY 2021. (1) Share counts are weighted average shares. (2) The dilutive impact of employee equity grants is based on the Treasury Stock method and is dependent upon the average stock price during the period. The Q1’21, Q2’21 and Q3’21 average stock price was $86.88, $80.20,and $101.58, respectively. The Q3’21 average stock price of $101.58 was assumed for the Q4’21 and FY 2021 estimates. (3) The dilutive impact from the 2.125% Convertible Senior Notes due 2026 (2026 Convertible Notes) is based on the If-Converted method, where the interest costs associated with the 2026 Convertible Notes are added back to the Net Income and the shares underlying the 2026 Convertible Notes are assumed to be converted and are added to the share count. The impact from the 2026 Convertible Notes, if dilutive, is included in diluted EPS calculation. For the GAAP computation, the add-back to net income includes cash and non-cash interest expense, while only the cash interest expense is added back to the non-GAAP net income. The dilutive shares associated with the 2026 Convertible Notes reflect the weighted average shares subject to conversion during each period. During Q1’21, 3 million shares of the Company’s common stock (2 million shares weighted) were issued to convert $24 million of the outstanding 2026 Convertible Notes.
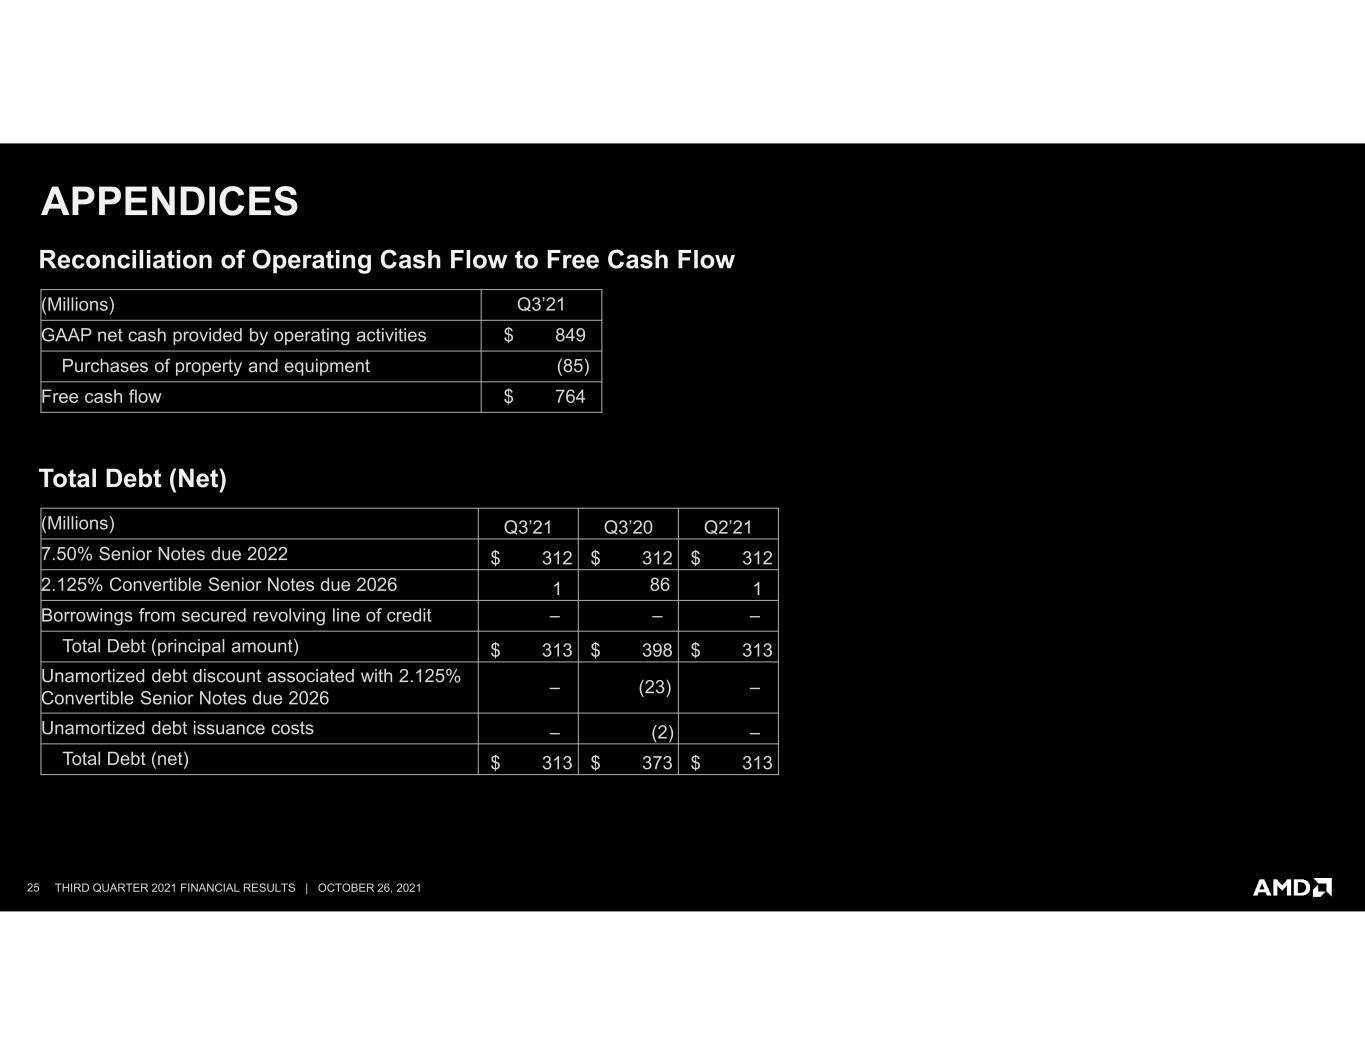
25 THIRD QUARTER 2021 FINANCIAL RESULTS | OCTOBER 26, 2021 APPENDICES Total Debt (Net) (Millions) Q3’21 Q3’20 Q2’21 7.50% Senior Notes due 2022 $ 312 $ 312 $ 312 2.125% Convertible Senior Notes due 2026 1 86 1 Borrowings from secured revolving line of credit – – – Total Debt (principal amount) $ 313 $ 398 $ 313 Unamortized debt discount associated with 2.125% Convertible Senior Notes due 2026 – (23) – Unamortized debt issuance costs – (2) – Total Debt (net) $ 313 $ 373 $ 313 Reconciliation of Operating Cash Flow to Free Cash Flow (Millions) Q3’21 GAAP net cash provided by operating activities $ 849 Purchases of property and equipment (85) Free cash flow $ 764
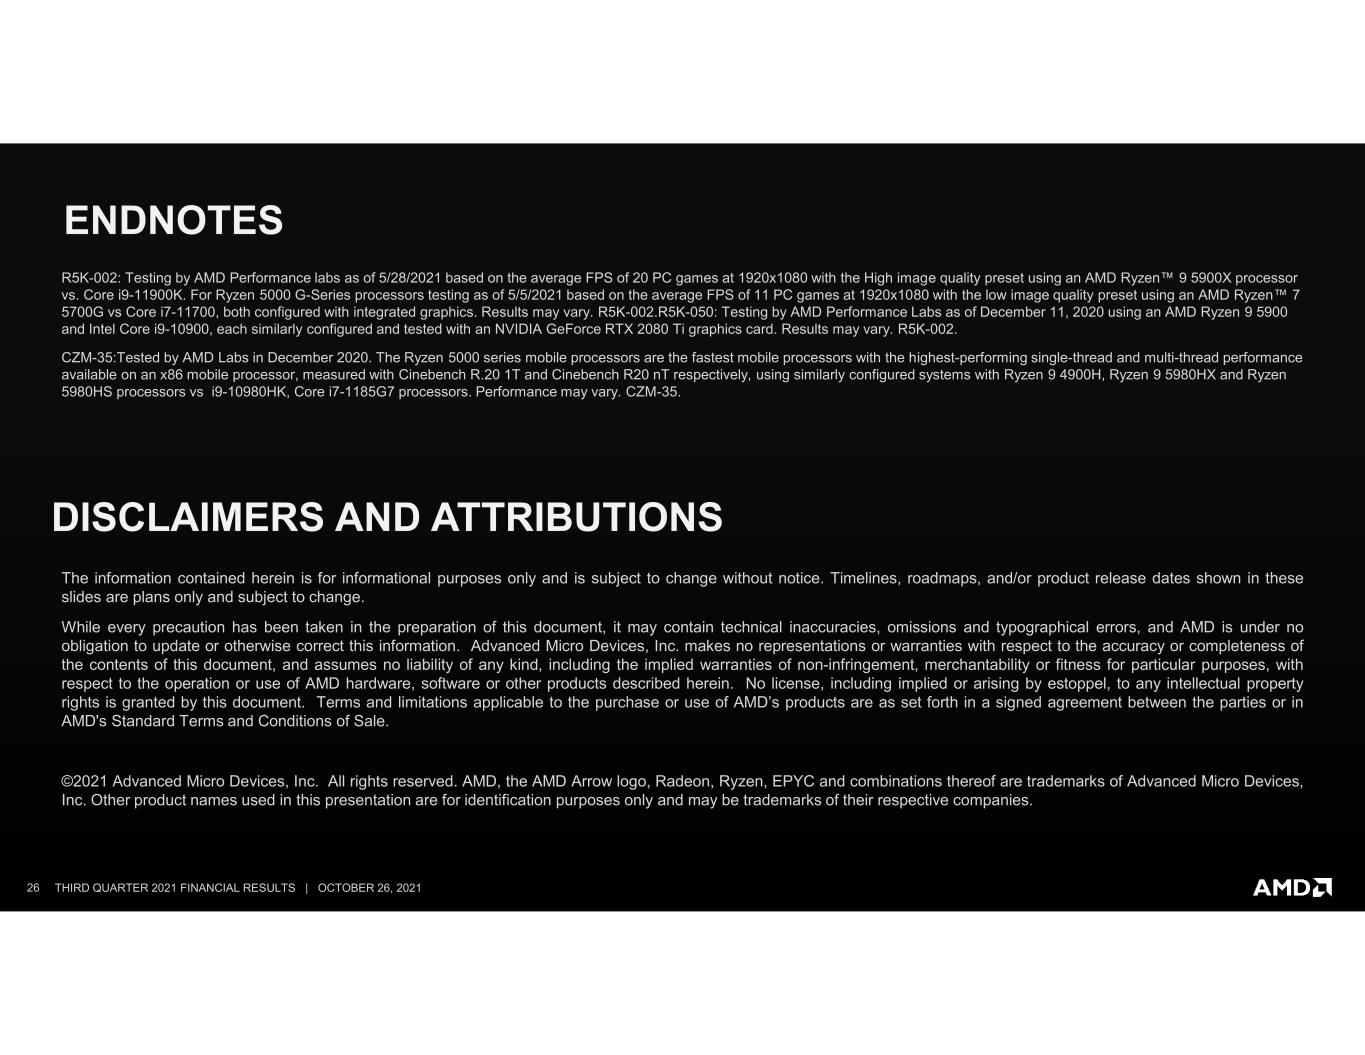
26 THIRD QUARTER 2021 FINANCIAL RESULTS | OCTOBER 26, 2021 ENDNOTES R5K-002: Testing by AMD Performance labs as of 5/28/2021 based on the average FPS of 20 PC games at 1920x1080 with the High image quality preset using an AMD Ryzen™ 9 5900X processor vs. Core i9-11900K. For Ryzen 5000 G-Series processors testing as of 5/5/2021 based on the average FPS of 11 PC games at 1920x1080 with the low image quality preset using an AMD Ryzen™ 7 5700G vs Core i7-11700, both configured with integrated graphics. Results may vary. R5K-002.R5K-050: Testing by AMD Performance Labs as of December 11, 2020 using an AMD Ryzen 9 5900 and Intel Core i9-10900, each similarly configured and tested with an NVIDIA GeForce RTX 2080 Ti graphics card. Results may vary. R5K-002. CZM-35:Tested by AMD Labs in December 2020. The Ryzen 5000 series mobile processors are the fastest mobile processors with the highest-performing single-thread and multi-thread performance available on an x86 mobile processor, measured with Cinebench R.20 1T and Cinebench R20 nT respectively, using similarly configured systems with Ryzen 9 4900H, Ryzen 9 5980HX and Ryzen 5980HS processors vs i9-10980HK, Core i7-1185G7 processors. Performance may vary. CZM-35. DISCLAIMERS AND ATTRIBUTIONS The information contained herein is for informational purposes only and is subject to change without notice. Timelines, roadmaps, and/or product release dates shown in these slides are plans only and subject to change. While every precaution has been taken in the preparation of this document, it may contain technical inaccuracies, omissions and typographical errors, and AMD is under no obligation to update or otherwise correct this information. Advanced Micro Devices, Inc. makes no representations or warranties with respect to the accuracy or completeness of the contents of this document, and assumes no liability of any kind, including the implied warranties of non-infringement, merchantability or fitness for particular purposes, with respect to the operation or use of AMD hardware, software or other products described herein. No license, including implied or arising by estoppel, to any intellectual property rights is granted by this document. Terms and limitations applicable to the purchase or use of AMD’s products are as set forth in a signed agreement between the parties or in AMD's Standard Terms and Conditions of Sale. ©2021 Advanced Micro Devices, Inc. All rights reserved. AMD, the AMD Arrow logo, Radeon, Ryzen, EPYC and combinations thereof are trademarks of Advanced Micro Devices, Inc. Other product names used in this presentation are for identification purposes only and may be trademarks of their respective companies.