10-K: Annual report pursuant to Section 13 and 15(d)
Published on February 27, 2023
UNITED STATES SECURITIES AND EXCHANGE COMMISSION
Washington, D.C. 20549
FORM 10-K
(Mark One)
| ANNUAL REPORT PURSUANT TO SECTION 13 OR 15(d) OF THE SECURITIES EXCHANGE ACT OF 1934. | |||||
For the fiscal year ended |
|||||
| OR | |||||
| TRANSITION REPORT PURSUANT TO SECTION 13 OR 15(d) OF THE SECURITIES EXCHANGE ACT OF 1934. | |||||
For the transition period from to
|
|||||
Commission File Number 001-07882

(Exact name of registrant as specified in its charter)
| (State or other jurisdiction of incorporation or organization) | (I.R.S. Employer Identification No.) | ||||
(Address of principal executive offices)
(408 ) 749-4000
(Registrant’s telephone number, including area code)
Securities registered pursuant to Section 12(b) of the Act:
| (Title of each class) | (Trading symbol) | (Name of each exchange on which registered) | ||||||
Securities registered pursuant to Section 12(g) of the Act:
None
Indicate by check mark if the registrant is a well-known seasoned issuer, as defined in Rule 405 of the Securities Act. Yes ☑ No ☐
Indicate by check mark if the registrant is not required to file reports pursuant to Section 13 or Section 15(d) of the Exchange Act. Yes ☐ No ☑
Indicate by check mark whether the registrant (1) has filed all reports required to be filed by Section 13 or 15(d) of the Securities Exchange Act of 1934 during the preceding 12 months (or for such shorter period that the registrant was required to file such reports), and (2) has been subject to such filing requirements for the past 90 days. Yes ☑ No ☐
Indicate by check mark whether the registrant has submitted electronically every Interactive Data File required to be submitted pursuant to Rule 405 of Regulation S-T during the preceding 12 months (or for such shorter period that the registrant was required to submit such files): Yes ☑ No ☐
Indicate by check mark whether the registrant is a large accelerated filer, an accelerated filer, a non-accelerated filer, a smaller reporting company, or an emerging growth company. See definition of “large accelerated filer,” “accelerated filer,” “smaller reporting company,” and “emerging growth company” in Rule 12b-2 of the Exchange Act.
| ☑ | Accelerated filer | ☐ | Non-accelerated filer | ☐ | Smaller reporting company | Emerging growth company | |||||||||||||||||||||||
If an emerging growth company, indicate by check mark if the registrant has elected not to use the extended transition period for complying with any new or revised financial accounting standards provided pursuant to Section 13(a) of the Exchange Act. ☐
Indicate by check mark whether the registrant has filed a report on and attestation to its management’s assessment of the effectiveness of its internal control over financial reporting under Section 404(b) of the Sarbanes-Oxley Act (15 U.S.C.7262(b)) by the registered public accounting firm that prepared or issued its audit report. ☑
If securities are registered pursuant to Section 12(b) of the Act, indicate by check mark whether the financial statements of the registrant included in the filing reflect the correction of an error to previously issued financial statements. ☐
Indicate by check mark whether any of those error corrections are restatements that required a recovery analysis of incentive-based compensation received by any of the registrant’s executive officers during the relevant recovery period pursuant to §240.10D-1(b). ☐
Indicate by check mark whether the registrant is a shell company (as defined by Rule 12b-2 of the Exchange Act). Yes ☐ No ☑
As of June 24, 2022, the aggregate market value of the registrant’s common stock held by non-affiliates of the registrant was approximately $139.8 billion based on the reported closing sale price of $87.08 per share as reported on The NASDAQ Global Select Market (NASDAQ) on June 24, 2022, which was the last business day of the registrant’s most recently completed second fiscal quarter.
Indicate the number of shares outstanding of each of the registrant’s classes of common stock, as of the latest practicable date: 1,611,388,217 shares of common stock, $0.01 par value per share, as of February 22, 2023.
DOCUMENTS INCORPORATED BY REFERENCE
INDEX
ITEM 6. |
||||||||
PART I
ITEM 1. BUSINESS
Cautionary Statement Regarding Forward-Looking Statements
The statements in this report include forward-looking statements within the meaning of the Private Securities Litigation Reform Act of 1995. These forward-looking statements are based on current expectations and beliefs and involve numerous risks and uncertainties that could cause actual results to differ materially from expectations. These forward-looking statements speak only as of the date hereof or as of the dates indicated in the statements and should not be relied upon as predictions of future events, as we cannot assure you that the events or circumstances reflected in these statements will be achieved or will occur. You can identify forward-looking statements by the use of forward-looking terminology including “believes,” “expects,” “may,” “will,” “should,” “seeks,” “intends,” “plans,” “pro forma,” “estimates,” “anticipates,” or the negative of these words and phrases, other variations of these words and phrases or comparable terminology. The forward-looking statements relate to, among other things: possible impact of future accounting rules on AMD’s consolidated financial statements; demand for AMD’s products; the growth, change and competitive landscape of the markets in which AMD participates; international sales will continue to be a significant portion of total sales in the foreseeable future; that AMD’s cash, cash equivalents and short-term investment balances together with the availability under that certain revolving credit facility (the Revolving Credit Agreement) made available to AMD and certain of its subsidiaries, our commercial paper program, and our cash flows from operations will be sufficient to fund AMD’s operations including capital expenditures and purchase commitments over the next 12 months and beyond; AMD’s ability to obtain sufficient external financing on favorable terms, or at all; AMD’s expectation that based on management’s current knowledge, the potential liability related to AMD’s current litigation will not have a material adverse effect on its financial position, results of operation or cash flows; anticipated ongoing and increased costs related to enhancing and implementing information security controls; all unbilled accounts receivables are expected to be billed and collected within 12 months; revenue allocated to remaining performance obligations that are unsatisfied which will be recognized in the next 12 months; and a small number of customers will continue to account for a substantial part of AMD’s revenue in the future. For a discussion of the factors that could cause actual results to differ materially from the forward-looking statements, see “Part I, Item 1A-Risk Factors” and the “Financial Condition” section set forth in “Part II, Item 7-Management’s Discussion and Analysis of Financial Condition and Results of Operations,” or MD&A, and such other risks and uncertainties as set forth below in this report or detailed in our other Securities and Exchange Commission (SEC) reports and filings. We assume no obligation to update forward-looking statements.
References in this Annual Report on Form 10-K to “AMD,” “we,” “us,” “management,” “our” or the “Company” mean Advanced Micro Devices, Inc. and our consolidated subsidiaries.
Overview
We are a global semiconductor company primarily offering:
•server microprocessors (CPUs) and graphics processing units (GPUs), data processing units (DPUs), Field Programmable Gate Arrays (FPGAs), and Adaptive System-on-Chip (SoC) products for data centers;
•CPUs, accelerated processing units (APUs) that integrate CPUs and GPUs, and chipsets for desktop and notebook personal computers;
•discrete GPUs, and semi-custom SoC products and development services; and
•embedded CPUs, GPUs, APUs, FPGAs, and Adaptive SoC products.
From time to time, we may also sell or license portions of our intellectual property (IP) portfolio.
1
Additional Information
AMD was incorporated under the laws of Delaware on May 1, 1969 and became a publicly held company in 1972. Our common stock is currently listed on The NASDAQ Global Select Market (NASDAQ) under the symbol “AMD”. Our mailing address and executive offices are located at 2485 Augustine Drive, Santa Clara, California 95054, and our telephone number is (408) 749-4000. For financial information about geographic areas and for segment information with respect to revenues and operating results, refer to the information set forth in Note 4 of our consolidated financial statements. We use a 52- or 53-week fiscal year ending on the last Saturday in December. References in this report to 2022, 2021 and 2020 refer to the fiscal year unless explicitly stated otherwise.
AMD, the AMD Arrow logo, AMD CDNA, AMD Instinct, AMD RDNA, Alveo, Artix, Athlon, CoolRunner, EPYC, FidelityFX, FirePro, FreeSync, Geode, Infinity Fabric, Kinex, Pensando, Radeon, Radeon Instinct, ROCm, Ryzen, Spartan, Threadripper, UltraScale, UltraScale+, V-Cache, Versal, Virtex, Vitis, Vivado, Xilinx, Zynq and combinations thereof are trademarks of Advanced Micro Devices, Inc.
Microsoft, Windows, DirectX and Xbox One are either registered trademarks or trademarks of Microsoft Corporation in the United States and/or other countries. PCIe is a registered trademark of PCI-SIG Corporation. Linux is the registered trademark of Linus Torvalds in the United States and other countries. PlayStation is a registered trademark or trademark of Sony Interactive Entertainment, Inc. Arm is a registered trademark of ARM Limited (or its subsidiaries) in the United States and/or elsewhere. Vulkan and the Vulkan logo are registered trademarks of Khronos Group Inc. Steam and the Steam logo are trademarks and/or registered trademarks of Valve Corporation in the United States and/or other countries.
Other names are for informational purposes only and are used to identify companies and products and may be trademarks of their respective owners.
Website Access to Our SEC Filings and Corporate Governance Documents
On the Investor Relations pages of our website, http://ir.amd.com, we post links to our filings with the SEC, our Principles of Corporate Governance, our Code of Ethics for our executive officers, all other senior finance executives and certain representatives from legal and internal audit, our Worldwide Standards of Business Conduct, which applies to our Board of Directors and all of our employees, and the charters of the committees of our Board of Directors. Our filings with the SEC are posted as soon as reasonably practical after they are electronically filed with, or furnished to, the SEC. The SEC website, www.sec.gov, contains reports, proxy and information statements, and other information regarding issuers that file electronically with the SEC. You can also obtain copies of these documents by writing to us at: Corporate Secretary, AMD, 7171 Southwest Parkway, M/S B100.T, Austin, Texas 78735, or emailing us at: Corporate.Secretary@amd.com. All of these documents and filings are available free of charge.
If we make substantive amendments to our Code of Ethics or grant any waiver, including any implicit waiver, to our principal executive officer, principal financial officer, principal accounting officer, controller or persons performing similar functions, we intend to disclose the nature of such amendment or waiver on our website.
The information contained on our website is not incorporated by reference in, or considered to be a part of, this report.
Our Industry
We are a global semiconductor company. Semiconductors are components used in a variety of electronic products and systems. An integrated circuit (IC) is a semiconductor device that consists of many interconnected transistors on a single chip. Since the invention of the transistor in 1948, improvements in IC process and design technologies have led to the development of smaller, more complex and more reliable ICs at a lower cost-per-function.
2
Our Strategy
AMD is focused on high-performance and adaptive computing technology, software and product leadership. Our strategy is to create and deliver the world’s leading high-performance and adaptive computing products across a diverse set of markets including the data center, embedded, client and gaming. Our strategy is focused on five strategic pillars: compute technology leadership, expanding data center leadership, enabling pervasive artificial intelligence (AI), providing software platforms and developer enablement, and designing custom silicon and solutions.
We invest in high-performance CPUs for cloud infrastructure, enterprise, edge, supercomputing, and PCs. We invest in high-performance GPUs and software for markets such as gaming, compute, AI, and virtual reality (VR) and augmented reality (AR). With the acquisition of Xilinx, Inc. (XIlinx) in February 2022, our product portfolio now includes FPGAs and Adaptive SoCs used in the data center and embedded markets. Also, with the acquisition of Pensando Systems, Inc. in May 2022, we offer high-performance DPUs and next generation data center solutions.
We leverage our high-performance CPU, GPU, FPGA and DPU product portfolios to deliver solutions that are differentiated at the chip level, such as our semi-custom SoCs, Adaptive SoCs, and APUs, and at the systems level, such as PCs, embedded platforms and servers. To expand our data center presence, we now offer the industry’s strongest portfolio of data center computing solutions based on our CPUs, high-performance GPUs, DPUs, FPGAs, and Adaptive SoCs. We have a broad technology roadmap and products targeting AI training and inference spanning cloud, edge and intelligent endpoints. We achieve this through our family of CPUs, GPUs, FPGAs, and Adaptive SoCs.
We develop world-class software platforms that are used to enable our high-performance products. Our software platforms include development tools, compilers, and drivers for our CPUs, GPUs and FPGAs. We work closely with our customers to define and develop customized solutions to precisely match their requirements. We enable this by combining our broad portfolio of high-performance IP with our leadership design and packaging to deliver world-class customized solutions to our customers. We invest in innovative technology and solutions such as our custom-ready chiplet platform and AMD Infinity Architecture to maintain our leadership position as a custom-design silicon provider of choice.
Our four reportable segments are:
•the Data Center segment, which primarily includes server CPUs and GPUs, DPUs, FPGAs, and Adaptive SoC products for data centers;
•the Client segment, which primarily includes CPUs, APUs, and chipsets for desktop and notebook personal computers;
•the Gaming segment, which primarily includes discrete GPUs, semi-custom SoC products and development services; and
•the Embedded segment, which primarily includes embedded CPUs, GPUs, APUs, FPGAs and Adaptive SoC products.
From time to time, we may also sell or license portions of our IP portfolio.
In addition to these reportable segments, we have an All Other category, which is not a reportable segment.
Data Center Segment
Data Center Market
The Data Center segment primarily includes server CPUs, GPUs, DPUs, FPGAs, and Adaptive SoC products. We leverage our technology to address the computational and visual data processing needs in the data center market. Modern data centers require high performance, energy efficient, scalable and adaptable compute engines to meet the demand driven by the growing amount of data that needs to be stored, accessed, analyzed and managed. Different combinations of CPUs, GPUs, DPUs, FPGAs, and Adaptive SoCs enable the optimization of performance and power for a diverse set of workloads.
3
Data Center Products
Server CPUs. Our CPUs for server platforms currently include the AMD EPYC™ Series processors – AMD EPYC 9004 Series, AMD EPYC 7003 Series and AMD EPYC 7002 Series. Our 4th Gen AMD EPYC 9004 Series processors are built on the “Zen 4” core and are designed to deliver leadership performance and energy efficiency across multiple market segments and workloads. Our 3rd Gen AMD EPYC processors include AMD 3D V-Cache™ technology for leadership performance in technical computing workloads.
FPGAs and Adaptive SoCs. We offer a wide range of FPGAs, Adaptive SoCs and acceleration cards for the data center. Devices include the Virtex™ and Kintex™ FPGA products, as well as Zynq™, Zynq MPSoC, and Versal™ Adaptive SoC products. Our Alveo™ accelerator cards provide a platform for accelerating workloads in the data center, at the edge or the cloud. To make it accessible for developers, Alveo is available on most major OEM server platforms, as well as a growing presence across all major cloud providers who provide FPGA-as-a-Service (FaaS).
DPUs. Our P4 programmable AMD Pensando DPUs are designed to help offload data center infrastructure services from the CPU, and coupled with our comprehensive software stack, help enable cloud and enterprise customers to optimize performance for network, storage, and security services at cloud scale. Designed for minimal latency, jitter and power impact, our DPUs can help large Infrastructure as a service (IaaS) cloud providers improve hosted virtualized and bare-metal workload performance. Our DPUs power the Aruba CX 10000 top-of-rack network switch, designed to enable enterprise customers to adopt the cloud model of distributed services.
Data Center GPUs. Our AMD Instinct™ family of GPU accelerator products, including AMD Instinct MI200 Series which is based on 2nd Gen AMD CDNA architecture, and are specifically designed to address the growing demand for compute-accelerated data center workloads, including AI training and a range of supercomputing applications where the compute capabilities of GPUs provide additional performance. Combined with our AMD ROCm™ open software platform, our customers can deliver differentiated accelerated platforms to address the next-generation of computing challenges while minimizing power and space needs in the data center. Our visual cloud GPU offerings include products in the Radeon™ PRO V families. Our visual cloud data center GPUs include a range of solutions tailored towards workloads requiring remote visualization, such as Desktop-as-a-Service, Workstation-as-a-Service and Cloud Gaming. AMD Accelerated Parallel Processing or General Purpose GPU (GPGPU) refers to a set of advanced hardware and software technologies that enable our discrete GPUs, working in concert with the CPU, to accelerate computational tasks beyond traditional CPU processing by utilizing the vast number of GPU cores while working with the CPU to process information cooperatively. In addition, computing devices with heterogeneous computing features can run computationally-intensive tasks more efficiently, which we believe provides a superior application experience to the end user. Moreover, heterogeneous computing allows for the elevation of the GPU to the same level as the CPU for memory access, queuing, and execution.
Client Segment
Client Market
Our CPUs are incorporated into computing platforms, which are a collection of technologies that are designed to work together to provide a more complete computing solution. We believe that integrated, balanced computing platforms consisting of CPUs, chipsets and GPUs (either as discrete GPUs or integrated into an APU or SoC) that work together at the system level bring end users improved system stability, increased performance and enhanced power efficiency. In addition, we believe customers also benefit from an all-AMD platform (consisting of an APU or CPU, a discrete GPU, and a chipset when needed), as we are able to optimize interoperability, provide our customers a single point of contact for the key platform components and enable them to bring the platforms to market quickly in a variety of PC and server system form factors. We currently base our CPUs and chipsets on the x86 instruction set architecture and the AMD Infinity Fabric™, which connects an on-chip memory controller and input/output (I/O) channels directly to one or more CPU cores.
Client Products
Desktop CPUs. Our CPUs for desktop platforms currently include the AMD Ryzen™ and AMD Athlon™ series processors. Our Ryzen 7000 Series desktop processors are based on “Zen 4” architecture and deliver leadership performance for gamers and content creators. Our AMD Ryzen 5000 Series desktop processor family powered by our “Zen 3” core architecture has up to 16 cores and is the first AMD Ryzen processor to feature AMD 3D V-Cache technology to improve gaming performance.
4
Notebook CPUs. Our mobile APUs, including AMD Ryzen and AMD Athlon mobile processors for the commercial and consumer markets, combine both high levels of performance and efficiency for notebook PCs. Our AMD Ryzen 7000 Series processors for mobile applications have up to 16 “Zen 4” architecture cores. We also offer AMD Ryzen 6000 Series mobile processors, built on “Zen 3+” architecture and AMD Ryzen 5000 Series mobile processors, which are powered with our “Zen 3” core architecture.
Commercial CPUs. We offer enterprise-class desktop and mobile PC solutions sold as AMD PRO Mobile and AMD PRO desktop processors with Radeon™ graphics for the commercial market. AMD Ryzen PRO, AMD Threadripper™ PRO and AMD Athlon PRO processors solutions are designed to provide enterprise customers with the performance, security capabilities and business features such as enhanced security and manageability, platform longevity and extended image stability. Our AMD Ryzen Threadripper PRO 5000 WX-Series processors provide full-spectrum performance across multiple workstation workloads due to the performance and efficiency of the “Zen 3” core architecture and increased processor frequencies. We also offer the AMD Ryzen PRO 7030 Series Mobile processors built on “Zen 3” core architecture.
Chipsets. We offer a full suite of chipset products to support our AMD Ryzen and Threadripper platforms, including chipsets for the AM5 socket like the X670 chipsets which support PCIe® 5.0 (fifth generation Peripheral Component Interconnect Express motherboard interface) designed for enthusiast desktop platforms. In the AM5 platform we also offer B650 chipsets to enable a broader range of solutions in the market. In the AM4 ecosystem for 5000-series processors and prior, we offer the X570, B550 and A520 chipsets for socket AM4 for 3rd Gen AMD Ryzen desktop processors and 5000 processors. In addition, we continue to offer the B450 and A320 chipsets that are combined with AMD Ryzen processors for the AM4 desktop platform for the performance and affordable mainstream platforms segments. In the High-End Desktop (HEDT) and Workstation segments, we offer the WRX80 chipsets to support the 3rd Gen Ryzen Threadripper PRO platforms offering high speed I/O and platform bandwidth.
Gaming Segment
Gaming Market
Graphics processing is a fundamental component across many of our products and can be found in an APU, GPU, SoC or a combination of a discrete GPU with one of the other foregoing products working in tandem. Our customers generally use our graphics solutions to enable or increase the speed of rendering images, to help improve image resolution and color definition. We develop our graphics products for use in various computing devices and entertainment platforms, including desktop PCs, notebook PCs, All-in-Ones (AIOs), professional workstations, and the data center. With each of our graphics products, we have available drivers and supporting software packages that enable the effective use of these products under a variety of operating systems and applications. We have developed AMD RDNA™ 3, a high performing and power efficient graphics architecture, which is the foundation for next-generation PC gaming graphics. Additionally, our RDNA 2 architecture supports advanced graphics features such as ray tracing, AMD Infinity Cache™ and variable rate shading. The Sony PlayStation® 5 and Microsoft® Xbox Series S™ and X™ game consoles also feature our RDNA graphics architecture. Our APUs deliver visual processing functionality for value and mainstream PCs by integrating a CPU and a GPU on a single chip, while discrete GPUs (which are also known as dGPUs) offer high-performance graphics processing across all platforms. We leverage our core IP, including our graphics and processing technologies to develop semi-custom solutions. Here, semiconductor suppliers work alongside system designers and manufacturers to enhance the performance and overall user experience for semi-custom customers. We have used this collaborative co-development approach with many of today’s leading game console and handheld PC gaming manufacturers and can also address customer needs in many other markets. We leverage our existing IP to create a variety of products tailored to a specific customer’s needs, including complex fully-customized SoCs to more modest adaptations and integrations of existing CPU, APU or GPU products.
Gaming Products
Semi-Custom Products. Our semi-custom products are tailored, co-developed, high-performance, customer-specific solutions based on our CPU, GPU and multi-media technologies. We work closely with our customers to define solutions to precisely match the requirements of the device or application. We developed the semi-custom SoC products that power both the Sony PlayStation 5 as well as the Microsoft Xbox Series S and X game consoles. We partnered with Valve to create a semi-custom APU optimized for handheld gaming to power the Steam Deck™.
5
Discrete Desktop and Notebook GPUs. Our AMD Radeon series discrete GPU processors for desktop and notebook PCs support current generation application program interfaces (APIs) like DirectX® 12 Ultimate and Vulkan®, support high-refresh rate displays using AMD FreeSync™, AMD FreeSync Premium, and AMD FreeSync Premium Pro technologies, and are designed to support VR in PC platforms. Our AMD Radeon Software expands remote gaming functionality and enables new features and customization capabilities. In addition, we also offer tools for game developers such as our AMD FidelityFX™ open-source image quality software toolkit that helps deliver improved visual quality with minimal performance overhead. FidelityFX Super Resolution (FSR) uses upscaling technologies to help boost frame rates in games. Our FSR 2.0 technology uses temporal data and optimized anti-aliasing to boost frame rates in supported games while delivering similar or better image quality than native resolution without requirement dedicated machine learning hardware.
Our AMD Radeon RX 7900 XTX and Radeon RX 7900 XT graphics cards are built on high-performance, energy-efficient AMD RDNA 3 architecture. AMD Radeon RX 7900 series chiplet design combines 5 nm and 6 nm process nodes, each optimized for specific chips in the GPU. We continue to offer AMD Radeon RX 6000 series discrete graphics, based on our RDNA2 architecture, for high-performance gaming desktops and notebooks. Our AMD Advantage Design™ Framework is a collaboration with our global PC partners, delivering high-performance gaming notebooks by combining our AMD Radeon RX series mobile graphics, AMD Software: Adrenalin Edition, AMD Ryzen series mobile processors and utilizing AMD smart technologies to provide best-in-class gaming experiences. AMD RDNA 3 gaming architecture is included in our newer AMD Radeon RX graphics cards giving process optimizations plus firmware and software enhancements and high-bandwidth, low-latency AMD Infinity Cache technology and GDDR6 memory at up to 20Gbps.
Professional GPUs. Our AMD Radeon PRO family of professional graphics products includes multi-view graphics cards and GPUs designed for integration in mobile and desktop workstations. AMD Radeon PRO graphics cards are designed for demanding use cases such as design and manufacturing for CAD, and media and entertainment for broadcast and animation pipelines. AMD Radeon PRO supports end users utilizing GPU accelerated visualization for construction, architecture and mechanical design through gaming and visualization engines on high resolution displays. Our AMD Radeon PRO W6000 series workstation graphics include AMD RDNA 2 architecture and AMD Infinity Cache and are designed to reduce latency and power consumption and to optimize design workloads, including 3D rendering, 8K video composition and color correction, complex design and engineering simulations along with image and video editing applications.
Embedded Segment
The Embedded Market
The Embedded segment primarily includes embedded CPUs, GPUs, APUs, FPGAs, and Adaptive SoC products. Embedded products address computing needs in automotive, industrial, test, measurement, emulation, medical, multimedia, aerospace, defense, communications, networking, security, and storage markets as well as thin clients, which are computers that serve as an access device on a network. Typically, our embedded products are used in applications that require varying levels of performance, where key features may include relatively low power, small form factors, and 24x7 operations. High-performance graphics are important in some embedded systems. Support for Linux®, Windows® and other operating systems as well as for increasingly sophisticated applications are also critical for some customers. Other requirements may include meeting rigid specifications for industrial temperatures, shock, vibration and reliability. The embedded market has moved from developing proprietary, custom designs to leveraging industry-standard instruction set architectures and processors as a way to help reduce costs and speed time to market.
Embedded Products
Embedded CPUs, APUs and GPUs. Our products for embedded platforms include AMD Embedded EPYC CPUs, AMD Embedded Ryzen V-Series APUs, CPUs and SoCs, AMD Embedded Ryzen R-Series APUs, CPUs and SoCs. Our embedded processors and GPUs are designed to support high performance and bandwidth network connectivity and security, high-performance storage requirements for enterprise and cloud infrastructure, 3D graphics performance and 4K multimedia requirements of automotive infotainment systems.
6
FPGAs and Adaptive SoCs. Our FPGA products are hardware-customizable devices that can be tailored to meet the specific needs of each customer, enabling them to differentiate their products and accelerate time-to-market. Our FPGA families include UltraScale+™ (based on 16 nm technology), UltraScale™ (20 nm), 7 Series (28 nm) and older series. Adaptive SoC products include the Zynq SoC and UltraScale+ Multi-Processing System on a Chip (MPSoCs) which combine FPGA technology with a heterogeneous processing system, as well as the industry’s first RFSoC architecture with integrated radio frequency (RF) data converters. The Versal portfolio is composed of software-programmable Adaptive SoCs, with a heterogeneous compute platform that combines Scalar Engines, Adaptable Engines, and Intelligent Engines to achieve dramatic performance improvements over today's fastest FPGA and accelerate applications in a wide variety of markets, including data center, wired network, 5G wireless, automotive, industrial, scientific, medical, aerospace and defense.
Development Boards, Kits and Configuration Products. We offer development kits for all our FPGA and Adaptive SoC products that include hardware, development tools, IP and reference designs that are designed to streamline and accelerate the development of domain-specific and market-specific applications.
Legacy Product Families. Prior generation high-end Virtex FPGA families include Virtex-6, Virtex-5, Virtex-4, Virtex-II Pro, Virtex-II and the original Virtex family. Prior generation low end Spartan™ FPGA families include Spartan-6, Spartan-3, the Spartan-3E and Spartan-3A, Spartan-IIE, Spartan-II, Spartan XL and the original Spartan family. Complex Programmable Logic Devices (CPLDs) operate on the lowest end of the programmable logic density spectrum. CPLDs are single-chip, nonvolatile solutions characterized by instant-on and universal interconnect. Prior generations of CPLDs include the CoolRunner™ and XC9500 product families.
Design Platforms and Services
Adaptable Platforms. We offer two types of platforms that support our customers' designs and reduce their development efforts: FPGAs and Adaptive SoCs. All devices feature adaptable hardware that enables our customers to implement customized, domain-specific architectures. With both hardware-accelerated performance and flexibility beyond what CPUs, GPUs, application-specific standard parts (ASSPs), and application-specific integrated circuits (ASICs) can offer, customers can introduce new innovations to the market quickly. FPGAs feature reconfigurable hardware as well as integrated memory, digital signal processing, analog mixed signal, high-speed serial transceivers, and networking cores coupled with advanced software for a broad range of applications in all of our end markets. Our Adaptive SoCs feature a heterogeneous processing subsystem with integrated programmable hardware fabric targeting embedded systems needing real-time control, analytics, sensor fusion, and adaptable hardware for differentiation and acceleration. Our Zynq UltraScale+ RFSoCs feature integrated high-performance RF data converters targeting wireless, radar, and cable access applications. Enabled by both hardware and software design tools and an extensive operating system, middleware, software stack, and IP ecosystem, SoC platforms target software developers as well as traditional hardware designers. Versal is the most recent addition to the silicon portfolio. Versal combines Scalar Processing Engines, Adaptable Hardware Engines, and Intelligent Engines with leading-edge memory and interfacing technologies to deliver powerful heterogeneous acceleration for any application. This product family is ideally suited to accelerate a broad set of applications in the emerging era of big data and AI. Versal hardware and software can be programmed and optimized by software developers, data scientists, and hardware developers alike, enabled by a host of tools, software, libraries, IP, middleware, and frameworks that enable industry-standard design flows.
Software Development Platform. To accommodate hardware and software designers, as well as software developers and AI scientists, we provide design tools and software stacks tailored to each user profile. Our Vivado™ ML Edition provides hardware design teams with the tools and methodology needed to program FPGAs and Adaptive SoCs. Our Vitis™ unified software platform enables the development and deployment of embedded software and accelerated applications, on our FPGAs and Adaptive SoCs. Out Vitis AI unified software platform enables the development and deployment of AI software on our FPGAs and Adaptive SoCs.
Sales and Marketing
We sell our products through our direct sales force and through independent distributors and sales representatives in both domestic and international markets. Our sales arrangements generally operate on the basis of product forecasts provided by the particular customer, but do not typically include any commitment or requirement for minimum product purchases. We primarily use product quotes, purchase orders, sales order acknowledgments and contractual agreements as evidence of our sales arrangements. Our agreements typically contain standard terms and conditions covering matters such as payment terms, warranties and indemnities for issues specific to our products.
7
We generally warrant that our products sold to our customers will conform to our approved specifications and be free from defects in material and workmanship under normal use and conditions for one year. We offer up to three-year limited warranties for certain product types, and sometimes provide other warranty periods based on negotiated terms with certain customers.
We market and sell our latest products under the AMD trademark. Our client processors include: AMD Ryzen, AMD Ryzen PRO, Ryzen Threadripper, Ryzen Threadripper PRO, AMD Athlon, AMD Athlon PRO, and AMD PRO A-Series. These products service desktop and notebook personal computers.
Our product brand for the consumer graphics market is AMD Radeon graphics, and AMD Embedded Radeon graphics is our product brand for the embedded graphics market.
Our product brand for professional graphics products are AMD Radeon PRO graphics.
Our product brands for data center graphics are Radeon Instinct, Radeon PRO V-series, and AMD Instinct accelerators for servers. We also market and sell our chipsets under AMD trademarks.
Our product brand for server microprocessors is AMD EPYC processors.
We also sell low-power versions of our AMD Athlon, as well as AMD Geode™, AMD Ryzen, AMD EPYC, AMD R-Series and G-Series processors as embedded processor solutions.
Our FPGA product brands are Virtex-6, Virtex-7, Virtex UltraScale+, Kintex-7, Kintex UltraScale, Kintex UltraScale+, Artix-7, Artix UltraScale+, Spartan-6 and Spartan-7.
Our product brands for Adaptive SoCs are Zynq-7000, Zynq UltraScale+ MPSoC, Zynq UltraScale+ RFSoCs, Versal HBM, Versal Premium, Versal Prime, Versal AI Core, Versal AI Edge, Vitis and Vivado.
Our compute and network acceleration board products are sold under the Alveo brand.
We market our products through direct marketing and co-marketing programs. In addition, we have cooperative advertising and marketing programs with customers and third parties, including market development programs, pursuant to which we may provide product information, training, marketing materials and funds. Under our co-marketing development programs, eligible customers can use market development funds as reimbursement for advertisements and marketing programs related to our products and third-party systems integrating our products, subject to meeting defined criteria.
Customers
Our microprocessor customers consist primarily of original equipment manufacturers (OEMs), large public cloud service providers, original design manufacturers (ODMs), system integrators and independent distributors in both domestic and international markets. ODMs provide design and/or manufacturing services to branded and unbranded private label resellers, OEMs and system builders. Customers of our microprocessor products also include online and brick and mortar retailers. Our graphics product customers include the foregoing as well as add-in-board manufacturers (AIBs).
Customers of our chipset products consist primarily of PC OEMs, often through ODMs or other contract manufacturers, who build the OEM motherboards, as well as desktop and server motherboard manufacturers who incorporate chipsets into their channel motherboards. Our FPGA and Adaptive SOC products are sold to customers in a very wide range of markets such as Aerospace and Defense, Test and Measurement, Industrial, Automotive, Consumers, Broadcast, Communication Infrastructure and Data Center. For these products we either sell directly to our customers or through a network of distributors and OEM partners. We are also developing a network of Value Added Resellers (VARs) and Integrated Solution Vendors (ISVs) for our Alveo products.
We work closely with our customers to define product features, performance and timing of new products so that the products we are developing meet our customers’ needs. We also employ application engineers to assist our customers in designing, testing and qualifying system designs that incorporate our products. We believe that our commitment to customer service and design support improves our customers’ time-to-market and fosters relationships that encourage customers to use the next generation of our products.
8
We also work with our customers to create differentiated products that leverage our CPU, GPU and APU technology. Certain customers pay us non-recurring engineering fees for design and development services and a purchase price for the resulting products.
One customer accounted for 16 % of our consolidated net revenue for the year ended December 31, 2022. Sales to this customer consisted of sales of products from our Gaming segment. A loss of this customer would have a material adverse effect on our business.
Original Equipment Manufacturers
We focus on three types of OEM partners: multi-nationals, selected regional accounts and selected global and local system integrators, who target commercial and consumer end customers of all sizes. Large multi-nationals and regional accounts are the core of our OEM partners’ business; however, we are increasingly focused on the VAR channel which resells OEM systems to the mid-market and the small and medium business (SMB) segments. Additionally, we have increased our focus on global system integrators, which resell OEM systems, coupled with their software and services solutions into Enterprise, high performance computing (HPC) and Cloud Service Provider Customers. Our OEM customers include numerous foreign and domestic manufacturers of servers and workstations, desktops, notebooks, PC motherboards and game consoles.
Third-Party Distributors
Our authorized channel distributors resell to sub-distributors and OEMs, ODMs, and other customers. Typically, distributors handle a wide variety of products, and may include products from other manufacturers that compete with our products. Distributors typically maintain an inventory of our products. In most instances, our agreements with distributors protect their inventory of our products against price reductions and provide certain return rights with respect to any product that we have removed from our price book or otherwise subject to discontinuation. In addition, some agreements with our distributors may contain standard stock rotation provisions permitting limited product returns.
Add-in-Board (AIB) Manufacturers and System Integrators
We offer component-level graphics and chipset products to AIB manufacturers who in turn build and sell board-level products using our technology to system integrators (SIs), retail buyers and sub distributors. Our agreements with AIBs protect their inventory of our products against price reductions. We also sell directly to our SI customers. SIs typically sell from positions of regional or product-based strength in the market. They usually operate on short design cycles and can respond quickly with new technologies. SIs often use discrete graphics solutions as a means to differentiate their products and add value to their customers.
Competition in Data Center Segment
In Data Center, we compete against Intel Corporation (Intel) with our FPGA, Adaptive SoC, CPU and DPU server products and NVIDIA Corporation (NVIDIA) with our CPU, GPU and DPU server products. A variety of companies provide or have developed ARM-based microprocessors and platforms. ARM-based designs are being used in the server market, which could lead to further growth and development of the ARM ecosystem.
Competition in Client Segment
The markets in which we participate are highly competitive. Our primary competitor in the supply of CPUs is Intel. A variety of companies provide or have developed ARM-based microprocessors and platforms. ARM-based designs are being used in the PC market, which could lead to further growth and development of the ARM ecosystem.
9
Competition in Gaming Segment
In the graphics market, our principal competitor in the supply of discrete graphics is NVIDIA who is the market share leader. Intel also manufactures and sells embedded graphics processors and integrated graphics processor (IGP) chipsets. Also, Intel has developed their own gaming-focused discrete GPUs and has entered the market. Other competitors include suppliers of discrete graphics and integrated graphics processor (IGP) chipsets. Some of our competitors are smaller companies, which may have greater flexibility to address specific market needs, but less financial resources to address the growing complexity of graphics processors and the associated research and development costs. With respect to integrated graphics, higher unit shipments of our APUs and Intel’s integrated graphics may drive computer manufacturers to reduce the number of systems they build paired with discrete graphics components, particularly for notebooks, because they may offer satisfactory graphics performance for most mainstream PC users at a lower cost. We are the market share leader in semi-custom game console products, where graphics performance is critical.
Competition in Embedded Segment
We expect continued competition from our primary FPGA competitors such as Intel, Lattice Semiconductor Corporation and Microsemi Corporation (Microsemi, acquired by Microchip), from ASSP vendors such as Broadcom Corporation, Marvell Technology Group, Ltd., Analog Devices, Texas Instruments Incorporated and NXP Semiconductors N.V., and from NVIDIA. In addition, we expect continued competition from the ASIC market, which has been ongoing since the inception of FPGAs. Other competitors include manufacturers of:
•high-density programmable logic products characterized by FPGA-type architectures;
•high-volume and low-cost FPGAs as programmable replacements for ASICs and ASSPs;
•ASICs and ASSPs with incremental amounts of embedded programmable logic;
•high-speed, low-density complex programmable logic devices (CPLDs);
•high-performance digital signal processing (DSP) devices;
•products with embedded processors;
•products with embedded multi-gigabit transceivers;
•discrete general-purpose GPUs targeting data center and automotive applications; and
•other new or emerging programmable logic products.
Research and Development
We focus our research and development (R&D) activities on designing and developing products. Our main area of focus is on delivering the next generation of processors (CPU and GPU), FPGAs and Adaptive SoCs, accelerators (adaptive, graphics and DPU), System on Modules (SOMs) and SmartNICs and associated software. We focus on designing new ICs with improved performance and performance-per-watt in advanced semiconductor manufacturing processes, the design of logic and interface IP, advanced packaging technologies, and heterogeneous integration technologies. We also focus on software as part of the development of our products, including design automation tools for hardware, embedded software, optimized software tools and libraries that extend the reach of our platforms to software and AI developers. Through our R&D efforts, we were able to introduce a number of new products and enhance our IP core offerings and software.
We also work with industry leaders on process technology, design tools, intellectual property, software and other industry consortia to conduct early-stage research and development. We are also actively contributing to numerous industry open-source software initiatives across a broad range of technologies. We conduct product and system research and development activities for our products in the United States with additional design and development engineering teams located in various countries who undertake specific activities at the direction of our U.S. headquarters.
Manufacturing Arrangements and Assembly and Test Facilities
Third-Party Wafer Foundry Facilities
We have foundry arrangements with Taiwan Semiconductor Manufacturing Company Limited (TSMC) for the production of wafers for our HPC, FPGA and Adaptive SoC products.
We are also a party to a Wafer Supply Agreement (WSA) with GLOBALFOUNDRIES Inc. (GF), with respect to wafer purchases for our HPC products at the 12 nm and 14 nm technology nodes.
10
Additionally, we purchase wafers from United Microelectronics Corporation (UMC) and Samsung Electronics Co., Ltd.
Other Third-Party Manufacturers
We outsource board-level graphics product manufacturing to third-party manufacturers.
Assembly, Test, Mark and Packaging Facilities
Wafers for our products are either sorted by the foundry or delivered by the foundry to our assembly, test, mark and packaging (ATMP) partners or subcontractors located in the Asia-Pacific region who package and test our final semiconductor products. We are party to two ATMP joint ventures (collectively, the ATMP JVs) with Tongfu Microelectronics Co., Ltd. The ATMP JVs, Siliconware Precision Industries Ltd. (SPIL) and King Yuan Electronics Company (KYEC) provide ATMP services for our products.
Intellectual Property and Licensing
We rely on contracts and intellectual property rights to protect our products and technologies from unauthorized third-party copying and use. Intellectual property rights include copyrights, patents, patent applications, trademarks, trade secrets and mask work rights. As of December 31, 2022, we had approximately 8,200 patents in the United States and approximately 2,200 patent applications pending in the United States. In certain cases, we have filed corresponding applications in foreign jurisdictions. Including United States and foreign matters, we have approximately 19,800 patent matters worldwide consisting of approximately 13,200 issued patents and 6,600 patent applications pending. We expect to file future patent applications in both the United States and abroad on significant inventions, as we deem appropriate. We do not believe that any individual patent, or the expiration of any patent, is or would be material to our business. As is typical in the semiconductor industry, we have numerous cross-licensing and technology exchange agreements with other companies under which we both transfer and receive technology and intellectual property rights. We have acquired various licenses from external parties to certain technologies that are implemented in our products, including our IP cores and devices. These licenses support our continuing ability to make and sell our products. We have also acquired licenses to certain proprietary software, open-source software, and related technologies, such as compilers, for our design tools. Continued use of such software and technology is important to the operation of the design tools upon which our customers depend.
Backlog
Sales are made primarily pursuant to purchase orders for current delivery or agreements covering purchases over a period of time. Although such orders or agreements may provide visibility into future quarters, they may not necessarily be indicative of actual sales for any succeeding period as some of these orders or agreements may be revised or canceled without penalty. With respect to our semi-custom SoC products our orders and agreements are more stringent resulting in meaningful backlog for the coming quarter.
Seasonality
Our operating results tend to vary seasonally. Historically, our net revenue has been generally higher in the second half of the year than in the first half of the year, although market conditions and product transitions could impact these trends.
Human Capital
As of December 31, 2022, we had approximately 25,000 employees in our global workforce. We believe we are at our best when our culture of innovation, creative minds and people from all kinds of backgrounds work together in an engaging and open environment. Areas of focus for us include the following:
Mission, Culture, and Engagement
Our History - Founded in 1969 as a Silicon Valley start-up, the AMD journey began with dozens of employees focused on leading-edge semiconductor products. From those modest beginnings, we have grown into a global company achieving many important industry firsts along the way. Today, we develop high-performance and adaptive computing to solve some of the world’s toughest and most interesting challenges.
Our Vision - High performance and adaptive computing is transforming our lives.
11
Our Mission - Build great products that accelerate next-generation computing experiences. Our employees are driven by this vision and mission. Innovation occurs when creative minds and diverse perspectives from all over the world work together. This is the foundation of our unique culture and the reason why our employees are among the most engaged in our industry.
We conduct a confidential annual survey of our global workforce to measure our culture, engagement, and manager quality. The results are reviewed by our Board of Directors and acted upon by our senior leadership team and individual managers at every level. Results from our 2022 survey reported scores that continued to be among the very best for global companies in the technology industry. Our employees described our culture as inclusive, innovative, open, and respectful, and rated the quality of our managers among the top 10% of our technology industry peers.
Diversity, Belonging and Inclusion
Our diverse and inclusive workforce encourages employees to share their opinions and different perspectives. We believe that building a diverse talent pipeline, encouraging a culture of respect and belonging, and increasing inclusion of unique and underrepresented voices makes our Company stronger. Our Employee Resource Groups encourage employee engagement and play an important role in our culture. In 2022, we were recognized for the sixth consecutive year by the Human Rights Campaign Foundation as a Best Place to Work for LGBTQ+ equality and were included in Bloomberg’s Gender Equality Index for the fourth consecutive year.
We are focused on hiring and developing underrepresented groups and women leaders. We are proud to be led by a highly regarded CEO who has won many esteemed awards for her business and leadership prowess. In 2022, Dr. Lisa Su was listed among “Fortune’s Most Powerful Women”. In the last two years, she also received the “Woman Innovation Award” from the Global Semiconductor Alliance and was listed among Barron’s World’s Best CEOs and Forbes’ World’s Most Powerful Women. In addition, Dr. Su continues to support President Biden’s Council of Advisors on Science and Technology.
Total Rewards
We invest in our workforce by offering competitive salaries, incentives, and benefits to ensure that we continue to attract and retain the industry’s best and brightest. Our rewards are guided by employees’ preferences and the market for talent. We have a strong pay for performance culture that we believe drives superior results. Our employees have benefited from our robust financial results with very strong short-term and long-term incentives. Our rewards programs enabled us to attract, retain and motivate our workforce, including approximately 10,000 new AMDers who were added to the company through acquisitions and direct hiring during fiscal year 2022.
Development
We offer our employees opportunities to advance their careers at the Company and the majority of our new leaders are promoted from within. We are focused on leadership progression and encourage our employees to take advantage of new opportunities. Our manager and leadership development programs are highly rated, and we provide specialized development programs for our employees.
Environmental Regulations
Our operations and properties have in the past been and continue to be subject to various United States and foreign laws and regulations, including those relating to materials used in our products and manufacturing processes, discharge of pollutants into the environment, the treatment, transport, storage and disposal of solid and hazardous wastes and remediation of contamination. These laws and regulations require our suppliers to obtain permits for operations making our products, including the discharge of air pollutants and wastewater. Environmental laws are complex, change frequently and have tended to become more stringent over time. For example, the European Union (EU) and China are two among a growing number of jurisdictions that have enacted restrictions on the use of lead and other materials in electronic products. These regulations affect semiconductor devices and packaging. A number of jurisdictions including the EU, Australia, California and China are developing or have finalized market entry or public procurement regulations for computers and servers based on ENERGY STAR specifications as well as additional energy consumption limits.
12
Certain environmental laws, including the United States Comprehensive, Environmental Response, Compensation and Liability Act of 1980, or the Superfund Act, impose strict or, under certain circumstances, joint and several liability on current and previous owners or operators of real property for the cost of removal or remediation of hazardous substances and impose liability for damages to natural resources. These laws often impose liability even if the owner or operator did not know of, or was not responsible for, the release of such hazardous substances. These environmental laws also assess liability on persons who arrange for hazardous substances to be sent to disposal or treatment facilities when such facilities are found to be contaminated. Such persons can be responsible for cleanup costs even if they never owned or operated the contaminated facility. We have been named as a responsible party on Superfund clean-up orders for three sites in Sunnyvale, California that are on the National Priorities List. Since 1981, we have discovered hazardous material releases to the groundwater from former underground tanks and proceeded to investigate and conduct remediation at these three sites. The chemicals released into the groundwater were commonly used in the semiconductor industry in the United States in the wafer fabrication process prior to 1979.
In 1991, we received Final Site Clean-up Requirements Orders from the California Regional Water Quality Control Board relating to the three sites. We have entered into settlement agreements with other responsible parties on two of the orders. During the term of such agreements, other parties have agreed to assume most of the foreseeable costs as well as the primary role in conducting remediation activities under the orders. We remain responsible for additional costs beyond the scope of the agreements as well as all remaining costs in the event that the other parties do not fulfill their obligations under the settlement agreements.
To address anticipated future remediation costs under the orders, we have computed and recorded an estimated environmental liability of approximately $3.9 million and have not recorded any potential insurance recoveries in determining the estimated costs of the cleanup. The progress of future remediation efforts cannot be predicted with certainty and these costs may change. We believe that any amount in addition to what has already been accrued would not be material.
13
ITEM 1A. RISK FACTORS
The risks and uncertainties described below are not the only ones we face. If any of the following risks actually occurs, our business, financial condition or results of operations could be materially adversely affected. In addition, you should consider the interrelationship and compounding effects of two or more risks occurring simultaneously.
Risk Factors Summary
The following is a summary of the principal risks that could adversely affect our business, operations and financial results.
Economic and Strategic Risks
•Intel Corporation’s dominance of the microprocessor market and its aggressive business practices may limit our ability to compete effectively on a level playing field.
•Global economic and market uncertainty may adversely impact our business and operating results.
•The semiconductor industry is highly cyclical and has experienced severe downturns that have materially adversely affected, and may continue to materially adversely affect, our business in the future.
•The demand for our products depends in part on the market conditions in the industries into which they are sold. Fluctuations in demand for our products or a market decline in any of these industries could have a material adverse effect on our results of operations.
•The loss of a significant customer may have a material adverse effect on us.
•The ongoing novel coronavirus (COVID-19) pandemic could materially adversely affect our business, financial condition and results of operations.
•The markets in which our products are sold are highly competitive.
•Our operating results are subject to quarterly and seasonal sales patterns.
•If we cannot adequately protect our technology or other intellectual property in the United States and abroad, through patents, copyrights, trade secrets, trademarks and other measures, we may lose a competitive advantage and incur significant expenses.
•Unfavorable currency exchange rate fluctuations could adversely affect us.
Operational and Technology Risks
•We rely on third parties to manufacture our products, and if they are unable to do so on a timely basis in sufficient quantities and using competitive technologies, our business could be materially adversely affected.
•If essential equipment, materials, substrates or manufacturing processes are not available to manufacture our products, we could be materially adversely affected.
•Failure to achieve expected manufacturing yields for our products could negatively impact our financial results.
•The success of our business is dependent upon our ability to introduce products on a timely basis with features and performance levels that provide value to our customers while supporting and coinciding with significant industry transitions.
•Our revenue from our semi-custom System-on-Chip (SoC) products is dependent upon our semi-custom SoC products being incorporated into customers’ products and the success of those products.
•Our products may be subject to security vulnerabilities that could have a material adverse effect on us.
•IT outages, data loss, data breaches and cyber-attacks could compromise our intellectual property or other sensitive information, be costly to remediate or cause significant damage to our business, reputation and operations.
•We may encounter difficulties in upgrading and operating our new enterprise resource planning (ERP) system, which could materially adversely affect us.
•Uncertainties involving the ordering and shipment of our products could materially adversely affect us.
•Our ability to design and introduce new products in a timely manner includes the use of third-party intellectual property.
•We depend on third-party companies for the design, manufacture and supply of motherboards, software, memory and other computer platform components to support our business and products.
•If we lose Microsoft Corporation’s support for our products or other software vendors do not design and develop software to run on our products, our ability to sell our products could be materially adversely affected.
14
•Our reliance on third-party distributors and add-in-board (AIB) partners subjects us to certain risks.
•Our business is dependent upon the proper functioning of our internal business processes and information systems and modification or interruption of such systems may disrupt our business, processes and internal controls.
•If our products are not compatible with some or all industry-standard software and hardware, we could be materially adversely affected.
•Costs related to defective products could have a material adverse effect on us.
•If we fail to maintain the efficiency of our supply chain as we respond to changes in customer demand for our products, our business could be materially adversely affected.
•We outsource to third parties certain supply-chain logistics functions, including portions of our product distribution, transportation management and information technology support services.
•Our inability to effectively control the sales of our products on the gray market could have a material adverse effect on us.
Legal and Regulatory Risks
•Government actions and regulations such as export regulations, tariffs, and trade protection measures may limit our ability to export our products to certain customers.
•If we cannot realize our deferred tax assets, our results of operations could be adversely affected.
•Our business is subject to potential tax liabilities, including as a result of tax regulation changes.
•We are party to litigation and may become a party to other claims or litigation that could cause us to incur substantial costs or pay substantial damages or prohibit us from selling our products.
•We are subject to environmental laws, conflict minerals-related provisions of the Dodd-Frank Wall Street Reform and Consumer Protection Act as well as a variety of other laws or regulations that could result in additional costs and liabilities.
Merger, Acquisition and Integration Risks
•Acquisitions, joint ventures and/or investments and the failure to integrate acquired businesses could disrupt our business and/or dilute or adversely affect the price of our common stock.
•Any impairment of the combined company’s tangible, definite-lived intangible or indefinite-lived intangible assets, including goodwill, may adversely impact the combined company’s financial position and results of operations.
Liquidity and Capital Resources Risks
•The agreements governing our notes, our guarantees of Xilinx’s 2.95% and 2.375% Notes (Assumed Xilinx Notes), and our Revolving Credit Agreement impose restrictions on us that may adversely affect our ability to operate our business.
•Our indebtedness could adversely affect our financial position and prevent us from implementing our strategy or fulfilling our contractual obligations.
•We may not be able to generate sufficient cash to meet our working capital requirements. Also, if we cannot generate sufficient revenue and operating cash flow, we may face a cash shortfall and be unable to make all of our planned investments in research and development or other strategic investments.
General Risks
•Our worldwide operations are subject to political, legal and economic risks and natural disasters, which could have a material adverse effect on us.
•We may incur future impairments of technology license purchases.
•Our inability to continue to attract and retain qualified personnel may hinder our business.
•Our stock price is subject to volatility.
•Worldwide political conditions may adversely affect demand for our products.
For a more complete discussion of the material risks facing our business, see below.
15
Economic and Strategic Risks
Intel Corporation’s dominance of the microprocessor market and its aggressive business practices may limit our ability to compete effectively on a level playing field.
Intel Corporation (Intel) has been the market share leader for microprocessors for many years. Intel’s market share, margins and significant financial resources enable it to market its products aggressively, to target our customers and our channel partners with special incentives and to influence customers who do business with us. These aggressive activities have in the past resulted in lower unit sales and a lower average selling price for many of our products and adversely affected our margins and profitability.
Intel exerts substantial influence over computer manufacturers and their channels of distribution through various brand and other marketing programs. As a result of Intel’s position in the microprocessor market, Intel has been able to control x86 microprocessor and computer system standards and benchmarks and to dictate the type of products the microprocessor market requires of us. Intel also dominates the computer system platform, which includes core logic chipsets, graphics chips, networking devices (wired and wireless), non-volatile storage and other components necessary to assemble a computer system. Additionally, Intel is able to drive de facto standards and specifications for x86 microprocessors that could cause us and other companies to have delayed access to such standards.
As long as Intel remains in this dominant position, we may be materially adversely affected by Intel’s business practices, including rebating and allocation strategies and pricing actions, designed to limit our market share and margins; product mix and introduction schedules; product bundling, marketing and merchandising strategies; exclusivity payments to its current and potential customers, retailers and channel partners; de facto control over industry standards, and heavy influence on PC manufacturers and other PC industry participants, including motherboard, memory, chipset and basic input/output system (BIOS) suppliers and software companies as well as the graphics interface for Intel platforms; and marketing and advertising expenditures in support of positioning the Intel brand over the brand of its original equipment manufacturer (OEM) customers and retailers.
Intel has substantially greater financial resources than we do and accordingly spends substantially greater amounts on marketing and research and development than we do. We expect Intel to continue to invest heavily in marketing, research and development, new manufacturing facilities and other technology companies. To the extent Intel manufactures a significantly larger portion of its microprocessor products using more advanced process technologies, or introduces competitive new products into the market before we do, we may be more vulnerable to Intel’s aggressive marketing and pricing strategies for microprocessor products.
Intel could also take actions that place our discrete graphics processing units (GPUs) at a competitive disadvantage, including giving one or more of our competitors in the graphics market, such as NVIDIA Corporation, preferential access to its proprietary graphics interface or other useful information or restricting access to external companies. Also, Intel has developed and released their own high-end discrete GPUs, including gaming focused discrete GPUs. We also compete with Intel in field programmable gate arrays (FPGAs) and Adaptive SoC products. Intel’s position in the microprocessor, and integrated graphics chipset markets, its introduction of competitive new products, its existing relationships with top-tier OEMs, and its aggressive marketing and pricing strategies could result in lower unit sales and lower average selling prices for our products, which could have a material adverse effect on us.
Global economic and market uncertainty may adversely impact our business and operating results.
We experienced a decline in our Client segment revenue as a result of weak PC market macroeconomic conditions and inventory correction actions across the PC supply chain in the second half of 2022. Uncertain global economic conditions have and may in the future adversely impact our business. Uncertainty in the worldwide economic environment or other unfavorable changes in economic conditions, such as inflation, interest rates or recession, may negatively impact consumer confidence and spending causing our customers to postpone purchases. In addition, during challenging economic times, our current or potential future customers may experience cash flow problems and as a result may modify, delay or cancel plans to purchase our products. Additionally, if our customers are not successful in generating sufficient revenue or are unable to secure financing, they may not be able to pay, or may delay payment of, accounts receivable that they owe us. The risk related to our customers potentially defaulting on or delaying payments to us is increased because we expect that a small number of customers will continue to account for a substantial part of our revenue. Any inability of our current or potential future customers to pay us for
16
our products may adversely affect our earnings and cash flow. Moreover, our key suppliers may reduce their output or become insolvent, thereby adversely impacting our ability to manufacture our products. In addition, uncertain economic conditions may make it more difficult for us to raise funds through borrowings or private or public sales of debt or equity securities.
The semiconductor industry is highly cyclical and has experienced severe downturns that have materially adversely affected, and may continue to materially adversely affect, our business in the future.
The semiconductor industry is highly cyclical and has experienced significant downturns, often in conjunction with constant and rapid technological change, wide fluctuations in supply and demand, continuous new product introductions, price erosion and declines in general economic conditions. We have incurred substantial losses in previous downturns, due to substantial declines in average selling prices; the cyclical nature of supply and demand imbalances in the semiconductor industry; a decline in demand for end-user products (such as PCs) that incorporate our products; and excess inventory levels.
Industry-wide fluctuations in the computer marketplace have materially adversely affected us in the past and may materially adversely affect us in the future. Global economic uncertainty and weakness have in the past impacted the semiconductor market as consumers and businesses have deferred purchases, which negatively impacted demand for our products. Our financial performance has been, and may in the future be, negatively affected by these downturns. In the second half of 2022, we experienced a decline in our Client segment revenue as a result of weak PC market macroeconomic conditions and inventory correction actions across the PC supply chain.
The growth of our business is also dependent on continued demand for our products from high-growth adjacent emerging global markets. Our ability to be successful in such markets depends in part on our ability to establish adequate local infrastructure, as well as our ability to cultivate and maintain local relationships in these markets. If demand from these markets is below our expectations, sales of our products may decrease, which would have a material adverse effect on us.
The demand for our products depends in part on the market conditions in the industries into which they are sold. Fluctuations in demand for our products or a market decline in any of these industries could have a material adverse effect on our results of operations.
Industry-wide fluctuations in the computer marketplace have materially adversely affected us in the past and may materially adversely affect us in the future. Our Client segment revenue is focused on the consumer desktop and notebook PC segments, which in the second half of 2022 experienced a decline as a result of weak PC market macroeconomic conditions and inventory correction actions across the PC supply chain. In the past, revenues from the Client and Gaming segments have experienced a decline driven by, among other factors, the adoption of smaller and other form factors, increased competition and changes in replacement cycles. The success of our semi-custom SoC products is dependent on securing customers for our semi-custom design pipeline and consumer market conditions, including the success of the Sony PlayStation® 5, Microsoft® XboxTM Series S and Microsoft® XboxTM Series X game console systems and next generation consoles for Sony and Microsoft, worldwide. In addition, the GPU market has at times seen elevated demand due to the application of GPU products to cryptocurrency mining. For example, our GPU revenue has been affected in part by the volatility of the cryptocurrency mining market. Demand for cryptocurrency has changed and is likely to continue to change quickly. For example, China has banned such activities, and corresponding interest in mining of such currencies are subject to significant fluctuations. Alternatively, countries have created and may continue to create their own cryptocurrencies or equivalents that could also impact interest in mining. If we are unable to manage the risks related to the volatility of the cryptocurrency mining market, our GPU business could be materially adversely affected.
The loss of a significant customer may have a material adverse effect on us.
We depend on a small number of customers for a substantial portion of our business and we expect that a small number of customers will continue to account for a significant part of our revenue in the future. If one of our key customers decides to stop buying our products, or if one of these customers materially reduces its operations or its demand for our products, our business would be materially adversely affected.
17
The ongoing novel coronavirus (COVID-19) pandemic could materially adversely affect our business, financial condition and results of operations.
The COVID-19 pandemic has caused government authorities to implement numerous public health measures, including at various times vaccination and testing requirements and recordkeeping, quarantines, business closures, travel bans, and restrictions related to social gathering and mobility, to contain the virus. Various state and federal rules are issued and updated on an ongoing basis, at times in conflict and/or with minimal notice. We have experienced and expect to continue to experience disruptions to our business as these changing measures have, and will continue to have, an effect on our business operations and practices.
While our employees gradually return to office, we continue to monitor our operations and public health measures implemented by governmental authorities in response to COVID-19. Although some public health measures have eased, our efforts to reopen our offices safely may not be successful and could expose our employees to health risks. It is uncertain as to when all health measures put in place to attempt to contain the spread of COVID-19 will be lifted. If there are further waves of the virus, health measures may be reimplemented and we may need to further limit operations or modify our business practices in a manner that may impact our business. If our employees are not able to perform their job duties due to self-isolation, quarantine, lockdown measures, unavailability of COVID 19 tests, travel restrictions or illness, a reluctance or refusal to vaccinate, or are unable to perform them as efficiently at home for an extended period of time, we may not be able to meet our product schedules, roadmaps and customer commitments and we may experience an overall lower productivity of our workforce. Even when COVID-19 health measures are lifted or modified, our employees’ ability or willingness to return to work may delay the return of our full workforce and the resumption of normal business operations.
COVID-19 continues to impact the global supply chain causing disruptions to service providers, logistics and the flow and availability of supplies and products. We have experienced some disruptions to parts of our supply chain as a result of COVID-19 and we adjust our supply chain requirements based on changing customer needs and demands. We have taken efforts to maintain a stable supply of materials to meet our production requirements through long-term purchase commitments and prepayment arrangements with some of our suppliers. If we are unable to procure a stable supply of equipment, materials or substrates at a reasonable cost, it could have a material adverse effect on our business. We may also assess our product schedules and roadmaps to make any adjustments that may be necessary to support remote working requirements and address the geographic and market demand shifts caused by COVID-19. If the supply of our products to customers is delayed, reduced or canceled due to disruptions encountered by our third-party manufacturers, back-end manufacturers, warehouses, partners, suppliers or vendors as a result of facility closures, border and port restrictions or closures, transportation delays, lockdown measures, labor shortages or workforce mobility limitations, it could have a material adverse effect on our business.
COVID-19 has in the short-term and may in the long-term adversely impact the global economy, creating uncertainty and potentially leading to an economic downturn. This could negatively impact consumer confidence and spending causing our customers to postpone or cancel purchases, or delay paying or default on payment of outstanding amounts due to us, which may have a material adverse effect on our business. Even in times of strong demand for our products, the worldwide economic environment remains uncertain due to COVID-19 and such demand may not be sustainable over the longer term.
COVID-19 has also led to a disruption and volatility in the global capital and financial markets. While we believe our cash, cash equivalents and short-term investments along with our Revolving Credit Agreement and cash flows from operations will be sufficient to fund operations, including capital expenditures, and purchase commitments, over the next 12 months and beyond, to the extent we may require additional funding to finance our operations and capital expenditures and such funding may not be available to us as a result of contracting capital and financial markets resulting from COVID-19, it may have an adverse effect on our business.
The extent to which COVID-19 impacts our business and financial results will depend on future developments, which are unpredictable and highly uncertain, including the continued spread, duration and severity of the outbreak, the appearances of new variants of COVID-19, the breadth and duration of business disruptions related to COVID-19, the availability and distribution of effective treatments and vaccines, and public health measures and actions taken throughout the world to contain COVID-19. The prolonged effect of COVID-19 could materially adversely impact our business, financial condition and results of operations.
18
The markets in which our products are sold are highly competitive.
The markets in which our products are sold are very competitive and delivering the latest and best products to market on a timely basis is critical to achieving revenue growth. We believe that the main factors that determine our product competitiveness are timely product introductions, product quality, product features and capabilities (including enabling state-of-the-art visual and virtual reality (VR) experiences), energy efficiency (including power consumption and battery life), reliability, processor clock speed, performance, size (or form factor), selling price, cost, adherence to industry standards (and the creation of open industry standards), level of integration, software and hardware compatibility, ease of use and functionality of software design tools, completeness of applicable software solutions, security and stability, brand recognition and availability.
We expect that competition will continue to be intense due to rapid technological changes, frequent product introductions by our competitors or new competitors of products that may provide better performance/experience or that may include additional features that render our products comparatively less competitive. We may also face aggressive pricing by competitors, especially during challenging economic times. In addition, our competitors have significant marketing and sales resources which could increase the competitive environment in a declining market, leading to lower prices and margins. Some competitors may have greater access or rights to complementary technologies, including interface, processor and memory technical information. For instance, with our APU products and other competing solutions with integrated graphics, we believe that demand for additional discrete graphics chips and cards may decrease in the future due to improvements in the quality and performance of integrated graphics. If competitors introduce competitive new products into the market before us, demand for our products could be adversely impacted and our business could be adversely affected. In addition, Intel is expanding its position in integrated graphics for the PC market with high-end discrete graphics solutions for a broad range of computing segments, which may negatively impact our ability to compete in these computing segments. We also face competition from companies that use competing computing architectures and platforms like the ARM architecture. Increased adoption of ARM-based semiconductor designs could lead to further growth and development of the ARM ecosystem.
In addition, we are entering markets with current and new competitors who may be able to adapt more quickly to customer requirements and emerging technologies. We cannot guarantee that we will be able to compete successfully against current or new competitors who may have stronger positions in these new markets or superior ability to anticipate customer requirements and emerging industry trends. Furthermore, we may face competition from some of our customers who internally develop the same products as us. We may face delays or disruptions in research and development efforts, or we may be required to invest significantly greater resources in research and development than anticipated. Also, the semiconductor industry has seen several mergers and acquisitions over the last number of years. Further consolidation could adversely impact our business due to there being fewer suppliers, customers and partners in the industry.
Our operating results are subject to quarterly and seasonal sales patterns.
The profile of our sales may be weighted differently during the year. A large portion of our quarterly sales have historically been made in the last month of the quarter. This uneven sales pattern makes prediction of revenue for each financial period difficult and increases the risk of unanticipated variations in quarterly results and financial condition. In addition, our operating results tend to vary seasonally with the markets in which our products are sold. For example, historically, our net revenue has been generally higher in the second half of the year than in the first half of the year, although market conditions and product transitions could impact these trends. Many of the factors that create and affect quarterly and seasonal trends are beyond our control.
If we cannot adequately protect our technology or other intellectual property in the United States and abroad, through patents, copyrights, trade secrets, trademarks and other measures, we may lose a competitive advantage and incur significant expenses.
We rely on a combination of protections provided by contracts, including confidentiality and nondisclosure agreements, copyrights, patents, trademarks and common law rights, such as trade secrets, to protect our intellectual property. However, we cannot assure you that we will be able to adequately protect our technology or other intellectual property from third-party infringement or from misappropriation in the United States and abroad. Any patent licensed by us or issued to us could be challenged, invalidated, expire, or circumvented or rights granted thereunder may not provide a competitive advantage to us.
19
Furthermore, patent applications that we file may not result in issuance of a patent or, if a patent is issued, the patent may not be issued in a form that is advantageous to us. Despite our efforts to protect our intellectual property rights, others may independently develop similar products, duplicate our products or design around our patents and other rights. In addition, it is difficult to monitor compliance with, and enforce, our intellectual property on a worldwide basis in a cost-effective manner. In jurisdictions where foreign laws provide less intellectual property protection than afforded in the United States and abroad, our technology or other intellectual property may be compromised, and our business would be materially adversely affected.
Unfavorable currency exchange rate fluctuations could adversely affect us.
We have costs, assets and liabilities that are denominated in foreign currencies. As a consequence, movements in exchange rates could cause our foreign currency denominated expenses to increase as a percentage of revenue, affecting our profitability and cash flows. Whenever we believe appropriate, we hedge a portion of our foreign currency exposure to protect against fluctuations in currency exchange rates. We determine our total foreign currency exposure using projections of long-term expenditures for items such as payroll. We cannot assure you that these activities will be effective in reducing foreign exchange rate exposure. Failure to do so could have an adverse effect on our business, financial condition, results of operations and cash flow. In addition, the majority of our product sales are denominated in U.S. dollars. Fluctuations in the exchange rate between the U.S. dollar and the local currency can cause increases or decreases in the cost of our products in the local currency of such customers. An appreciation of the U.S. dollar relative to the local currency could reduce sales of our products.
Operational and Technology Risks
We rely on third parties to manufacture our products, and if they are unable to do so on a timely basis in sufficient quantities and using competitive technologies, our business could be materially adversely affected.
We utilize third-party wafer foundries to fabricate the silicon wafers for all of our products. We rely on Taiwan Semiconductor Manufacturing Company Limited (TSMC) for the production of all wafers for microprocessor and GPU products at 7 nanometer (nm) or smaller nodes, and we rely primarily on GLOBALFOUNDRIES Inc. (GF) for wafers for microprocessor and GPU products manufactured at process nodes larger than 7 nm. We also utilize TSMC, United Microelectronics Corporation (UMC) and Samsung Electronics Co., Ltd. for our integrated circuits (IC) in the form of programmable logic devices. We also rely on third-party manufacturers to assemble, test, mark and pack (ATMP) our products. Our third-party package assembly partners are responsible for packaging technology used to fabricate our products. It is important to have reliable relationships with all of these third-party manufacturing suppliers to ensure adequate product supply to respond to customer demand.
We cannot guarantee that these manufacturers or our other third-party manufacturing suppliers will be able to meet our near-term or long-term manufacturing requirements. If we experience supply constraints from our third-party manufacturing suppliers, we may be required to allocate the reduced quantities of affected products amongst our customers, which could have a material adverse effect on our relationships with these customers and on our financial condition. In addition, if we are unable to meet customer demand due to fluctuating or late supply from our manufacturing suppliers, it could result in lost sales and have a material adverse effect on our business. For example, if TSMC is not able to manufacture wafers for our microprocessor and GPU products at 7 nm or smaller nodes and our newest IC products in sufficient quantities to meet customer demand, it could have a material adverse effect on our business.
We do not have long-term commitment contracts with some of our third-party manufacturing suppliers. We obtain some of these manufacturing services on a purchase order basis and these manufacturers are not required to provide us with any specified minimum quantity of product beyond the quantities in an existing purchase order. Accordingly, we depend on these suppliers to allocate to us a portion of their manufacturing capacity sufficient to meet our needs, to produce products of acceptable quality and at acceptable manufacturing yields and to deliver those products to us on a timely basis and at acceptable prices. The manufacturers we use also fabricate wafers and ATMP products for other companies, including certain of our competitors. They could choose to prioritize capacity for other customers, increase the prices that they charge us on short notice, require onerous prepayments, or reduce or eliminate deliveries to us, which could have a material adverse effect on our business.
20
Other risks associated with our dependence on third-party manufacturers include limited control over delivery schedules, yield, cycle times, quality assurance, price increases, lack of capacity in periods of excess demand, misappropriation of our intellectual property, dependence on several subcontractors, and limited ability to manage inventory and parts. Moreover, if any of our third-party manufacturers (or their subcontractors) suffer any damage to facilities, lose benefits under material agreements, experience power outages, lack sufficient capacity to manufacture our products, encounter financial difficulties, are unable to secure necessary raw materials from their suppliers, suffer any other disruption or reduction in efficiency, or experience uncertain social, economic or political circumstances or conditions, we may encounter supply delays or disruptions. If we are unable to secure sufficient or reliable supplies of products, our ability to meet customer demand may be adversely affected and this could materially affect our business.
If we transition the production of some of our products to new manufacturers, we may experience delayed product introductions, lower yields or poorer performance of our products. If we experience problems with product quality or are unable to secure sufficient capacity from a particular third-party manufacturer, or if we for other reasons cease utilizing one of those manufacturers, we may be unable to timely secure an alternative supply for any specific product. We could experience significant delays in the shipment of our products if we are required to find alternative third-party manufacturers, which could have a material adverse effect on our business.
We are a party to a wafer supply agreement (WSA) with GF that governs the terms by which we purchase products manufactured by GF and this agreement is in place through 2025. In May 2021, we entered into an amendment to the WSA, and in December 2021, we further amended these terms (the Amendment). Under the Amendment, GF will provide a minimum annual capacity allocation to us for years 2022 through 2025 and AMD has corresponding annual wafer purchase targets. If we do not meet the annual wafer purchase target for any of these years, we will be required to pay to GF a portion of the difference between the actual wafer purchases and the wafer purchase target for that year. AMD and GF also have agreed to wafer pricing through 2025, and AMD was obligated in 2022 and is obligated in 2023 to pre-pay GF certain amounts for those wafers. The Amendment no longer includes any exclusivity commitments and provides us with full flexibility to contract with any wafer foundry with respect to all products manufactured at any technology node. If our actual wafer requirements are less than the number of wafers required to meet the applicable annual wafer purchase target, we could have excess inventory or higher inventory unit costs, both of which may adversely impact our gross margin and our results of operations. If GF fails to meet its minimum annual capacity allocation obligations, we could experience significant delays in the shipment of our products, which could have a material adverse effect on our business.
We are party to two ATMP joint ventures (collectively, the ATMP JVs) with affiliates of Tongfu Microelectronics Co., Ltd. The majority of our ATMP services are provided by the ATMP JVs and there is no guarantee that the ATMP JVs will be able to fulfill our long-term ATMP requirements. If we are unable to meet customer demand due to fluctuating or late supply from the ATMP JVs, it could result in lost sales and have a material adverse effect on our business.
If essential equipment, materials, substrates or manufacturing processes are not available to manufacture our products, we could be materially adversely affected.
We may purchase equipment, materials and substrates for use by our back-end manufacturing service providers from a number of suppliers and our operations depend upon obtaining deliveries of adequate supplies of equipment and materials on a timely basis. Our third-party suppliers also depend on the same timely delivery of adequate quantities of equipment and materials in the manufacture of our products. In addition, as many of our products increase in technical complexity, we rely on our third-party suppliers to update their processes in order to continue meeting our back-end manufacturing needs. Certain equipment and materials that are used in the manufacture of our products are available only from a limited number of suppliers, or in some cases, a sole supplier. We also depend on a limited number of suppliers to provide the majority of certain types of integrated circuit packages for our microprocessors, including our APU products. Similarly, certain non-proprietary materials or components such as memory, printed circuit boards (PCBs), interposers, substrates and capacitors used in the manufacture of our products are currently available from only a limited number of suppliers. If we are unable to procure a stable supply of equipment, materials or substrates on an ongoing basis and at reasonable costs to meet our production requirements, we could experience a shortage in equipment, materials or substrate supply or an increase in production costs, which could have a material adverse effect on our business. We have long-term purchase commitments and prepayment arrangements with some of our suppliers. If the delivery of such supply is delayed or does not occur for any reason, it could materially impact our ability to procure and process the required volume of supply to meet customer demand. Conversely, a decrease in customer demand could result in excess inventory and an increase in our production costs, particularly since we have prepayment arrangements with certain suppliers.
21
Because some of the equipment and materials that we and our third-party manufacturers purchase are complex, it is sometimes difficult to substitute one equipment or materials supplier for another. From time to time, suppliers may extend lead times, limit supply or increase prices due to capacity constraints or other factors. Also, some of these materials and components may be subject to rapid changes in price and availability. Interruption of supply or increased demand in the industry could cause shortages and price increases in various essential materials. Dependence on a sole supplier or a limited number of suppliers exacerbates these risks. If we are unable to procure certain of these materials for our back-end manufacturing operations, or our third-party manufacturers are unable to procure materials for manufacturing our products, our business would be materially adversely affected.
Failure to achieve expected manufacturing yields for our products could negatively impact our financial results.
Semiconductor manufacturing yields are a result of product design, process technology and packaging technology, which is typically proprietary to the manufacturer, and low yields can result from design failures, packaging technology failures, process technology failures or a combination of some or all of these. Our third-party manufacturers are responsible for the process technologies used to fabricate silicon wafers. If our third-party manufacturers experience manufacturing inefficiencies or encounter disruptions, errors or difficulties during production, we may fail to achieve acceptable yields or we may experience product delivery delays. We cannot be certain that our third-party manufacturers will be able to develop, obtain or successfully implement leading-edge process or packaging technologies needed to manufacture future generations of our products profitably or on a timely basis or that our competitors will not develop new technologies, products or processes earlier. Moreover, during periods when our third-party manufacturers are implementing new process or packaging technologies, their manufacturing facilities may not be fully productive. A substantial delay in the technology transitions to smaller process technologies could have a material adverse effect on us, particularly if our competitors transition to more cost effective technologies before us. For example, we are presently focusing our 7 nm and lower product microprocessor and GPU portfolio on TSMC’s processes. If TSMC is not able to manufacture wafers for our products at 7 nm or smaller nodes in sufficient quantities to meet customer demand, it could have a material adverse effect on our business. Moreover, we rely on TSMC, UMC and our other foundries to produce wafers with competitive performance attributes for our IC products. Therefore, the foundries, particularly TSMC which manufactures our newest IC products, must be able to transition to advanced manufacturing process technologies and increased wafer sizes, produce wafers at acceptable yields and deliver them in a timely manner.
Any decrease in manufacturing yields could result in an increase in per unit costs, which would adversely impact our gross margin and/or force us to allocate our reduced product supply amongst our customers, which could harm our relationships and reputation with our customers and materially adversely affect our business.
The success of our business is dependent upon our ability to introduce products on a timely basis with features and performance levels that provide value to our customers while supporting and coinciding with significant industry transitions.
Our success depends to a significant extent on the development, qualification, implementation and acceptance of new product designs and improvements that provide value to our customers. Our ability to develop, qualify and distribute, and have manufactured, new products and related technologies to meet evolving industry requirements, at prices acceptable to our customers and on a timely basis, are significant factors in determining our competitiveness in our target markets. As consumers have new product feature preferences or have different requirements than those consumers in the PC market, PC sales could be negatively impacted, which could adversely impact our business. We cannot assure you that our efforts to execute our product roadmap will result in innovative products and technologies that provide value to our customers. If we fail to or are delayed in developing, qualifying or shipping new products or technologies that provide value to our customers and address these new trends or if we fail to predict which new form factors consumers will adopt and adjust our business accordingly, we may lose competitive positioning, which could cause us to lose market share and require us to discount the selling prices of our products. Although we make substantial investments in research and development, we cannot be certain that we will be able to develop, obtain or successfully implement new products and technologies on a timely basis or that they will be well-received by our customers. Moreover, our investments in new products and technologies involve certain risks and uncertainties and could disrupt our ongoing business. New investments may not generate sufficient revenue, may incur unanticipated liabilities and may divert our limited resources and distract management from our current operations. We cannot be certain that our ongoing investments in new products and
22
technologies will be successful, will meet our expectations and will not adversely affect our reputation, financial condition and operating results.
Delays in developing, qualifying or shipping new products can also cause us to miss our customers’ product design windows or, in some cases, breach contractual obligations or cause us to pay penalties. If our customers do not include our products in the initial design of their computer systems or products, they will typically not use our products in their systems or products until at least the next design configuration. The process of being qualified for inclusion in a customer’s system or product can be lengthy and could cause us to further miss a cycle in the demand of end-users, which also could result in a loss of market share and harm our business. We also depend on the success and timing of our customers’ platform launches. If our customers delay their product launches or if our customers do not effectively market their platforms with our products, it could result in a delay in bringing our products to market and cause us to miss a cycle in the demand of end-users, which could materially adversely affect our business. In addition, market demand requires that products incorporate new features and performance standards on an industry-wide basis. Over the life of a specific product, the sale price is typically reduced over time. The introduction of new products and enhancements to existing products is necessary to maintain the overall corporate average selling price. If we are unable to introduce new products with sufficiently high sale prices or to increase unit sales volumes capable of offsetting the reductions in the sale prices of existing products over time, our business could be materially adversely affected.
Our revenue from our semi-custom SoC products is dependent upon our semi-custom SoC products being incorporated into customers’ products and the success of those products.
The revenue that we receive from our semi-custom SoC products is in the form of non-recurring engineering fees charged to third parties for design and development services and revenue received in connection with sales of our semi-custom SoC products to these third parties. As a result, our ability to generate revenue from our semi-custom products depends on our ability to secure customers for our semi-custom design pipeline, our customers’ desire to pursue the project and our semi-custom SoC products being incorporated into those customers’ products. Any revenue from sales of our semi-custom SoC products is directly related to sales of the third-party’s products and reflective of their success in the market. Moreover, we have no control over the marketing efforts of these third parties, and we cannot make any assurances that sales of their products will be successful in current or future years. Consequently, the semi-custom SoC product revenue expected by us may not be fully realized and our operating results may be adversely affected.
Our products may be subject to security vulnerabilities that could have a material adverse effect on us.
The products that we sell are complex and have been and may in the future be subject to security vulnerabilities that could result in, among other things, the loss, corruption, theft or misuse of confidential data or system performance issues. Our efforts to prevent and address security vulnerabilities may decrease performance, be only partially effective or not successful at all. We may depend on vendors to create mitigations to their technology that we incorporate into our products and they may delay or decline to make such mitigations. We may also depend on third parties, such as customers and end users, to deploy our mitigations alone or as part of their own mitigations, and they may delay, decline or modify the implementation of such mitigations. Our relationships with our customers could be adversely affected as some of our customers may stop purchasing our products, reduce or delay future purchases of our products, or use competing products. Any of these actions by our customers could adversely affect our revenue. We have and may in the future be subject to claims and litigation related to security vulnerabilities. Actual or perceived security vulnerabilities of our products may subject us to adverse publicity, damage to our brand and reputation, and could materially harm our business or financial results.
IT outages, data loss, data breaches and cyber-attacks could compromise our intellectual property or other sensitive information, be costly to remediate or cause significant damage to our business, reputation and operations.
In the ordinary course of our business, we maintain sensitive data on our information technology (IT) assets, and also may maintain sensitive information on our business partners’ and third-party providers’ IT assets, including our intellectual property and proprietary or confidential business information relating to our business and that of our customers and business partners. The White House, SEC and other regulators have also increased their focus on companies’ cybersecurity vulnerabilities and risks. Maintaining the security of this information is important to our business and reputation. AMD and companies like AMD and our vendors and customers have been increasingly subject to cybersecurity attempts and threats. The increased prevalence of work-from-home arrangements at AMD
23
and our providers has presented additional operational risks and cybersecurity attack vectors to our IT systems. These threats can come from a variety of sources, all ranging in sophistication from an individual hacker or insider threat to a state-sponsored attack. Cyber threats may be generic, or they may be custom-crafted against our information systems. Cyber threats have and may come into our network through malicious code that is added to widely available open-source software, compromised commercial software or security vulnerabilities in our products or those of a third party that are being used by attackers prior to mitigations being put in place, such as zero-day attacks. Cyber-attacks have and may come into our IT system through the compromise of our users’ access credentials. Users’ access credentials can be compromised by phishing, vishing, smishing, multi-factor authentication (MFA) prompt bombing, hacking, or other social engineering, cybersecurity, or theft activities. Cyber-attacks have become increasingly more prevalent and much harder to detect, defend against or prevent and have and may cause a disruption to our business. Our network and storage applications, as well as those of our customers, business partners, and third-party providers, may be subject to unauthorized access by hackers or breached due to operator error, malfeasance or other system disruptions.
It is often difficult to anticipate or immediately detect such incidents and the damage caused by such incidents. It also may not be possible to determine the root cause of such incidents or mitigate quickly enough to stop an attack. These data breaches and any unauthorized access, misuse or disclosure of our information or intellectual property could compromise our intellectual property and expose sensitive business information or personally identifiable information. Cyber-attacks on us or our customers, business partners or third-party providers could also cause us to incur significant remediation costs, result in product development delays, disrupt key business operations and divert attention of management and key information technology resources. These incidents could also subject us to liability, expose us to significant expense and cause significant harm to our reputation and business.
We also maintain confidential and personally identifiable information about our workers and consumers. The confidentiality and integrity of our worker and consumer data is important to our business and our workers and consumers have a high expectation that we adequately protect their personal information. In addition, many governments have enacted laws around personally identifiable information, such as the European Union’s General Data Protection Regulation and the California Consumer Privacy Act, and failure to comply or a breach of personally identifiable information could result in sanctions or other actions by the governments or litigation by other entities.
We anticipate ongoing and increasing costs related to enhancing and implementing information security controls, including costs related to upgrading application, computer, and network security components; training workers to maintain and monitor our security controls; investigating, responding to and remediating any data security breach, and addressing any related litigation; mitigating reputational harm; and complying with external regulations.
We often partner with third-party providers for certain worker services and we may provide certain limited worker information to such third parties based on the scope of the services provided to us. We also provide sensitive information to vendors, customers and contractors. If these third parties fail to adopt or adhere to adequate data security practices, or in the event of a breach of their networks, our workers’ data and sensitive information may be improperly accessed, used or disclosed.
A breach of data privacy may cause significant disruption of our business operations. Failure to adequately maintain and update our security systems could materially adversely affect our operations and our ability to maintain worker confidence. Failure to prevent unauthorized access to electronic and other confidential information, IT outages, data loss and data breaches could materially adversely affect our financial condition, our competitive position and operating results.
We may encounter difficulties in upgrading and operating our new enterprise resource planning system, which could materially adversely affect us.
We are currently upgrading our enterprise resource planning (ERP) system to help us manage our operations and financial reporting. The adoption of a new ERP system is a major undertaking and poses several challenges, both financially and from a management and personnel perspective. Costs and risks inherent in the conversion to our upgraded and new system may include disruptions to business continuity, difficulty in maintaining effective internal controls, administrative and technical problems, interruptions or delays in sales processes, expenditure overruns, and data migration issues. If we do not properly address or mitigate these issues it could result in increased costs and the diversion of management’s attention and resources, negatively impacting our operating results and ability to effectively manage our business. Moreover, once our ERP system is upgraded, it may not operate as we expect it to
24
and cause disruption to our operations. There are no assurances that our new ERP system will be successfully implemented and the failure to do so could have a material adverse effect on our business.
Uncertainties involving the ordering and shipment of our products could materially adversely affect us.
We typically sell our products pursuant to individual purchase orders. We generally do not have long-term supply arrangements with our customers or minimum purchase requirements except that orders generally must be for standard pack quantities. Generally, our customers may cancel orders for standard products more than 30 days prior to shipment without incurring significant fees. We base our inventory levels in part on customers’ estimates of demand for their products, which may not accurately predict the quantity or type of our products that our customers will want in the future or ultimately end up purchasing. Our ability to forecast demand is even further complicated when our products are sold indirectly through downstream channel distributors and customers, as our forecasts for demand are then based on estimates provided by multiple parties throughout the downstream channel. For instance, we have experienced and continue to experience increased demand for our products. To the extent we fail to forecast demand and product mix accurately or are unable to increase production or secure sufficient capacity and there is a mismatch between supply and demand for our products, it could limit our ability to meet customer demand and have a material adverse effect on our business. Many of our markets are characterized by short product lifecycles, which can lead to rapid obsolescence and price erosion. In addition, our customers may change their inventory practices on short notice for any reason. For example, in the second half of 2022, we experienced a decline in our Client segment revenue as a result of weak PC market macroeconomic conditions and inventory correction actions across the PC supply chain. We may build inventories during periods of anticipated growth, and the cancellation or deferral of product orders or overproduction due to failure of anticipated orders to materialize could result in excess or obsolete inventory, which could result in write-downs of inventory and an adverse effect on gross margins. Our customers may also experience a shortage of, or delay in receiving certain components to build their products, which in turn may affect the demand for or the timing of our products. For instance, OEMs have and continue to experience industry-wide challenges securing matched component sets to build their products.
Excess or obsolete inventory have and may in the future result in write-downs of the value of our inventory. For example, in the third quarter of 2022, we recorded certain charges primarily for inventory, pricing and related reserves in the Gaming and Client segments. Other factors that may result in excess or obsolete inventory include, a reduction in the average selling price, or a reduction in our gross margin include: a sudden or significant decrease in demand for our products; a production or design defect in our products; a higher incidence of inventory obsolescence because of rapidly changing technology and customer requirements; a failure to accurately estimate customer demand for our products, including for our older products as our new products are introduced; or our competitors introducing new products or taking aggressive pricing actions.
Our ability to design and introduce new products in a timely manner includes use of third-party intellectual property.
In the design and development of new and enhanced products, we rely on third-party intellectual property such as development and testing tools for software and hardware. Furthermore, certain product features may rely on intellectual property acquired from third parties. The design requirements necessary to meet customer demand for more features and greater functionality from semiconductor products may exceed the capabilities of the third-party intellectual property or development or testing tools available to us. If the third-party intellectual property that we use becomes unavailable, is not available with required functionality or performance in the time frame, manufacturing technology, or price point needed for our new products or fails to produce designs that meet customer demands, or laws are adopted that affect our use of third party intellectual property in certain regions or products, our business could be materially adversely affected.
We depend on third-party companies for the design, manufacture and supply of motherboards, software, memory and other computer platform components to support our business and products.
We depend on third-party companies for the design, manufacture and supply of motherboards, graphics cards, software (e.g., BIOS, operating systems, drivers), memory and other components that we use to design, support and sell, and our customers utilize to support and/or use our product offerings. We also rely on our AIB partners to support our products. In addition, our microprocessors are not designed to function with motherboards and chipsets designed to work with Intel microprocessors. If the designers, manufacturers, AIBs and suppliers of motherboards, graphics cards, software, memory and other components cease or reduce their design, manufacture or production
25
of current or future products that are based on, utilized in, or support our products, or laws are adopted that result in the same, our business could be materially adversely affected.
If we lose Microsoft Corporation’s support for our products or other software vendors do not design and develop software to run on our products, our ability to sell our products could be materially adversely affected.
Our ability to innovate beyond the x86 instruction set controlled by Intel depends partially on Microsoft designing and developing its operating systems to run on or support our x86-based microprocessor products. With respect to our graphics products, we depend in part on Microsoft to design and develop its operating system to run on or support our graphics products. Similarly, the success of our products in the market, such as our APU products, is dependent on independent software providers designing and developing software to run on our products. If Microsoft does not continue to design and develop its operating systems so that they work with our x86 instruction sets or does not continue to develop and maintain their operating systems to support our graphics products, independent software providers may forego designing their software applications to take advantage of our innovations and customers may not purchase PCs with our products. In addition, some software drivers licensed for use with our products are certified by Microsoft. If Microsoft did not certify a driver, or if we otherwise fail to retain the support of Microsoft or other software vendors, our ability to market our products would be materially adversely affected.
Our reliance on third-party distributors and AIB partners subjects us to certain risks.
We market and sell our products directly and through third-party distributors and AIB partners pursuant to agreements that can generally be terminated for convenience by either party upon prior notice to the other party. These agreements are non-exclusive and permit both our distributors and AIB partners to offer our competitors’ products. We are dependent on our distributors and AIB partners to supplement our direct marketing and sales efforts. If any significant distributor or AIB partner or a substantial number of our distributors or AIB partners terminated their relationship with us, decided to market our competitors’ products over our products or decided not to market our products at all, our ability to bring our products to market would be impacted and we would be materially adversely affected. In addition, if we are unable to collect accounts receivable from our significant distributors and/or AIB partners, it could have a material adverse effect on our business. If we are unable to manage the risks related to the use of our third-party distributors and AIB partners or offer appropriate incentives to focus them on the sale of our products, our business could be materially adversely affected.
Additionally, distributors and AIB partners typically maintain an inventory of our products. In most instances, our agreements with distributors protect their inventory of our products against price reductions, as well as provide return rights for any product that we have removed from our price book that is less than 12 months older than the manufacturing date. Some agreements with our distributors also contain standard stock rotation provisions permitting limited levels of product returns. Our agreements with AIB partners protect their inventory of our products against price reductions. In the event of a significant decline in the price of our products, the price protection rights we offer would materially adversely affect us because our revenue and corresponding gross margin would decline.
Our business is dependent upon the proper functioning of our internal business processes and information systems and modification or interruption of such systems may disrupt our business, processes and internal controls.
We rely upon a number of internal business processes and information systems to support key business functions, and the efficient operation of these processes and systems is critical to our business. Our business processes and information systems need to be sufficiently scalable to support the growth of our business and may require modifications or upgrades that expose us to a number of operational risks. As such, our information systems will continually evolve and adapt in order to meet our business needs. These changes may be costly and disruptive to our operations and could impose substantial demands on management time.
These changes may also require changes in our information systems, modification of internal control procedures and significant training of employees and third-party resources. We continuously work on simplifying our information systems and applications through consolidation and standardization efforts. There can be no assurance that our business and operations will not experience any disruption in connection with this transition. Our information technology systems, and those of third-party information technology providers or business partners, may also be vulnerable to damage or disruption caused by circumstances beyond our control including catastrophic events,
26
power anomalies or outages, natural disasters, viruses or malware, cyber-attacks, insider threat attacks, unauthorized system or data modifications, data breaches and computer system or network failures, exposing us to significant cost, reputational harm and disruption or damage to our business.
In addition, as our IT environment continues to evolve, we are embracing new ways of communicating and sharing data internally and externally with customers and partners using methods such as mobility and the cloud that can promote business efficiency. However, these practices can also result in a more distributed IT environment, making it more difficult for us to maintain visibility and control over internal and external users, and meet scalability and administrative requirements. If our security controls cannot keep pace with the speed of these changes, or if we are not able to meet regulatory and compliance requirements, our business would be materially adversely affected.
If our products are not compatible with some or all industry-standard software and hardware, we could be materially adversely affected.
Our products may not be fully compatible with some or all industry-standard software and hardware. Further, we may be unsuccessful in correcting any such compatibility problems in a timely manner. If our customers are unable to achieve compatibility with software or hardware, we could be materially adversely affected. In addition, the mere announcement of an incompatibility problem relating to our products could have a material adverse effect on our business.
Costs related to defective products could have a material adverse effect on us.
Products as complex as those we offer may contain defects or failures when first introduced or when new versions or enhancements to existing products are released. We cannot assure you that, despite our testing procedures, errors will not be found in new products or releases after commencement of commercial shipments in the future, which could result in loss of or delay in market acceptance of our products, material recall and replacement costs, loss of revenue, writing down the inventory of defective products, the diversion of the attention of our engineering personnel from product development efforts, defending against litigation related to defective products or related liabilities, including property damage, personal injury, damage to our reputation in the industry and loss of data or intangible property, and could adversely affect our relationships with our customers. In addition, we may have difficulty identifying the end customers of the defective products in the field. As a result, we could incur substantial costs to implement modifications to correct defects. Any of these problems could materially adversely affect our business.
We could be subject to potential product liability claims if one of our products causes, or merely appears to have caused, an injury, whether tangible or intangible. Claims may be made by consumers or others selling our products, and we may be subject to claims against us even if an alleged injury is due to the actions of others. A product liability claim, recall or other claim with respect to uninsured liabilities or for amounts in excess of insured liabilities could have a material adverse effect on our business.
If we fail to maintain the efficiency of our supply chain as we respond to changes in customer demand for our products, our business could be materially adversely affected.
Our ability to meet customer demand for our products depends, in part, on our ability to deliver the products our customers want on a timely basis. Accordingly, we rely on our supply chain for the manufacturing, distribution and fulfillment of our products. As we continue to grow our business, expand to high-growth adjacent markets, acquire new customers and strengthen relationships with existing customers, the efficiency of our supply chain will become increasingly important because many of our customers tend to have specific requirements for particular products, geographic requirements, and specific time-frames in which they require delivery of these products. If we are unable to consistently deliver the right products to our customers on a timely basis in the right locations, our customers may reduce the quantities they order from us, which could have a material adverse effect on our business.
27
We outsource to third parties certain supply-chain logistics functions, including portions of our product distribution, transportation management and information technology support services.
We rely on third-party providers to operate our regional product distribution centers and to manage the transportation of our work-in-process and finished products among our facilities, to our third-party manufacturers and to our customers. In addition, we rely on third parties to provide certain information technology services to us, including help desk support, desktop application services, business and software support applications, server and storage administration, data center operations, database administration and voice, video and remote access. We cannot guarantee that these providers will fulfill their respective responsibilities in a timely manner in accordance with the contract terms, in which case our internal operations and the distribution of our products to our customers could be materially adversely affected. Also, we cannot guarantee that our contracts with these third-party providers will be renewed, in which case we would have to transition these functions in-house or secure new providers, which could have a material adverse effect on our business if the transition is not executed appropriately.
Our inability to effectively control the sales of our products on the gray market could have a material adverse effect on us.
We market and sell our products directly to OEMs and through authorized third-party distributors. From time to time, our products are diverted from our authorized distribution channels and are sold on the “gray market.” Gray market products result in shadow inventory that is not visible to us, thus making it difficult to forecast demand accurately. Also, when gray market products enter the market, we and our distribution channels compete with these heavily discounted gray market products, which adversely affects demand for our products and negatively impacts our margins. In addition, our inability to control gray market activities could result in customer satisfaction issues because any time products are purchased outside our authorized distribution channels there is a risk that our customers are buying counterfeit or substandard products, including products that may have been altered, mishandled or damaged, or are used products represented as new.
Legal and Regulatory Risks
Government actions and regulations such as export regulations, tariffs, and trade protection measures may limit our ability to export our products to certain customers.
We have equity interests in two joint ventures (collectively, the THATIC JV) with Higon Information Technology Co., Ltd. (THATIC), a third-party Chinese entity. In June 2019, the Bureau of Industry and Security (BIS) of the United States Department of Commerce added certain Chinese entities to the Entity List, including THATIC and the THATIC JV. Since that time, the United States administration has called for changes to domestic and foreign policy, including policies with respect to China and Russia. Specifically, United States-China trade relations remain uncertain as the United States continues to add more Chinese companies to the Entity List and more regulations targeted to advanced computing, semiconductor manufacturing, and AI. Further, the United States and other countries and coalitions have issued sanctions and revisions to export control and other regulations against Russia, Belarus or the DNR or LNR regions of Ukraine, due to the conflict in Ukraine. BIS has issued new requirements that prevent us from shipping MI250 and MI250X integrated circuits to China and Russia without a license. BIS may possibly issue new licensing requirements and regulatory controls in the future. A significant trade disruption or the establishment or increase of any tariffs, trade protection measures or restrictions could result in lost sales adversely impacting our reputation and business. There is also a possibility of future tariffs, trade protection measures, import or export regulations or other restrictions imposed on our products or on our customers by the United States, China or other countries that could have a material adverse effect on our business. Export control restrictions may adversely impact the ability of our research and development teams located outside of the United States from executing our product roadmaps in a timely manner or at all.
We may, from time to time, receive technical data from third parties that is subject to the International Traffic and Arms Regulations (ITAR), which are administered by the U.S. Department of State. EAR and ITAR govern the export and re-export of certain AMD products, including FPGAs, and the transfer of related technologies, whether in the U.S. or abroad, and the provision of services. We are required to maintain an internal compliance program and security infrastructure to meet EAR and ITAR requirements. An inability to obtain the required export licenses, or to predict when they will be granted, increases the difficulties of forecasting shipments. In addition, security or compliance program failures that could result in penalties or a loss of export privileges, as well as stringent licensing restrictions that may make our products less attractive to overseas customers, could have a material adverse effect on our business, financial condition and/or operating results.
28
If we cannot realize our deferred tax assets, our results of operations could be adversely affected.
Our deferred tax assets include net operating losses and tax credit carryforwards that can be used to offset taxable income and reduce income taxes payable in future periods. Each quarter, we consider both positive and negative evidence to determine whether all or a portion of the deferred tax assets are more likely than not to be realized. If we determine that some or all of our deferred tax assets are not realizable, it could result in a material expense in the period in which this determination is made which may have a material adverse effect on our financial condition and results of operations.
In addition, a significant amount of our deferred tax assets related to net operating losses or tax credits which remain under a valuation allowance could be subject to limitations under Internal Revenue Code Section 382 or 383, separate return loss year rules, or dual consolidated loss rules. The limitations could reduce our ability to utilize the net operating losses or tax credits before the expiration of the tax attributes.
Our business is subject to potential tax liabilities, and exposure to greater-than-anticipated income tax liabilities as a result of changes in tax rules and regulations, changes in interpretation of tax rules and regulations, or unfavorable assessments from tax audits, any of which could affect our effective tax rates, financial condition, and results of operations.
We are a U.S.-based multinational company subject to income tax, indirect tax or other tax claims in multiple U.S. and foreign tax jurisdictions in which we conduct business. Significant judgment is required in determining our worldwide provision for income taxes. Tax laws are dynamic and subject to change as new laws are passed and new interpretations of the law are issued or applied. Any changes to tax laws could have a material adverse effect on our tax obligations and effective tax rate. Our income tax obligations could be affected by many factors, including, but not limited to, changes to our corporate operating structure, intercompany arrangements, and tax planning strategies.
Our income tax expense is computed based on tax rates at the time of the respective financial period. Our future effective tax rates, financial condition and results from operations could be unfavorably affected by changes in the tax rates in jurisdictions where our income is earned, by changes in the tax rules and regulations or the interpretation of tax rules and regulations in the jurisdictions in which we do business or by changes in the valuation of our deferred tax assets.
In addition, we are subject to examinations of our income tax returns by domestic and foreign tax authorities. We regularly assess the likelihood of outcomes resulting from these examinations to determine the adequacy of our provision for income taxes and have reserved for potential adjustments that may result from the current examinations. There can be no assurance that the final determination of any of these examinations will not have an adverse effect on our effective tax rates, financial condition, and results of operations.
In the ordinary course of our business, there are many transactions and calculations where the ultimate income tax, indirect tax, or other tax determination is uncertain. Although we believe our tax estimates are reasonable, we cannot assure that the final determination of any tax audits or litigation will not be materially different from that which is reflected in historical tax provisions and accruals. Should additional taxes be assessed as a result of an audit, assessment or litigation, there could be a material adverse effect on our cash, tax provisions and net income in the period or periods for which that determination is made.
We are party to litigation and may become a party to other claims or litigation that could cause us to incur substantial costs or pay substantial damages or prohibit us from selling our products.
From time to time, we are a defendant or plaintiff in various legal actions, as described in Note 17 - Contingencies of the Notes to our Consolidated Financial Statements. For example, we have been subject to certain claims concerning federal securities laws and corporate governance. Our products are purchased by and/or used by consumers, which could increase our exposure to consumer actions such as product liability claims and consumer class action claims. On occasion, we receive claims that individuals were allegedly exposed to substances used in our former semiconductor wafer manufacturing facilities and that this alleged exposure caused harm. Litigation can involve complex factual and legal questions, and its outcome is uncertain. It is possible that if a claim is successfully asserted against us, it could result in the payment of damages that could be material to our business.
29
With respect to intellectual property litigation, from time to time, we have been notified of, or third parties may bring or have brought, actions against us and/or against our customers based on allegations that we are infringing the intellectual property rights of others, contributing to or inducing the infringement of the intellectual property rights of others, improperly claiming ownership of intellectual property or otherwise improperly using the intellectual property of others. If any such claims are asserted, we may seek to obtain a license under the third parties’ intellectual property rights. We cannot assure you that we will be able to obtain all of the necessary licenses on satisfactory terms, if at all. These parties may file lawsuits against us or our customers seeking damages (potentially up to and including treble damages) or an injunction against the sale of products that incorporate allegedly infringed intellectual property or against the operation of our business as presently conducted, which could result in our having to stop the sale of some of our products or to increase the costs of selling some of our products or which could damage our reputation. The award of damages, including material royalty payments, or other types of damages, or the entry of an injunction against the manufacture and sale of some or all of our products could have a material adverse effect on us. We could decide, in the alternative, to redesign our products or to resort to litigation to challenge such claims. Such challenges could be extremely expensive and time-consuming regardless of their merit, could cause delays in product release or shipment and/or could have a material adverse effect on us. We cannot assure you that litigation related to our intellectual property rights or the intellectual property rights of others can always be avoided or successfully concluded.
Even if we were to prevail, any litigation could be costly and time-consuming and would divert the attention of our management and key personnel from our business operations, which could have a material adverse effect on us.
We are subject to environmental laws, conflict minerals-related provisions of the Dodd-Frank Wall Street Reform and Consumer Protection Act as well as a variety of other laws or regulations that could result in additional costs and liabilities.
Our operations and properties have in the past been and continue to be subject to various United States and foreign laws and regulations, including those relating to materials used in our products and manufacturing processes, discharge of pollutants into the environment, the treatment, transport, storage and disposal of solid and hazardous wastes and remediation of contamination. For the manufacturing of our products, these laws and regulations require our suppliers to obtain permits for operations, including the discharge of air pollutants and wastewater. Although our management systems are designed to oversee our suppliers’ compliance, we cannot assure you that our suppliers have been or will be at all times in complete compliance with such laws, regulations and permits. If our suppliers violate or fail to comply with any of them, a range of consequences could result, including fines, suspension of production, alteration of manufacturing processes, import/export restrictions, sales limitations, criminal and civil liabilities or other sanctions. Such non-compliance from our manufacturing suppliers could result in disruptions in supply, higher sourcing costs, and/or reputational damage for us. We could also be held liable for any and all consequences arising out of exposure to hazardous materials used, stored, released, disposed of by us or located at, under or emanating from our current or former facilities or other environmental or natural resource damage. While we have budgeted for foreseeable associated expenditures, we cannot assure you that future environmental legal requirements will not become more stringent or costly in the future. Therefore, we cannot assure you that our costs of complying with current and future environmental and health and safety laws, and our liabilities arising from past and future releases of, or exposure to, hazardous substances will not have a material adverse effect on us.
Environmental laws are complex, change frequently and have tended to become more stringent over time. For example, the European Union (EU) and China are two among a growing number of jurisdictions that have enacted restrictions on the use of lead and other materials in electronic products. These regulations affect semiconductor devices and packaging. As regulations restricting materials in electronic products continue to increase around the world, there is a risk that the cost, quality and manufacturing yields of products that are subject to these restrictions may be less favorable compared to products that are not subject to such restrictions, or that the transition to compliant products may not meet customer roadmaps, or produce sudden changes in demand, which may result in excess inventory. A number of jurisdictions including the EU, Australia, California and China are developing or have finalized market entry or public procurement regulations for computers and servers based on ENERGY STAR specifications as well as additional energy consumption limits. There is the potential for certain of our products being excluded from some of these markets which could materially adversely affect us.
30
Certain environmental laws, including the United States Comprehensive, Environmental Response, Compensation and Liability Act of 1980, or the Superfund Act, impose strict or, under certain circumstances, joint and several liability on current and previous owners or operators of real property for the cost of removal or remediation of hazardous substances and impose liability for damages to natural resources. These laws often impose liability even if the owner or operator did not know of, or was not responsible for, the release of such hazardous substances. These environmental laws also assess liability on persons who arrange for hazardous substances to be sent to disposal or treatment facilities when such facilities are found to be contaminated. Such persons can be responsible for cleanup costs even if they never owned or operated the contaminated facility. We have been named as a responsible party at three Superfund sites in Sunnyvale, California. Although we have not been, we could be named a potentially responsible party at other Superfund or contaminated sites in the future. In addition, contamination that has not been identified could exist at our other facilities.
Under the Dodd-Frank Wall Street Reform and Consumer Protection Act of 2010, the SEC adopted disclosure and reporting requirements for companies that use “conflict” minerals originating from the Democratic Republic of Congo or adjoining countries. We continue to incur additional costs associated with complying with these requirements, such as costs related to developing internal controls for the due diligence process, determining the source of any conflict minerals used in our products, auditing the process and reporting to our customers and the SEC. In addition to the SEC regulation, the European Union, China and other jurisdictions are developing new policies focused on conflict minerals that may impact and increase the cost of our compliance program. Customers are increasingly seeking information about the source of minerals used in our supply chain beyond those addressed in laws and regulations. Given the complexity of mineral supply chains, we may face reputational challenges if we are unable to sufficiently verify the origins of the subject minerals. Moreover, we are likely to encounter challenges to satisfy those customers who require that all of the components of our products be certified as “conflict free.” If we cannot satisfy these customers, they may choose a competitor’s products.
In addition to our company, customers, governments and authorities continue to be focused on eliminating risks of forced labor in supply chains which may increase the cost of our compliance program. For example, the United States Uyghur Forced Labor Prevent Act prohibits goods mined, produced or manufactured wholly or in part in the Xinjiang Uyghur Autonomous Region of the People’s Republic of China, or by certain entities, from entering the United States under the presumption of being made with forced labor. Germany’s federal procurement office, in collaboration with the Bitkom trade association, has issued supply chain labor requirements. In addition, the United Kingdom, Australia and the State of California have enacted laws that require us to disclose our policy and practices for identifying and eliminating forced labor and human trafficking in our supply chain. Several customers have also issued expectations to eliminate these occurrences, if any, that may impact us. While we have a Human Rights Policy and management systems to identify and avoid these practices in our supply chain, we cannot guarantee that our suppliers will always be in conformance to these laws and expectations. We may face enforcement liability and reputational challenges if we are unable to sufficiently meet these expectations. Moreover, we are likely to encounter challenges with customers if we cannot satisfy their forced and trafficked labor polices and they may choose a competitor’s product.
Merger, Acquisition and Integration Risks
Acquisitions, joint ventures and/or investments and the failure to integrate acquired businesses, could disrupt our business and/or dilute or adversely affect the price of our common stock.
Our success will depend, in part, on our ability to expand our product offerings and grow our business in response to changing technologies, customer demands and competitive pressures. In some circumstances, we may pursue growth through the acquisition of complementary businesses, solutions or technologies or through joint ventures or investments rather than through internal development. The identification of suitable acquisition or joint venture candidates can be difficult, time-consuming and costly, and we may not be able to successfully complete identified acquisitions or joint ventures.
31
For example, on February 14, 2022, we completed our acquisition of Xilinx and on May 26, 2022, we completed our acquisition of Pensando. While we believe these acquisitions will result in certain benefits, including certain operational synergies and cost efficiencies, and drive product innovations, achieving these anticipated benefits will depend on successfully combining our and the acquired companies’ businesses together. It is not certain that the acquired companies can be successfully integrated with our business in a timely manner or at all, or that any of the anticipated benefits will be realized for a variety of reasons, including, but not limited to: our inability to integrate or benefit from acquired technologies or services in a profitable manner; diversion of capital and other resources, including management’s attention from our existing business; unanticipated costs or liabilities associated with the integration; failure to leverage the increased scale of the combined businesses quickly and effectively; coordinating and integrating in countries in which we have not previously operated; the potential impact of the acquisitions on our relationships with employees, vendors, suppliers and customers; the impairment of relationships with, or the loss of, the acquired companies’ employees, vendors, suppliers and customers; adverse changes in general economic conditions in regions in which we and the acquired companies operate; potential litigation associated with the acquisitions; difficulties in the assimilation of employees and culture; difficulties in managing the expanded operations of a larger and more complex company; challenges in attracting and retaining key personnel; and difficulties with integrating and upgrading our and the acquired companies’ financial reporting systems. Many of these factors will be outside of our control and any one of them could result in increased costs, decreases in expected revenues and diversion of management’s time and attention, which could materially impact the combined company. In addition, even if the operations of the businesses are integrated successfully, the full benefits of the acquisitions may not be realized within the anticipated time frame or at all. All of these factors could decrease or delay the expected accretive effect of the acquisitions and negatively impact the combined company. If we cannot successfully integrate our and the acquired companies’ businesses and operations, or if there are delays in combining the businesses, it could negatively impact our ability to develop or sell new products and impair our ability to grow our business, which in turn could adversely affect our financial condition and operating results.
Acquisitions and joint ventures may also involve the entry into geographic or business markets in which we have little or no prior experience. Consequently, we may not achieve anticipated benefits of acquisitions or joint ventures, which could harm our operating results. In addition, to complete an acquisition, we may issue equity securities, which would dilute our stockholders’ ownership and could adversely affect the price of our common stock, and/or incur debt, assume contingent liabilities or have amortization expenses and write-downs of acquired assets, which could adversely affect our results of operations. Moreover, if such acquisitions or joint ventures require us to seek additional debt or equity financing, we may not be able to obtain such financing on terms favorable to us or at all. Even if we successfully complete an acquisition or joint venture, we may not be able to assimilate and integrate effectively or efficiently the acquired business, technologies, solutions, assets, personnel or operations, particularly if key personnel of the acquired company decide not to work for us.
Acquisitions and joint ventures may also reduce our cash available for operations and other uses, which could harm our business. Also, any failure on our part to effectively evaluate and execute new business initiatives could adversely affect our business. We may not adequately assess the risks of new business initiatives and subsequent events may arise that alter the risks that were initially considered. Furthermore, we may not achieve the objectives and expectations with respect to future operations, products and services. The majority of our ATMP services are provided by the ATMP JVs, and there is no guarantee that the JVs will be able to fulfill our long-term ATMP requirements. If we are unable to meet customer demand due to fluctuating or late supply from the ATMP JVs, it could result in lost sales and have a material adverse effect on our business.
In addition, we may not realize the anticipated benefits from our business initiatives. For example, we may not realize the expected benefits from the THATIC JV’s expected future performance, including the receipt of any future milestone payments and any royalties from certain licensed intellectual property. In June 2019, the BIS added certain Chinese entities to the Entity List, including THATIC and the THATIC JV. We are complying with U.S. law pertaining to the Entity List designation.
32
Any impairment of our tangible, definite-lived intangible or indefinite-lived intangible assets, including goodwill, may adversely impact our financial position and results of operations.
We account for certain acquisitions, including the Xilinx and Pensando acquisitions, using the acquisition method of accounting under the provisions of ASC 805, Business Combinations, with AMD representing the accounting acquirer under this guidance. We record assets acquired, including identifiable intangible assets, and liabilities assumed, at their respective fair values at the acquisition date. Any excess of the purchase price over the net fair value of such assets and liabilities will be recorded as goodwill. In connection with the Xilinx and Pensando acquisitions, we recorded significant goodwill and other intangible assets on our consolidated balance sheet.
Indefinite-lived intangible assets, including goodwill, are tested for impairment at least annually, and all tangible and intangible assets including goodwill will be tested for impairment when certain indicators are present. If, in the future, we determine that tangible or intangible assets, including goodwill, are impaired, we would record an impairment charge at that time. Impairment testing of goodwill requires significant use of judgment and assumptions, particularly as it relates to the determination of fair value. Subsequent to our annual goodwill impairment analysis, we monitor for any events or changes in circumstances, such as significant adverse changes in business climate or operating results, changes in management’s business strategy, an inability to successfully introduce new products in the marketplace, an inability to successfully achieve internal forecasts or significant declines in our stock price, which may represent an indicator of impairment. A decrease in the long-term economic outlook and future cash flows of our business could significantly impact asset values and potentially result in the impairment of goodwill and may require us to record future goodwill impairment charges, which may have a material adverse impact on our financial position and results of operations.
Liquidity and Capital Resources Risks
The agreements governing our notes, our guarantees of the Assumed Xilinx Notes, and our Revolving Credit Agreement impose restrictions on us that may adversely affect our ability to operate our business.
The indenture governing our 3.924% Senior Notes due 2032 and 4.393% Senior Notes due 2052 contains various covenants that limit our ability to, among other things: create liens on certain assets to secure debt, enter into certain sale and leaseback transactions; and consolidate with, merge into or sell, convey or lease all or substantially all of our assets to any other person.
Additionally, in connection with the acquisition of Xilinx, we entered into supplemental indentures for the Assumed Xilinx Notes pursuant to which all obligations of Xilinx under the Assumed Xilinx Notes are unconditionally guaranteed on a senior unsecured basis by us. The indentures governing the Assumed Xilinx Notes also contain various covenants which limit our ability to, among other things, create certain liens on principal property or the capital stock of certain subsidiaries, enter into certain sale and leaseback transactions with respect to principal property, and consolidate or merge with, or convey, transfer or lease all or substantially all our assets, taken as a whole, to another person.
We also have a five-year unsecured revolving credit facility in the aggregate principal amount of $3.0 billion (Revolving Credit Agreement). Our Revolving Credit Agreement contains various covenants which limit our ability to, among other things, incur liens and consolidate or merge or sell our assets as an entirety or substantially as an entirety (in each case, except for certain customary exceptions). In addition, our Revolving Credit Agreement requires us to maintain a minimum consolidated interest coverage ratio at the end of each fiscal quarter. The agreements governing our notes and our Revolving Credit Agreement contain cross-default provisions whereby a default under certain agreements with respect to other indebtedness would result in cross defaults under the indentures or the Revolving Credit Agreement. For example, the occurrence of a default with respect to any indebtedness or any failure to repay indebtedness when due in an amount in excess of (i) $50 million would cause a cross default under the indentures (to the extent such default would result in the acceleration of such indebtedness) governing our 2.125% Convertible Senior Notes due 2026 (2.125% Notes), and (ii) $500 million would cause a cross default under the Revolving Credit Agreement (to the extent such default (other than the failure to repay indebtedness) would result in the acceleration of such indebtedness). The occurrence of a default under any of these borrowing arrangements would permit the applicable note holders or the lenders under our Revolving Credit Agreement to declare all amounts outstanding under the indentures or the Revolving Credit Agreement to be immediately due and payable. If the note holders or the trustee under the indentures governing our 2.125% Notes or
33
the lenders under our Revolving Credit Agreement accelerate the repayment of borrowings, we cannot assure you that we will have sufficient assets to repay those borrowings.
Our indebtedness could adversely affect our financial position and prevent us from implementing our strategy or fulfilling our contractual obligations.
Our total debt principal amount outstanding as of December 31, 2022 was $2.5 billion. Our indebtedness may make it difficult for us to satisfy our financial obligations, including making scheduled principal and interest payments; limit our ability to borrow additional funds for working capital, capital expenditures, acquisitions and general corporate and other purposes; limit our ability to use our cash flow or obtain additional financing for future working capital, capital expenditures, acquisitions or other general corporate purposes; require us to use a substantial portion of our cash flow from operations to make debt service payments; place us at a competitive disadvantage compared to our competitors with relatively less debt; and increase our vulnerability to the impact of adverse economic and industry conditions.
We enter into sale and factoring arrangements from time to time with respect to certain accounts receivables, which arrangements are non-recourse to us in the event that an account debtor fails to pay for credit-related reasons, and are not included in our indebtedness. We could become obligated to repurchase such accounts receivables or otherwise incur liability to the counterparties under these arrangements under certain circumstances, such as where a commercial dispute arises between us and an account debtor.
We may not be able to generate sufficient cash to meet our working capital requirements. Also, if we cannot generate sufficient revenue and operating cash flow, we may face a cash shortfall and be unable to make all of our planned investments in research and development or other strategic investments.
Our ability to generate sufficient cash to meet our working capital requirements will depend on our financial and operating performance, which may fluctuate significantly from quarter to quarter, and is subject to prevailing economic, financial and business conditions along with other factors, many of which are beyond our control. We cannot assure you that we will be able to generate cash flow in amounts sufficient to enable us to meet our working capital requirements. If we are not able to generate sufficient cash flow from operations, we may be required to sell assets or equity, reduce expenditures, refinance all or a portion of our existing debt or obtain additional financing.
In addition, our ability to fund research and development expenditures depends on generating sufficient revenue and cash flow from operations and the availability of external financing, if necessary. Our research and development expenditures, together with ongoing operating expenses, will be a substantial drain on our cash flow and may decrease our cash balances. If new competitors, technological advances by existing competitors, or other competitive factors require us to invest significantly greater resources than anticipated in our research and development efforts, our operating expenses would increase. If we are required to invest significantly greater resources than anticipated in research and development efforts without an increase in revenue, our operating results could decline.
Our inability to generate sufficient cash from operations may require us to abandon projects or curtail planned investments in research and development or other strategic initiatives. If we curtail planned investments in research and development or abandon projects, our products may fail to remain competitive and our business would be materially adversely affected.
General Risks
Our worldwide operations are subject to political, legal and economic risks and natural disasters, which could have a material adverse effect on us.
We maintain operations around the world, including in the United States, Canada, Europe, Australia, Latin America and Asia. We rely on third-party wafer foundries in the United States, Europe and Asia. Nearly all product assembly and final testing of our products is performed at manufacturing facilities, operated by third-party manufacturing facilities, in China, Malaysia and Taiwan. We also depend on third-party subcontractors to provide shipment services. We also have international sales operations. International sales, as a percent of net revenue, were 66% for the year ended December 31, 2022. We expect that international sales will continue to be a significant portion of total sales in the foreseeable future.
34
The political, legal and economic risks associated with our operations in foreign countries include, without limitation: expropriation; changes in a specific country’s or region’s political or economic conditions; changes in tax laws, trade protection measures and import or export licensing requirements and restrictions; difficulties in protecting our intellectual property; difficulties in managing staffing and exposure to different employment practices and labor laws; changes in foreign currency exchange rates; restrictions on transfers of funds and other assets of our subsidiaries between jurisdictions; changes in freight rates; changes to macroeconomic conditions, including interest rates, inflation and recession; disruption in air transportation between the United States and our overseas facilities; loss or modification of exemptions for taxes and tariffs; and compliance with United States laws and regulations related to international operations, including export control and economic sanctions laws and regulations and the Foreign Corrupt Practices Act. Recently, the United States and other countries and coalitions have issued sanctions and revisions to export control and other regulations against Russia, Belarus or the DNR or LNR regions of Ukraine, due to the conflict in Ukraine. Also, geopolitical changes between China and Taiwan could disrupt the operations of our Taiwan based third-party wafer foundries, manufacturing facilities and subcontractors, and materially adversely affect our business, financial condition and/or operating results.
In addition, our worldwide operations (or those of our business partners) could be subject to natural disasters and climate change such as earthquakes, tsunamis, flooding, typhoons, droughts, fires, extreme heat and volcanic eruptions that disrupt our operations, or those of our manufacturers, vendors or customers. For example, our Santa Clara and San Jose operations are located near major earthquake fault lines in California. Also, we have operations and employees in regions that have experienced extreme weather such as prolonged heat waves, wildfires and freezing. Extreme weather events can also disrupt the ability of our suppliers to deliver expected manufacturing parts and/or services for periods of time. There may be conflict or uncertainty in the countries in which we operate, including public health issues (for example, an outbreak of a contagious disease such as COVID-19, avian influenza, measles or Ebola), safety issues, natural disasters, fire, disruptions of service from utilities, nuclear power plant accidents or general economic or political factors. For example, governments worldwide have implemented, and continue to implement, measures to slow down the outbreak of COVID-19. We have experienced, and will continue to experience, disruptions to our business as these measures have, and will continue to have, an effect on our business operations and practices.
In addition, many governments have enacted laws around personally identifiable information, such as the European Union’s general Data Protection Regulation and the California Consumer Privacy Act, and the failure to comply could result in sanctions or other actions by the governments. The European Union’s General Data Protection Regulation imposes significant requirements on how we collect, process and transfer personal data, as well as significant fines for non-compliance.
Any of the above risks, should they occur, could result in an increase in the cost of components, production and shipment delays, general business interruptions, the inability to obtain, or delays from difficulties in obtaining export licenses for certain technology, penalties or a loss of export privileges, as well as stringent licensing restrictions that may make our products less attractive to international customers, tariffs and other barriers and restrictions, longer payment cycles, increased taxes, restrictions on the repatriation of funds and the burdens of complying with a variety of foreign laws, any of which could ultimately have a material adverse effect on our business.
We may incur future impairments of our technology license purchases.
We license certain third-party technologies and tools for the design and production of our products. We report the value of those licenses as other non-current assets on the balance sheet and we periodically evaluate the carrying value of those licenses based on their future economic benefit to us. Factors such as the life of the assets, changes in competing technologies, and changes to the business strategy may represent an indicator of impairment. The occurrence of any of these events may require us to record future technology license impairment charges.
35
Our inability to continue to attract and retain qualified personnel may hinder our business.
Much of our future success depends upon the continued service of numerous qualified engineering, marketing, sales and executive employees. Competition for highly skilled executives and employees in the technology industry is intense and our competitors have targeted individuals in our organization that have desired skills and experience. If we are not able to continue to attract, train and retain our leadership team and our qualified employees necessary for our business, the progress of our product development programs could be hindered, and we could be materially adversely affected. To help attract, retain and motivate our executives and qualified employees, we use share-based incentive awards such as employee stock options and non-vested share units (restricted stock units). If the value of such stock awards does not appreciate as measured by the performance of the price of our common stock, or if our share-based compensation otherwise ceases to be viewed as a valuable benefit, our ability to attract, retain and motivate our executives and employees could be weakened, which could harm our results of operations. Also, if the value of our stock awards increases substantially, this could potentially create great personal wealth for our executives and employees and affect our ability to retain our personnel. In addition, any future restructuring plans may adversely impact our ability to attract and retain key employees.
Our stock price is subject to volatility.
Our stock price has experienced price and volume fluctuations and could be subject to wide fluctuations in the future. The trading price of our stock may fluctuate widely due to various factors including actual or anticipated fluctuations in our financial conditions and operating results, changes in financial estimates by us or financial estimates and ratings by securities analysts, changes in our capital structure, including issuance of additional debt or equity to the public, interest rate changes, inflation, news regarding our products or products of our competitors, and broad market and industry fluctuations. Stock price fluctuations could impact the value of our equity compensation, which could affect our ability to recruit and retain employees. In addition, volatility in our stock price could adversely affect our business and financing opportunities.
In May 2021, our Board of Directors approved a stock repurchase program of up to $4 billion of our common stock (Existing Repurchase Program). In February 2022, our Board of Directors approved a new stock repurchase program in addition to our Existing Repurchase Program to purchase up to $8 billion of our outstanding common stock in the open market (collectively referred to as the Repurchase Program). The Repurchase Program does not obligate us to acquire any common stock, has no termination date and may be suspended or discontinued at any time. Our stock repurchases could affect the trading price of our stock, the volatility of our stock price, reduce our cash reserves, and may be suspended or discontinued at any time, which may result in a decrease in our stock price.
Worldwide political conditions may adversely affect demand for our products.
Worldwide political conditions may create uncertainties that could adversely affect our business. The United States has been and may continue to be involved in armed conflicts that could have a further impact on our sales and our supply chain. The consequences of armed conflict, political instability or civil or military unrest are unpredictable, and we may not be able to foresee events that could have a material adverse effect on us. Terrorist attacks or other hostile acts may negatively affect our operations, or adversely affect demand for our products, and such attacks or related armed conflicts may impact our physical facilities or those of our suppliers or customers. Furthermore, these attacks or hostile acts may make travel and the transportation of our products more difficult and more expensive, which could materially adversely affect us. Any of these events could cause consumer spending to decrease or result in increased volatility in the United States economy and worldwide financial markets.
ITEM 1B. UNRESOLVED STAFF COMMENTS
None.
36
ITEM 2. PROPERTIES
As of December 31, 2022, we have 6 million square feet of space for research and development, engineering, administrative and warehouse use throughout the world. These facilities include 5 million square feet of leased space and 1 million square feet of owned space. Our headquarters are located in Santa Clara, California, and we have significant operations in Austin, Texas; San Jose, California; Shanghai, China; Markham, Ontario, Canada; Longmont, Colorado; Dublin, Ireland; Singapore; and Bangalore and Hyderabad, India. We also have a number of regional sales offices located in commercial centers near customers, principally in the United States, Europe, Asia and Latin America.
We currently do not anticipate difficulty in either retaining occupancy of any of our facilities through lease renewals prior to expiration or through month-to-month occupancy or replacing them with equivalent facilities. We believe that our existing facilities are suitable and adequate for our present purposes and that the productive capacity of such facilities is substantially being utilized or we have plans to utilize such capacity.
ITEM 3. LEGAL PROCEEDINGS
For a discussion of our legal proceedings, refer to Note 17 – Contingencies of the Notes to Consolidated Financial Statements (Part II, Item 8 of this Form 10-K).
ITEM 4. MINE SAFETY DISCLOSURES
Not Applicable.
37
PART II
ITEM 5. MARKET FOR REGISTRANT’S COMMON EQUITY, RELATED STOCKHOLDER MATTERS AND ISSUER PURCHASES OF EQUITY SECURITIES
Our common stock is listed on The NASDAQ Global Select Market (NASDAQ) under the symbol “AMD”. On February 22, 2023, there were 5,014 registered holders of our common stock, and the closing price of our common stock was $76.61 per share as reported on NASDAQ.
Issuer Purchases of Equity Securities
In May 2021, our Board of Directors approved a stock repurchase program of up to $4 billion of our common stock (Existing Repurchase Program). In February 2022, our Board of Directors approved a new stock repurchase program in addition to the Existing Repurchase Program to purchase up to additional $8 billion of our outstanding common stock in the open market (collectively referred to as the “Repurchase Program”). We expect to fund repurchases through cash generated from operations which have been strengthened by our strong operational results. Our Repurchase Program does not obligate us to acquire any common stock, has no termination date and may be suspended or discontinued at any time.
The following table provides information relating to our repurchase of common stock for the year ended December 31, 2022:
| Total Number of Shares Repurchased | Average Price Paid per Share | Total Number of Shares Repurchased as Part of Publicly Announced Program | Maximum Dollar Value of Shares That May Yet be Purchased Under the Program | ||||||||||||||||||||
| (In millions) | |||||||||||||||||||||||
| Repurchases during each fiscal quarter of 2022: | |||||||||||||||||||||||
| December 26, 2021 - March 26, 2022 | 15,785,806 | $ | 121.03 | 15,785,806 | $ | 8,327 | |||||||||||||||||
| March 27, 2022 - June 25, 2022 | 10,159,900 | $ | 90.58 | 10,159,900 | $ | 7,407 | |||||||||||||||||
| June 26, 2022 - September 24, 2022 | 6,895,972 | $ | 89.52 | 6,895,972 | $ | 6,790 | |||||||||||||||||
| September 25, 2022 - December 31, 2022 | 3,484,459 | $ | 71.75 | 3,484,459 | $ | 6,540 | |||||||||||||||||
| 36,326,137 | 36,326,137 | ||||||||||||||||||||||
| Repurchases during last fiscal quarter of 2022: | |||||||||||||||||||||||
| September 25, 2022 - October 29, 2022 | — | $ | — | — | $ | 6,790 | |||||||||||||||||
| October 30, 2022 - November 26, 2022 | 1,455,994 | $ | 70.65 | 1,455,994 | $ | 6,687 | |||||||||||||||||
| November 27, 2022 - December 31, 2022 | 2,028,465 | $ | 72.54 | 2,028,465 | $ | 6,540 | |||||||||||||||||
| Total | 3,484,459 | 3,484,459 | |||||||||||||||||||||
Equity Award Share Withholding
Shares of common stock withheld as payment of withholding taxes in connection with the vesting or exercise of equity awards are also treated as common stock repurchases. Those withheld shares of common stock are not considered common stock repurchases under an authorized common stock repurchase plan. During fiscal year 2022, we withheld 5 million shares as payment of withholding taxes in connection with the vesting and exercise of equity awards.
For information about our equity compensation plans, see Part III, Item 11, below.
38
Performance Graph
Comparison of Five-Year Cumulative Total Returns
Advanced Micro Devices, S&P 500 Index and S&P 500 Semiconductor Index
The following graph shows a five-year comparison of cumulative total return on our common stock, the S&P 500 Index and the S&P 500 Semiconductor Index from December 30, 2017 through December 31, 2022. The past performance of our common stock is no indication of future performance.
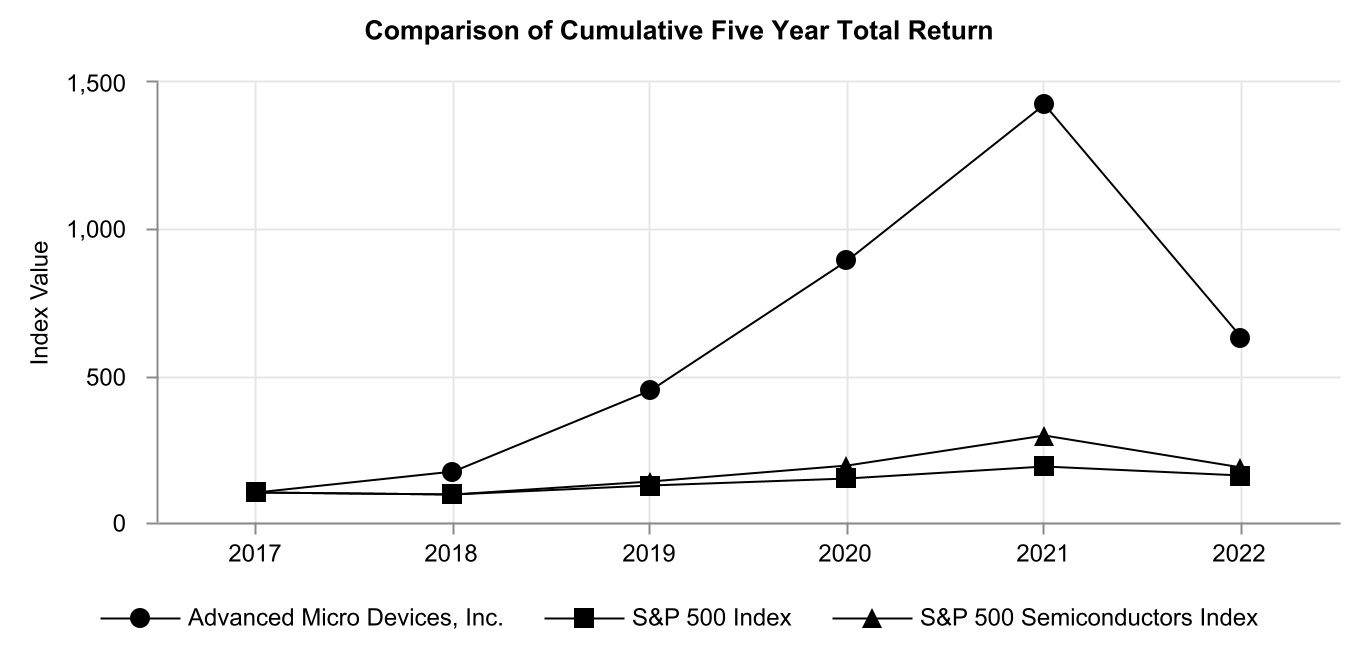
| Base Period | Years Ended | |||||||||||||||||||
| Company / Index | 12/30/2017 | 12/29/2018 | 12/28/2019 | 12/26/2020 | 12/25/2021 | 12/31/2022 | ||||||||||||||
| Advanced Micro Devices, Inc. | 100 | 173 | 449 | 893 | 1,422 | 630 | ||||||||||||||
| S&P 500 Index | 100 | 95 | 126 | 147 | 190 | 157 | ||||||||||||||
| S&P 500 Semiconductors Index | 100 | 93 | 138 | 193 | 296 | 185 | ||||||||||||||
Unregistered Sales of Equity Securities
On January 3, 2023, we issued warrants to purchase 300,260 shares of our common stock to a commercial partner pursuant to a strategic arrangement executed in 2018 with such partner. The warrants have an exercise price of $25.4994 per share and expire on January 3, 2026. The warrants were issued pursuant to Section 4(a)(2) of the Securities Act of 1933.
On February 9, 2023, we issued 27,230 shares of AMD’s common stock pursuant to an exercise in full by a commercial partner of warrants to purchase up to 42,260 shares of AMD’s common stock at an exercise price of $25.4994 per share (the Warrants). As a result, the Warrants are no longer outstanding. The commercial partner acquired the Warrants on March 30, 2020 and June 29, 2020 pursuant to a strategic arrangement with such partner. The shares of common stock were issued pursuant to Section 3(a)(9) of the Securities Act of 1933.
ITEM 6. [RESERVED]
39
ITEM 7. MANAGEMENT’S DISCUSSION AND ANALYSIS OF FINANCIAL CONDITION AND RESULTS OF OPERATIONS
The following discussion should be read in conjunction with the consolidated financial statements as of December 31, 2022 and December 25, 2021 and for each of the three years in the period ended December 31, 2022 and related notes, which are included in this Annual Report on Form 10-K as well as with the other sections of this Annual Report on Form 10-K, “Part II, Item 8: Financial Statements and Supplementary Data.”
Introduction
In this section, we will describe the general financial condition and the results of operations of Advanced Micro Devices, Inc. and its wholly-owned subsidiaries (collectively, “us,” “our” or “AMD”), including a discussion of our results of operations for 2022 compared to 2021, an analysis of changes in our financial condition and a discussion of our off-balance sheet arrangements. Discussions of 2020 items and year-to-year comparisons between 2021 and 2020 that are not included in this Form 10-K can be found in “Management’s Discussion and Analysis of Financial Condition and Results of Operations” in Part II, Item 7 of our Annual Report on Form 10-K for the fiscal year ended December 25, 2021.
Overview
2022 was a transformative year for AMD as we took several major steps that scaled and reshaped our business. In February 2022, we completed our strategic acquisition of Xilinx, Inc. (Xilinx) which expanded our technology and product portfolio to include adaptable hardware platforms that enable hardware acceleration and rapid innovation across a variety of technologies and established AMD in multiple embedded markets where we have traditionally not had a significant presence. We now offer Field Programmable Gate Arrays (FPGAs), Adaptive SoCs, and Adaptive Compute Acceleration Platform (ACAP) products. With the acquisition of Xilinx, we have access to a new set of markets and customers, further strengthening and diversifying our business model. In May 2022, we expanded our data center solutions capabilities with the acquisition of Pensando Systems, Inc. (Pensando). We now offer high-performance data processing units (DPUs) and a software stack that complements our existing products. With the Xilinx and Pensando acquisitions, we are well positioned to provide the industry’s broadest set of leadership compute engines and accelerators to help enable best performance, security, flexibility and total cost of ownership for leading-edge data centers.
Our 2022 financial results reflect the strength of our diversified business model despite the challenging PC market conditions in the second half of 2022. Net revenue for 2022 was $23.6 billion, an increase of 44% compared to 2021 net revenue of $16.4 billion. The increase in net revenue was driven by a 64% increase in Data Center segment revenue primarily due to higher sales of our EPYC™ server processors, a 21% increase in Gaming segment revenue primarily due to higher semi-custom product sales, and a significant increase in Embedded segment revenue from the prior year period driven by the inclusion of Xilinx embedded product sales. This growth was partially offset by a 10% decrease in Client segment revenue primarily due to lower processor shipments driven by a weak PC market and significant inventory correction actions across the PC supply chain. Gross margin, as a percentage of net revenue for 2022, was 45%, compared to 48% in 2021. The decrease in gross margin was primarily due to amortization of intangible assets associated with the Xilinx acquisition. Operating income for 2022 was $1.3 billion compared to operating income of $3.6 billion for 2021. The decrease in operating income was primarily driven by amortization of intangible assets associated with the Xilinx acquisition. Net income for 2022 was $1.3 billion compared to $3.2 billion in the prior year. The decrease in net income was primarily driven by lower operating income.
Cash, cash equivalents and short-term investments as of December 31, 2022 were $5.9 billion, compared to $3.6 billion at the end of 2021. Our aggregate principal amount of total debt as of December 31, 2022 was $2.5 billion, compared to $313 million as of December 25, 2021.
We took several actions in 2022 to strengthen our financial position. In June 2022, we issued $1.0 billion in aggregate principal amount of senior notes, consisting of $500 million in aggregate principal amount of 3.924% Senior Notes due 2032 (3.924% Notes) and $500 million in aggregate principal amount of 4.393% Senior Notes due 2052 (4.393% Notes). The 3.924% Notes will mature on June 1, 2032 and bear interest at a rate of 3.924% per annum, and the 4.393% Notes will mature on June 1, 2052 and bear interest at a rate of 4.393% per annum. The 3.924% Notes and the 4.393% Notes are senior unsecured obligations.
40
We also entered into a revolving credit agreement in June 2022. The agreement provides for a five-year unsecured revolving credit facility in the aggregate principal amount of $3.0 billion. There were no funds drawn from this facility during the year ended December 31, 2022. In November 2022, we established a new commercial paper program, under which we may issue unsecured commercial paper notes up to a maximum principal amount outstanding at any time of $3.0 billion with a maturity of up to 397 days from the date of issue. The commercial paper will be sold at a discount from par or, alternatively, will be sold at par and bear interest at rates that will vary based on market conditions at the time of issuance. As of December 31, 2022, we had no commercial paper outstanding.
During the twelve months ended December 31, 2022, we returned a total of $3.7 billion to shareholders through the repurchase of 36.3 million shares of common stock under our stock repurchase program. As of December 31, 2022, $6.5 billion remained available for future stock repurchases under this program. The repurchase program does not obligate us to acquire any common stock, has no termination date and may be suspended or discontinued at any time.
We continued executing our product technology roadmap by delivering a number of new leadership products and technologies during 2022. For Data Center, we launched our 4th Gen AMD EPYC™ processors with next-generation architecture, technology and features, and designed to deliver optimizations across market segments and applications, while helping businesses free data center resources to create additional workload processing and accelerate output. We also unveiled our 3rd Gen AMD EPYC processors with AMD 3D V-Cache technology for leadership performance in technical computing workloads. We introduced the 7 nm Versal™ ACAP VCK5000 development card designed to offer leadership AI inference performance. We announced the availability of the AMD Instinct™ ecosystem, the new AMD Instinct MI210 accelerator and ROCm™ 5 software. Together the AMD Instinct and ROCm ecosystem offers exascale-class technology to a broad base of high performance computing (HPC) and artificial intelligence (AI) customers, designed to address the demand for compute-accelerated data center workloads and reduce the time to insights and discoveries.
In the Embedded segment, we introduced the AMD Ryzen™ Embedded R2000 Series, second-generation mid-range system-on-chip processors optimized for a wide range of industrial and robotics systems, machine vision, IoT (Internet of Things) and thin-client equipment. We also introduced the Kria™ KR260 Robotics Starter Kit, the latest addition to the Kria portfolio. The kit enables rapid development of hardware-accelerated applications for robotics, machine vision and industrial communication and control.
For the Client segment, we introduced the Ryzen 7000 Series Desktop processors powered by the new “Zen 4” architecture for gamers, enthusiasts, and content creators. Along with the introduction of the Ryzen 7000 Series Desktop processors, we also unveiled the new Socket AM5 platform featuring four new chipsets. These new desktop processors are designed for gamers, enthusiasts, and content creators. We introduced AMD Ryzen 7000 Mobile processors with up to 16 “Zen 4” architecture cores. We also introduced the AMD Ryzen 6000 Series Mobile processors, built on “Zen 3+” architecture and includes AMD RDNA™ 2 architecture based on integrated graphics. We launched the AMD Ryzen 5000 C-Series processors bringing “Zen 3” architecture to premium Chrome OS devices for work and collaboration. The processors offer up to eight high performance x86 cores. For workstations, we introduced the new AMD Ryzen Threadripper™ PRO 5000 WX-Series workstation processors designed for professionals to run demanding workstation applications. We also introduced the AMD Ryzen PRO 7030 Series Mobile processors built on “Zen 3” core architecture.
In the Gaming segment, we unveiled the AMD Radeon™ RX 7900 XTX and the Radeon RX 7900 XT gaming graphics cards that are built on next-generation high performance, energy-efficient AMD RDNA™ 3 architecture. We announced new graphics cards to the AMD Radeon RX 6000 Series product line: the AMD Radeon RX 6950 XT, the AMD Radeon RX 6750 XT and the AMD Radeon RX 6650 XT. These new graphics cards are built on AMD RDNA 2 gaming architecture and GDDR6 memory at up to 18Gbps. We launched the new AMD Radeon PRO GPUs including the introduction of the AMD Radeon PRO W6400 graphics card built on AMD RDNA 2 architecture.
Although the current COVID-19 pandemic continues to impact our business operations and practices, we experienced limited disruptions during 2022. We continue to monitor our operations and public health measures implemented by governmental authorities in response to the pandemic.
We intend the discussion of our financial condition and results of operations that follows to provide information that will assist in understanding our financial statements, the changes in certain key items in those financial statements from period to period, the primary factors that resulted in those changes, and how certain accounting principles, policies and estimates affect our financial statements.
41
Critical Accounting Estimates
Our discussion and analysis of our financial condition and results of operations are based upon our consolidated financial statements, which have been prepared in accordance with U.S. generally accepted accounting principles (U.S. GAAP). The preparation of our financial statements requires us to make estimates and judgments that affect the reported amounts in our consolidated financial statements. We evaluate our estimates on an on-going basis, including those related to our revenue, inventories, business combination, goodwill, long-lived and intangible assets, and income taxes. We base our estimates on historical experience and on various other assumptions that we believe to be reasonable under the circumstances, the results of which form the basis for making judgments about the carrying values of assets and liabilities. Although actual results have historically been reasonably consistent with management’s expectations, the actual results may differ from these estimates or our estimates may be affected by different assumptions or conditions.
Management believes the following critical accounting estimates are the most significant to the presentation of our financial statements and require the most difficult, subjective and complex judgments.
Revenue Allowances. Revenue contracts with our customers include variable amounts which we evaluate under ASC 606-10-32-8 through 14 in order to determine the net amount of consideration to which we are entitled and which we recognize as revenue. We determine the net amount of consideration to which we are entitled by estimating the most likely amount of consideration we expect to receive from the customer after adjustments to the contract price for rights of return and rebates to our original equipment manufacturers (OEM) customers and rights of return, rebates and price protection on unsold merchandise to our distributor customers.
We base our determination of necessary adjustments to the contract price by reference to actual historical activity and experience, including actual historical returns, rebates and credits issued to OEM and distributor customers adjusted, as applicable, to include adjustments, if any, for known events or current economic conditions, or both.
Our estimates of necessary adjustments for distributor price incentives and price protection on unsold products held by distributors are based on actual historical incentives provided to distributor customers and known future price movements based on our internal and external market data analysis.
Our estimates of necessary adjustments for OEM price incentives utilize, in addition to known pricing agreements, actual historical rebate attainment rates and estimates of future OEM rebate program attainment based on internal and external market data analysis.
We offer incentive programs through cooperative advertising and marketing promotions. Where funds provided for such programs can be estimated, we recognize a reduction to revenue at the time the related revenue is recognized; otherwise, we recognize such reduction to revenue at the later of when: i) the related revenue transaction occurs; or ii) the program is offered. For transactions where we reimburse a customer for a portion of the customer’s cost to perform specific product advertising or marketing and promotional activities, such amounts are recognized as a reduction to revenue unless they qualify for expense recognition.
We also provide limited product return rights to certain OEMs and to most distribution customers. These return rights are generally limited to a contractual percentage of the customer’s prior quarter shipments, although, from time to time we may approve additional product returns beyond the contractual arrangements based on the applicable facts and circumstances. In order to estimate adjustments to revenue to account for these returns, including product restocking rights provided to distributor and OEM customers, we utilize relevant, trended actual historical product return rate information gathered, adjusted for actual known information or events, as applicable.
Overall, our estimates of adjustments to contract price due to variable consideration under our contracts with OEM and distributor customers, based on our assumptions and include adjustments, if any, for known events, have been materially consistent with actual results; however, these estimates are subject to management’s judgment and actual provisions could be different from our estimates and current provisions, resulting in future adjustments to our revenue and operating results.
42
Inventory Valuation. We value inventory at standard cost, adjusted to approximate the lower of actual cost or estimated net realizable value using assumptions about future demand and market conditions. Material assumptions we use to estimate necessary inventory carrying value adjustments can be unique to each product and are based on specific facts and circumstances. In determining excess or obsolescence reserves for products, we consider assumptions such as changes in business and economic conditions, other-than-temporary decreases in demand for our products, and changes in technology or customer requirements. In determining the lower of cost or net realizable value reserves, we consider assumptions such as recent historical sales activity and selling prices, as well as estimates of future selling prices. If in any period we anticipate a change in assumptions such as future demand or market conditions to be less favorable than our previous estimates, additional inventory write-downs may be required and would be reflected in cost of sales, resulting in a negative impact to our gross margin in that period. If in any period we are able to sell inventories that had been written down to a level below the ultimate realized selling price in a previous period, related revenue would be recorded with a lower or no offsetting charge to cost of sales resulting in a net benefit to our gross margin in that period. Overall, our estimates of inventory carrying value adjustments have been materially consistent with actual results.
Business Combinations. We allocate the fair value of purchase consideration to the tangible assets acquired, liabilities assumed, and intangible assets acquired based on their estimated fair values. The excess of the fair value of purchase consideration over the fair values of these identifiable assets and liabilities is recorded as goodwill. Such valuations require management to make significant estimates and assumptions, especially with respect to intangible assets. Significant estimates in valuing developed technology, in-process research and development, customer relationships and other identifiable intangible assets include, but are not limited to, expected future revenue growth rates and margins, future changes in technology, time to recreate customer relationships, useful lives, and discount rates.
Management's estimates of fair value are based upon assumptions believed to be reasonable, but which are inherently uncertain and unpredictable and, as a result, actual results may differ from estimates. Allocation of purchase consideration to identifiable assets and liabilities affects our amortization expense, as acquired finite-lived intangible assets are amortized over the useful life, whereas any indefinite lived intangible assets, including goodwill, are not amortized. During the measurement period, which is not to exceed one year from the acquisition date, we may record adjustments to the assets acquired and liabilities assumed, with the corresponding offset to goodwill. Upon the conclusion of the measurement period, any subsequent adjustments are recorded to earnings.
Goodwill. Goodwill is the excess of the aggregate of the consideration transferred over the identifiable assets acquired and liabilities assumed in connection with business combinations. Our reporting units are at the operating segment level. Our goodwill is contained within three reporting units: Data Center, Gaming and Embedded.
We perform our goodwill impairment analysis as of the first day of the fourth quarter of each year and, if certain events or circumstances indicate that an impairment loss may have been incurred, on a more frequent basis. The analysis may include both qualitative and quantitative factors to assess the likelihood of an impairment, which occurs when the carrying value of a reporting unit exceeds its fair value. Significant judgment is required in estimating the fair value of our reporting units to determine if the fair values of those units exceed their carrying values and an impairment to goodwill is required when a quantitative goodwill impairment test is performed. We typically obtain the assistance of third-party valuation specialists to help in determining the fair value of our reporting units. The fair values of our reporting units are estimated using a combination of the income approach, which requires estimating the present value of expected future cash flows of a reporting unit, and the market approach, which uses financial ratios of comparable companies to arrive at an estimated value for the reporting unit. Significant estimates and assumptions used in the income approach include assessments of macroeconomic conditions, growth rates of our reporting units in the near- and long-term, expectations of our ability to execute on our roadmap and projections, and the discount rate applied to cash flows. Significant estimates used in the market approach include the identification of comparable companies for each reporting unit, the determination of an appropriate control premium that a market participant would apply to a reporting unit, and the determination of appropriate multiples to apply to a reporting unit based on adjustments and consideration of specific attributes of that reporting unit.
43
The most significant assumptions utilized in the determination of the estimated fair values of our reporting units are the sales and earnings growth rates (including long-term growth rates) and discount rates. Long-term growth rates are dependent on overall market growth rates, the competitive environment and inflation. As a result, long-term growth rates could be adversely impacted by a sustained deceleration in category growth or an increased competitive environment. Discount rates, which are consistent with a weighted average cost of capital that is likely to be expected by a market participant, are based upon industry required rates of return, including consideration of both debt and equity components of the capital structure. Our discount rates may be impacted by adverse changes in the macroeconomic environment, prolonged and continuing inflationary pressures, volatility in the equity and debt markets and other factors that otherwise create or exacerbate risks in our reporting units. Changes in operating plans or adverse changes in the business or in the macroeconomic environment in the future could reduce the underlying cash flows used to estimate fair values and could result in a decline in fair value that would trigger future impairment charges of our reporting units’ goodwill. Based on our annual impairment testing, the fair values of all of our reporting units exceeded their carrying values.
Long-Lived and Intangible Assets. Long-lived and intangible assets to be held and used are reviewed for impairment if indicators of potential impairment exist and at least annually for indefinite-lived intangible assets. Impairment indicators are reviewed on a quarterly basis. Assets are grouped and evaluated for impairment at the lowest level of identifiable cash flows. When indicators of impairment exist and assets are held for use, we estimate future undiscounted cash flows attributable to the related asset groups. In the event such cash flows are not expected to be sufficient to recover the recorded value of the assets, the assets are written down to their estimated fair values based on the expected discounted future cash flows attributable to the asset group or based on appraisals. Factors affecting impairment of assets held for use include the ability of the specific assets to generate separately identifiable positive cash flows. When assets are removed from operations and held for sale, we estimate impairment losses as the excess of the carrying value of the assets over their fair value. Market conditions are among the factors affecting impairment of assets held for sale. Changes in any of these factors could necessitate impairment recognition in future periods for assets held for use or assets held for sale.
Income Taxes. In determining taxable income for financial statement reporting purposes, we must make certain estimates and judgments. These estimates and judgments are applied in the calculation of certain tax liabilities and in the determination of the recoverability of deferred tax assets which arise from temporary differences between the recognition of assets and liabilities for tax and financial statement reporting purposes.
We regularly assess the likelihood that we will be able to recover our deferred tax assets. Unless recovery is considered more-likely-than-not (a probability level of more than 50%), we will record a charge to income tax expense in the form of a valuation allowance for the deferred tax assets that we estimate will not ultimately be recoverable or maintain the valuation allowance recorded in prior periods. When considering all available evidence, if we determine it is more-likely-than-not we will realize our deferred tax assets, we will reverse some or all of the existing valuation allowance, which would result in a credit to income tax expense and the establishment of an asset in the period of reversal.
In determining the need to establish or maintain a valuation allowance, we consider the four sources of jurisdictional taxable income: (i) carryback of net operating losses to prior years; (ii) future reversals of existing taxable temporary differences; (iii) viable and prudent tax planning strategies; and (iv) future taxable income exclusive of reversing temporary differences and carryforwards.
Through the end of 2022, we continue to maintain a valuation allowance of approximately $2.1 billion for certain federal, state, and foreign tax attributes. The federal valuation allowance maintained is due to limitations, under Internal Revenue Code Section 382 or 383, separate return loss year rules, or dual consolidated loss rules. Certain state and foreign valuation allowances are maintained due to a lack of sufficient sources of future taxable income.
In addition, the calculation of our tax liabilities involves addressing uncertainties in the application of complex, multi-jurisdictional tax rules and the potential for future adjustment of our uncertain tax positions by the Internal Revenue Service or other taxing authorities.
44
Results of Operations
During the second quarter of fiscal year 2022, we changed our reporting segments to align our financial reporting with how we manage our business in strategic end markets. This is consistent with how our Chief Operating Decision Maker (CODM) assesses our financial performance and allocates resources. As a result, we report our financial performance based on the following four reportable segments: Data Center, Client, Gaming, and Embedded.
Additional information on our reportable segments is contained in Note 4 – Segment Reporting of the Notes to Financial Statements (Part II, Item 8 of this Form 10-K).
Our operating results tend to vary seasonally. Historically, our net revenue has been generally higher in the second half of the year than in the first half of the year, although market conditions and product transitions could impact these trends.
The following table provides a summary of net revenue and operating income (loss) by segment for 2022 and 2021:
| Year Ended | |||||||||||
| December 31, 2022 |
December 25, 2021 |
||||||||||
| (In millions) | |||||||||||
| Net revenue: | |||||||||||
| Data Center | $ | 6,043 | $ | 3,694 | |||||||
| Client | 6,201 | 6,887 | |||||||||
| Gaming | 6,805 | 5,607 | |||||||||
| Embedded | 4,552 | 246 | |||||||||
| Total net revenue | $ | 23,601 | $ | 16,434 | |||||||
| Operating income (loss): | |||||||||||
| Data Center | $ | 1,848 | $ | 991 | |||||||
| Client | 1,190 | 2,088 | |||||||||
| Gaming | 953 | 934 | |||||||||
| Embedded | 2,252 | 44 | |||||||||
| All Other | (4,979) | (409) | |||||||||
| Total operating income (loss) | $ | 1,264 | $ | 3,648 | |||||||
Data Center
Data Center net revenue of $6 billion in 2022 increased by 64%, compared to net revenue of $3.7 billion in 2021. The increase was primarily driven by higher sales of our EPYC server processors.
Data Center operating income was $1.8 billion in 2022, compared to operating income of $991 million in 2021. The increase in operating income was primarily driven by higher revenue, partially offset by higher operating expenses. Operating expenses increased for the reasons outlined under “Expenses” below.
Client
Client net revenue of $6.2 billion in 2022 decreased by 10%, compared to net revenue of $6.9 billion in 2021, primarily driven by a 24% decrease in unit shipment, partially offset by a 19% increase in average selling price. The decrease in unit shipments was due to challenging PC market conditions and significant inventory correction across the PC supply chain experienced during the second half of 2022. The increase in average selling price was primarily driven by a richer mix of Ryzen mobile processor sales.
Client operating income was $1.2 billion in 2022, compared to operating income of $2.1 billion in 2021. The decrease in operating income was primarily driven by lower revenue and higher operating expenses. Operating expenses increased for the reasons outlined under “Expenses” below.
45
Gaming
Gaming net revenue of $6.8 billion in 2022 increased by 21%, compared to net revenue of $5.6 billion in 2021. The increase in net revenue was driven by higher semi-custom product sales due to higher demand for gaming console SoCs, partially offset by lower gaming graphics sales due to a decrease in unit shipments driven by soft consumer demand given weakened macroeconomic conditions experienced in the second half of 2022.
Gaming operating income was $953 million in 2022, compared to operating income of $934 million in 2021. The increase in operating income was primarily driven by higher revenue, partially offset by higher operating expenses. Operating expenses increased for the reasons outlined under “Expenses” below.
Embedded
Embedded net revenue of $4.6 billion in 2022 increased significantly, compared to net revenue of $246 million in 2021. The significant increase in net revenue was primarily driven by the inclusion of Xilinx embedded product revenue as a result of the acquisition of Xilinx in February 2022.
Embedded operating income was $2.3 billion in 2022, compared to operating income of $44 million in 2021. The significant increase in operating income was primarily driven by the inclusion of Xilinx embedded product revenue.
All Other
All Other operating loss of $5.0 billion in 2022 primarily consisted of $3.5 billion of amortization of acquisition-related intangibles, $1.1 billion of stock-based compensation expense, and $452 million of acquisition-related costs, which primarily include transaction costs, amortization of Xilinx inventory fair value step-up adjustment, and depreciation related to the Xilinx fixed assets fair value step-up adjustment, certain compensation charges related to the acquisitions of Xilinx and Pensando, and licensing gain. All Other operating loss of $409 million in 2021 primarily consisted of $379 million of stock-based compensation expense and $42 million of acquisition-related costs.
Comparison of Gross Margin, Expenses, Licensing Gain, Interest Expense, Other Income (Expense) and Income Taxes
The following is a summary of certain consolidated statement of operations data for 2022 and 2021:
| December 31, 2022 | December 25, 2021 | ||||||||||
| (In millions, except for percentages) | |||||||||||
| Net revenue | $ | 23,601 | $ | 16,434 | |||||||
| Cost of sales | 11,550 | 8,505 | |||||||||
| Amortization of acquisition-related intangibles | 1,448 | — | |||||||||
| Gross profit | 10,603 | 7,929 | |||||||||
| Gross margin | 45 | % | 48 | % | |||||||
| Research and development | 5,005 | 2,845 | |||||||||
| Marketing, general and administrative | 2,336 | 1,448 | |||||||||
| Amortization of acquisition-related intangibles | 2,100 | — | |||||||||
| Licensing gain | (102) | (12) | |||||||||
| Interest expense | (88) | (34) | |||||||||
| Other income, net | 8 | 55 | |||||||||
| Income tax provision (benefit) | (122) | 513 | |||||||||
Gross Margin
Gross margin as a percentage of net revenue was 45% in 2022 compared to 48% in 2021. The decrease in gross margin was primarily due to amortization of intangible assets associated with the Xilinx acquisition.
46
Expenses
Research and Development Expenses
Research and development expenses of $5.0 billion in 2022 increased by $2.2 billion, or 76%, compared to $2.8 billion in 2021. The increase was primarily driven by strategic investments across all of our segments, including an increase in headcount through acquisitions and organic growth.
Marketing, General and Administrative Expenses
Marketing, general and administrative expenses of $2.3 billion in 2022 increased by $888 million, or 61%, compared to $1.4 billion in 2021. The increase was primarily due to an increase in headcount through acquisitions and organic growth, go-to-market activities, and acquisition-related costs.
Amortization of Acquisition-Related Intangibles
In 2022, cost of sales and operating expense included $1.4 billion and $2.1 billion, respectively, of amortization expense from intangible assets acquired as a result of the acquisitions of Xilinx and Pensando.
Licensing Gain
During 2022, we recognized $102 million of licensing gain from milestone achievement and royalty income associated with the licensed IP to the THATIC JV, our two joint ventures with Higon Information Technology Co., Ltd., a third-party Chinese entity. We recognized a licensing gain from royalty income of $12 million for the year ended December 25, 2021.
Interest Expense
Interest expense of $88 million in 2022 increased by $54 million compared to $34 million in 2021, primarily due to interest expense from the 2.95% Senior Notes due 2024 and the 2.375% Senior Notes due 2030 (together, the Assumed Xilinx Notes) and the 3.924% Notes and 4.393% Notes issued in 2022.
Other Income (Expense), net
Other income (expense), net is primarily comprised of interest income from short-term investments, changes in valuation of equity investments and foreign currency transaction gains and losses.
Other income, net was $8 million in 2022 compared to $55 million of Other income, net in 2021. The change was primarily due to a $62 million decrease in the fair value of equity investments in 2022 compared to an increase in fair value of $56 million from equity investments in 2021, partially offset by $65 million of interest income driven mainly by rising interest rates in 2022 compared to losses from conversion of our convertible debt of $7 million in 2021.
Income Tax Provision (Benefit)
We recorded an income tax benefit of $122 million in 2022 and an income tax provision of $513 million in 2021, representing effective tax rates of (10%) and 14%, respectively. The reduction in income tax expense in 2022 was primarily due to the lower pre-tax income coupled with a $261 million foreign-derived intangible income tax benefit and $241 million of research and development tax credits.
Through the end of fiscal year 2022, we continued to maintain a valuation allowance of approximately $2.1 billion for certain federal, state, and foreign tax attributes. The federal valuation allowance maintained is due to limitations under Internal Revenue Code Section 382 or 383, separate return loss year rules, or dual consolidated loss rules. Certain state and foreign valuation allowance maintained is due to lack of sufficient sources of future taxable income.
International Sales
International sales as a percentage of net revenue were 66% in 2022 and 72% in 2021. We expect that international sales will continue to be a significant portion of total sales in the foreseeable future. Substantially all of our sales transactions are denominated in U.S. dollars.
47
FINANCIAL CONDITION
Liquidity and Capital Resources
As of December 31, 2022, our cash, cash equivalents and short-term investments were $5.9 billion compared to $3.6 billion as of December 25, 2021. The increase in cash, cash equivalents and short-term investments was primarily driven by the $2.4 billion of cash and $1.6 billion of short-term investments acquired from the Xilinx acquisition, $1.0 billion from the debt issuance of our 3.924% Notes and 4.393% Notes, and cash flows from operations, partially offset by stock repurchases and cash paid for the acquisition of Pensando. The percentage of cash and cash equivalents held domestically was 73% as of December 31, 2022, and 91% as of December 25, 2021.
Our operating, investing and financing cash flow activities for 2022 and 2021 were as follows:
| December 31, 2022 | December 25, 2021 | ||||||||||
| (In millions) | |||||||||||
| Net cash provided by (used in): | |||||||||||
| Operating activities | $ | 3,565 | $ | 3,521 | |||||||
| Investing activities | 1,999 | (686) | |||||||||
| Financing activities | (3,264) | (1,895) | |||||||||
| Net increase in cash and cash equivalents | $ | 2,300 | $ | 940 | |||||||
Our aggregate principal debt obligations were $2.5 billion as of December 31, 2022, which consisted primarily of $1.5 billion of the Xilinx Notes assumed as part of the Xilinx acquisition and $1.0 billion of 3.924% Notes and 4.393% Notes issued during the year, compared to $313 million as of December 25, 2021, respectively. We repaid $312 million of our 7.50% Senior Notes that matured in August 2022.
On April 29, 2022, we entered into a revolving credit agreement (Revolving Credit Agreement) with Wells Fargo Bank, N.A. as administrative agent and other banks identified therein as lenders. The Revolving Credit Agreement provides for a five-year unsecured revolving credit facility in the aggregate principal amount of $3.0 billion. There were no funds drawn from this facility during the year ended December 31, 2022.
On November 3, 2022, we established a new commercial paper program where we may issue unsecured commercial paper notes up to a maximum principal amount outstanding at any time of $3.0 billion with a maturity of up to 397 days from the date of issue. The commercial paper will be sold at a discount from par or, alternatively, will be sold at par and bear interest at rates that will vary based on market conditions at the time of issuance. As of December 31, 2022, we had no commercial paper outstanding.
As of December 31, 2022, we had unconditional purchase commitments of approximately $8.6 billion, of which $6.5 billion are in fiscal year 2023. On an ongoing basis, we work with our suppliers on the timing of payments and deliveries of purchase commitments, taking into account business conditions.
We believe our cash, cash equivalents, short-term investments and cash flows from operations along with our Revolving Credit Facility and commercial paper program will be sufficient to fund operations, including capital expenditures and purchase commitments, over the next 12 months and beyond. We believe we will be able to access the capital markets should we require additional funds. However, we cannot assure that such funds will be available on favorable terms, or at all.
Operating Activities
Our working capital cash inflows and outflows from operations consist primarily of cash collections from our customers, payments for inventory purchases and payments for employee-related expenditures.
48
Net cash provided by operating activities was $3.6 billion in 2022, primarily due to our net income of $1.3 billion in 2022, adjusted for non-cash adjustments of $4.1 billion and net cash outflows of $1.8 billion from changes in our operating assets and liabilities. The primary drivers of the changes in operating assets and liabilities included a $1.4 billion increase in inventories driven primarily by build of advanced process nodes to support the ramp of new products, a $1.1 billion increase in accounts receivable driven primarily by higher revenue in the fourth quarter of 2022 compared to the fourth quarter of 2021, and a $1.2 billion increase in prepaid expenses and other assets due primarily to prepayments under long-term supply agreements in 2022, offset by an $931 million increase in accounts payable primarily due to timing of payments to our suppliers, and a $546 million increase in accrued liabilities and other driven mainly by higher customer-related accruals.
Net cash provided by operating activities was $3.5 billion in 2021, primarily due to our higher net income of $3.2 billion in 2021, adjusted for non-cash adjustments of $1.1 billion and net cash outflows of $774 million from changes in our operating assets and liabilities. The primary drivers of the changes in operating assets and liabilities included a $640 million increase in accounts receivable driven primarily by $1.6 billion higher revenue in the fourth quarter of 2021 compared to the fourth quarter of 2020, a $556 million increase in inventories driven by our continued increase in product build in support of customer demand, and a $920 million increase in prepaid expenses and other assets due primarily to prepayments under long-term supply agreements in 2021, offset by an $801 million increase in accounts payable primarily due to timing of payments to our suppliers, and a $526 million increase in accrued liabilities and other, both of which were driven mainly by higher marketing accruals, and higher accrued annual employee incentives due to improved financial performance.
Investing Activities
Net cash provided by investing activities was $2 billion in 2022, which primarily consisted of higher cash provided by maturities of short-term investments of $4.3 billion and cash acquired as part of the acquisition of Xilinx of $2.4 billion, partially offset by higher cash used for purchases of short-term investments of $2.7 billion, cash used in the acquisition of Pensando of $1.5 billion and $450 million for purchases of property and equipment.
Net cash used in investing activities was $686 million in 2021, which primarily consisted of higher cash used for purchases of short-term investments of $2.1 billion and $301 million for purchases of property and equipment, partially offset by higher cash provided by maturities of short-term investments of $1.7 billion.
Financing Activities
Net cash used in financing activities was $3.3 billion in 2022, which primarily consisted of common stock repurchases of $3.7 billion under the Repurchase Program, higher repurchases to cover tax withholding on employee equity plans of $406 million and repayment of debt of $312 million, partially offset by proceeds from the issuance of debt of $991 million and higher proceeds from the issuance of common stock under our employee equity plans of $167 million.
Net cash used in financing activities was $1.9 billion in 2021, which primarily consisted of common stock repurchases of $1.8 billion under the Repurchase Program and higher repurchases to cover tax withholding on employee equity plans of $237 million, partially offset by higher proceeds from the issuance of common stock under our employee equity plans of $104 million.
Off-Balance Sheet Arrangements
As of December 31, 2022, we had no off-balance sheet arrangements.
49
ITEM 7A. QUANTITATIVE AND QUALITATIVE DISCLOSURE ABOUT MARKET RISK
Interest Rate Risk. Our exposure to market risk for changes in interest rates relates primarily to our investment portfolio and long-term debt. We usually invest our cash in investments with short maturities or with frequent interest reset terms. Accordingly, our interest income fluctuates with short-term market conditions. As of December 31, 2022, our investment portfolio consisted of fixed income instruments, time deposits and commercial paper. Our primary aim with our investment portfolio is to invest available cash while preserving principal and meeting liquidity needs. In accordance with our investment policy, we place investments with high credit quality issuers and limit the amount of credit exposure to any one issuer based upon the issuer's credit rating. These securities are subject to interest rate risk and will decrease in value if market interest rates increase. A hypothetical 50 basis-point (half percentage point) increase or decrease in interest rates compared to rates at December 31, 2022 would have affected the fair value of our cash equivalent and investment portfolio by approximately $2.9 million.
As of December 31, 2022, all of our outstanding long-term debt had fixed interest rates. Consequently, our exposure to market risk for changes in interest rates on reported interest expense and corresponding cash flows is minimal.
We will continue to monitor our exposure to interest rate risk.
Default Risk. We mitigate default risk in our investment portfolio by investing in only high credit quality securities and by constantly positioning our portfolio to respond to a significant reduction in a credit rating of any investment issuer or guarantor. Our portfolio includes investments in marketable debt securities with active secondary or resale markets to ensure portfolio liquidity. We are averse to principal loss and strive to preserve our invested funds by limiting default risk and market risk.
We actively monitor market conditions and developments specific to the securities and security classes in which we invest. We believe that we take a conservative approach to investing our funds in that we invest only in highly-rated debt securities with relatively short maturities and do not invest in securities which we believe involve a higher degree of risk. As of December 31, 2022, substantially all of our investments in debt securities were A-rated by at least one of the rating agencies. While we believe we take prudent measures to mitigate investment-related risks, such risks cannot be fully eliminated as there are circumstances outside of our control.
Foreign Exchange Risk. As a result of our foreign operations, we incur costs and we carry assets and liabilities that are denominated in foreign currencies, while sales of products are primarily denominated in U.S. dollars.
We maintain a foreign currency hedging strategy which uses derivative financial instruments to mitigate the risks associated with changes in foreign currency exchange rates. This strategy takes into consideration all of our exposures. We do not use derivative financial instruments for trading or speculative purposes.
The following table provides information about our foreign currency forward contracts as of December 31, 2022 and December 25, 2021. All of our foreign currency forward contracts mature within 18 months.
| December 31, 2022 | December 25, 2021 | ||||||||||||||||||||||||||||||||||
| Notional Amount |
Average Contract Rate |
Estimated Fair Value Gain (Loss) |
Notional Amount |
Average Contract Rate |
Estimated Fair Value Gain (Loss) |
||||||||||||||||||||||||||||||
| (In millions except contract rates) | |||||||||||||||||||||||||||||||||||
| Foreign currency forward contracts: | |||||||||||||||||||||||||||||||||||
| Chinese Renminbi | $ | 599 | 6.7848 | $ | (3) | $ | 360 | 6.5693 | $ | 6 | |||||||||||||||||||||||||
| Canadian Dollar | 607 | 1.3137 | (16) | 416 | 1.2646 | (6) | |||||||||||||||||||||||||||||
| Indian Rupee | 516 | 82.1493 | (9) | 162 | 77.3309 | 1 | |||||||||||||||||||||||||||||
| Taiwan Dollar | 207 | 29.1231 | (4) | 122 | 27.2725 | (1) | |||||||||||||||||||||||||||||
| Singapore Dollar | 259 | 1.3600 | 4 | 71 | 1.3489 | — | |||||||||||||||||||||||||||||
| Euro | 142 | 0.9334 | 1 | 47 | 0.8444 | (2) | |||||||||||||||||||||||||||||
| Pound Sterling | 88 | 0.8204 | (1) | 6 | 0.7317 | — | |||||||||||||||||||||||||||||
| Japanese Yen | 2 | 133.7593 | — | 1 | 114.3214 | — | |||||||||||||||||||||||||||||
| Australian Dollar | 1 | 1.4689 | — | — | 1.3809 | — | |||||||||||||||||||||||||||||
| Total | $ | 2,421 | $ | (28) | $ | 1,185 | $ | (2) | |||||||||||||||||||||||||||
50
ITEM 8. FINANCIAL STATEMENTS AND SUPPLEMENTARY DATA
Advanced Micro Devices, Inc.
Consolidated Statements of Operations
| Year Ended | |||||||||||||||||
| December 31, 2022 |
December 25, 2021 |
December 26, 2020 |
|||||||||||||||
| (In millions, except per share amounts) | |||||||||||||||||
| Net revenue | $ | $ | $ | ||||||||||||||
| Cost of sales | |||||||||||||||||
| Amortization of acquisition-related intangibles | |||||||||||||||||
| Total cost of sales | |||||||||||||||||
| Gross profit | |||||||||||||||||
| Research and development | |||||||||||||||||
| Marketing, general and administrative | |||||||||||||||||
| Amortization of acquisition-related intangibles | |||||||||||||||||
| Licensing gain | ( |
( |
|||||||||||||||
| Operating income | |||||||||||||||||
| Interest expense | ( |
( |
( |
||||||||||||||
| Other income (expense), net | ( |
||||||||||||||||
| Income before income taxes and equity income | |||||||||||||||||
| Income tax provision (benefit) | ( |
( |
|||||||||||||||
| Equity income in investee | |||||||||||||||||
| Net income | $ | $ | $ | ||||||||||||||
| Earnings per share | |||||||||||||||||
| Basic | $ | $ | $ | ||||||||||||||
| Diluted | $ | $ | $ | ||||||||||||||
| Shares used in per share calculation | |||||||||||||||||
| Basic | |||||||||||||||||
| Diluted | |||||||||||||||||
See accompanying notes to consolidated financial statements.
51
Advanced Micro Devices, Inc.
Consolidated Statements of Comprehensive Income
| Year Ended | |||||||||||||||||
| December 31, 2022 |
December 25, 2021 |
December 26, 2020 |
|||||||||||||||
| (In millions) | |||||||||||||||||
| Net income | $ | $ | $ | ||||||||||||||
| Other comprehensive income (loss) | |||||||||||||||||
| Net change in unrealized gains (losses) on cash flow hedges | ( |
( |
|||||||||||||||
| Total comprehensive income | $ | $ | $ | ||||||||||||||
See accompanying notes to consolidated financial statements.
52
Advanced Micro Devices, Inc.
Consolidated Balance Sheets
| December 31, 2022 |
December 25, 2021 |
||||||||||
| (In millions, except par value amounts) | |||||||||||
| ASSETS | |||||||||||
| Current assets: | |||||||||||
| Cash and cash equivalents | $ | $ | |||||||||
| Short-term investments | |||||||||||
| Accounts receivable, net | |||||||||||
| Inventories | |||||||||||
| Receivables from related parties | |||||||||||
| Prepaid expenses and other current assets | |||||||||||
| Total current assets | |||||||||||
| Property and equipment, net | |||||||||||
| Operating lease right-of-use assets | |||||||||||
| Goodwill | |||||||||||
| Acquisition-related intangibles | |||||||||||
| Investment: equity method | |||||||||||
| Deferred tax assets | |||||||||||
| Other non-current assets | |||||||||||
| Total assets | $ | $ | |||||||||
| LIABILITIES AND STOCKHOLDERS’ EQUITY | |||||||||||
| Current liabilities: | |||||||||||
| Accounts payable | $ | $ | |||||||||
| Payables to related parties | |||||||||||
| Accrued liabilities | |||||||||||
| Current portion of long-term debt, net | |||||||||||
| Other current liabilities | |||||||||||
| Total current liabilities | |||||||||||
| Long-term debt, net of current portion | |||||||||||
| Long-term operating lease liabilities | |||||||||||
| Deferred tax liabilities | |||||||||||
| Other long-term liabilities | |||||||||||
| Commitments and Contingencies (see Notes 16 and 17) | |||||||||||
| Stockholders’ equity: | |||||||||||
| Capital stock: | |||||||||||
Common stock, par value $ |
|||||||||||
| Additional paid-in capital | |||||||||||
Treasury stock, at cost (shares held: |
( |
( |
|||||||||
| Accumulated deficit | ( |
( |
|||||||||
| Accumulated other comprehensive loss | ( |
( |
|||||||||
| Total stockholders’ equity | |||||||||||
| Total liabilities and stockholders’ equity | $ | $ | |||||||||
See accompanying notes to consolidated financial statements.
53
Advanced Micro Devices, Inc.
Consolidated Statements of Stockholders’ Equity
| Year Ended | |||||||||||||||||
| December 31, 2022 |
December 25, 2021 |
December 26, 2020 |
|||||||||||||||
| (In millions) | |||||||||||||||||
| Capital stock | |||||||||||||||||
| Common stock | |||||||||||||||||
| Balance, beginning of period | $ | $ | $ | ||||||||||||||
| Issuance of common stock as consideration for acquisition | |||||||||||||||||
| Balance, end of period | $ | $ | $ | ||||||||||||||
| Additional paid-in capital | |||||||||||||||||
| Balance, beginning of period | $ | $ | $ | ||||||||||||||
| Common stock issued under employee equity plans | |||||||||||||||||
| Stock-based compensation | |||||||||||||||||
| Issuance of common stock to settle convertible debt | |||||||||||||||||
| Issuance of common stock as consideration for acquisition | |||||||||||||||||
| Fair value of replacement share-based awards related to acquisition | |||||||||||||||||
| Issuance of common stock warrants | |||||||||||||||||
| Balance, end of period | $ | $ | $ | ||||||||||||||
| Treasury stock | |||||||||||||||||
| Balance, beginning of period | $ | ( |
$ | ( |
$ | ( |
|||||||||||
| Repurchases of common stock | ( |
( |
|||||||||||||||
| Reissuance of treasury stock as consideration for acquisition | |||||||||||||||||
| Common stock repurchases for tax withholding on employee equity plans | ( |
( |
( |
||||||||||||||
| Balance, end of period | $ | ( |
$ | ( |
$ | ( |
|||||||||||
| Accumulated deficit | |||||||||||||||||
| Balance, beginning of period | $ | ( |
$ | ( |
$ | ( |
|||||||||||
| Cumulative effect of adoption of accounting standard | ( |
||||||||||||||||
| Net income | |||||||||||||||||
| Balance, end of period | $ | ( |
$ | ( |
$ | ( |
|||||||||||
| Accumulated other comprehensive income (loss) | |||||||||||||||||
| Balance, beginning of period | $ | ( |
$ | $ | |||||||||||||
| Other comprehensive income (loss) | ( |
( |
|||||||||||||||
| Balance, end of period | $ | ( |
$ | ( |
$ | ||||||||||||
| Total stockholders' equity | $ | $ | $ | ||||||||||||||
See accompanying notes to consolidated financial statements.
54
Advanced Micro Devices, Inc.
Consolidated Statements of Cash Flows
| Year Ended | |||||||||||||||||
| December 31, 2022 |
December 25, 2021 |
December 26, 2020 |
|||||||||||||||
| (In millions) | |||||||||||||||||
| Cash flows from operating activities: | |||||||||||||||||
| Net income | $ | $ | $ | ||||||||||||||
| Adjustments to reconcile net income to net cash provided by operating activities: | |||||||||||||||||
| Depreciation and amortization | |||||||||||||||||
| Stock-based compensation | |||||||||||||||||
| Amortization of debt discount and issuance costs | |||||||||||||||||
| Amortization of operating lease right-of-use assets | |||||||||||||||||
| Amortization of inventory fair value adjustment | |||||||||||||||||
| Loss on debt redemption, repurchase and conversion | |||||||||||||||||
| Loss on sale or disposal of property and equipment | |||||||||||||||||
| Deferred income taxes | ( |
( |
|||||||||||||||
| (Gains) losses on equity investments, net | ( |
( |
|||||||||||||||
| Other | ( |
( |
|||||||||||||||
| Changes in operating assets and liabilities: | |||||||||||||||||
| Accounts receivable, net | ( |
( |
( |
||||||||||||||
| Inventories | ( |
( |
( |
||||||||||||||
| Receivables from related parties | ( |
||||||||||||||||
| Prepaid expenses and other assets | ( |
( |
( |
||||||||||||||
| Payables to related parties | ( |
||||||||||||||||
| Accounts payable | ( |
||||||||||||||||
| Accrued liabilities and other | |||||||||||||||||
| Net cash provided by operating activities | |||||||||||||||||
| Cash flows from investing activities: | |||||||||||||||||
| Purchases of property and equipment | ( |
( |
( |
||||||||||||||
| Purchases of short-term investments | ( |
( |
( |
||||||||||||||
| Proceeds from maturity of short-term investments | |||||||||||||||||
| Cash received from acquisition of Xilinx | |||||||||||||||||
| Acquisition of Pensando, net of cash acquired | ( |
||||||||||||||||
| Other | ( |
( |
|||||||||||||||
| Net cash provided by (used in) investing activities | ( |
( |
|||||||||||||||
| Cash flows from financing activities: | |||||||||||||||||
| Proceeds from debt, net of issuance costs | |||||||||||||||||
| Repayment of debt | ( |
( |
|||||||||||||||
| Proceeds from sales of common stock through employee equity plans | |||||||||||||||||
| Repurchases of common stock | ( |
( |
|||||||||||||||
Common stock repurchases for tax withholding on employee equity plans |
( |
( |
( |
||||||||||||||
| Other | ( |
( |
|||||||||||||||
| Net cash (used in) provided by financing activities | ( |
( |
|||||||||||||||
| Net increase in cash and cash equivalents | |||||||||||||||||
| Cash and cash equivalents at beginning of year | |||||||||||||||||
| Cash and cash equivalents at end of year | $ | $ | $ | ||||||||||||||
55
|
Advanced Micro Devices, Inc.
Consolidated Statements of Cash Flows
| |||||||||||||||||
| Year Ended | |||||||||||||||||
| December 31, 2022 |
December 25, 2021 |
December 26, 2020 |
|||||||||||||||
| (In millions) | |||||||||||||||||
| Supplemental cash flow information: | |||||||||||||||||
| Cash paid during the year for: | |||||||||||||||||
| Interest | $ | $ | $ | ||||||||||||||
| Income taxes, net of refund | $ | $ | $ | ||||||||||||||
| Non-cash investing and financing activities: | |||||||||||||||||
| Purchases of property and equipment, accrued but not paid | $ | $ | $ | ||||||||||||||
| Issuance of common stock to settle convertible debt | $ | $ | $ | ||||||||||||||
| Issuance of common stock and treasury stock for the acquisition of Xilinx | $ | $ | $ | ||||||||||||||
| Fair value of replacement share-based awards related to acquisition of Xilinx | $ | $ | $ | ||||||||||||||
| Transfer of assets for the acquisition of property and equipment | $ | $ | $ | ||||||||||||||
| Non-cash activities for leases: | |||||||||||||||||
| Operating lease right-of-use assets acquired by assuming related liabilities | $ | $ | $ | ||||||||||||||
See accompanying notes to consolidated financial statements.
56
Advanced Micro Devices, Inc.
Notes to Consolidated Financial Statements
NOTE 1 – The Company
Advanced Micro Devices, Inc. is a global semiconductor company. References herein to AMD or the Company mean Advanced Micro Devices, Inc. and its consolidated subsidiaries. AMD’s products include x86 microprocessors (CPUs) and graphics processing units (GPUs), as standalone devices or as incorporated into accelerated processing units (APUs), chipsets, data center and professional GPUs, embedded processors, semi-custom System-on-Chip (SoC) products, microprocessor and SoC development services and technology, data processing units (DPUs), Field Programmable Gate Arrays (FPGAs), and Adaptive SoC products. From time to time, the Company may also sell or license portions of its intellectual property (IP) portfolio.
On February 14, 2022 (the Xilinx Acquisition Date), the Company completed the acquisition of Xilinx, Inc. (Xilinx). On May 26, 2022 (the Pensando Acquisition Date), the Company completed the acquisition of Pensando Systems, Inc. (Pensando). See Note 5 - Business Combinations for additional information on these acquisitions.
NOTE 2 – Basis of Presentation and Significant Accounting Policies
Revenue Recognition
Revenue is recognized when a customer obtains control of promised goods or services and is recognized in an amount that reflects the consideration which the Company expects to receive in exchange for those goods or services. Sales, value-added, and other taxes collected concurrently with the provision of goods or services are excluded from revenue. Shipping and handling costs associated with product sales are included in cost of sales. Substantially all the Company’s revenue is derived from product sales, representing a single performance obligation.
Customers are generally required to pay for products and services within the Company’s standard contractual terms, which are typically net 30 to 60 days. The Company has determined that it does not have significant financing components in its contracts with customers.
Non-custom products
The Company transfers control and recognizes revenue when non-custom products are shipped to customers, which includes original equipment manufacturers (OEM) and distributors, in accordance with the shipping terms of the sale. Non-custom product arrangements generally comprise a single performance obligation. Certain OEMs may be entitled to rights of return and rebates under OEM agreements. The Company also sells to distributors under terms allowing the majority of distributors certain rights of return and price protection on unsold merchandise held by them. The Company estimates the amount of variable consideration under OEM and distributor arrangements and, accordingly, records a provision for product returns, allowances for price protection and rebates based on actual historical experience and any known events.
57
The Company offers incentive programs to certain customers, including cooperative advertising, marketing promotions, volume-based incentives and special pricing arrangements. Where funds provided for such programs can be estimated, the Company recognizes a reduction to revenue at the time the related revenue is recognized; otherwise, the Company recognizes such reduction to revenue at the later of when: i) the related revenue transaction occurs; or ii) the program is offered. For transactions where the Company reimburses a customer for a portion of the customer’s cost to perform specific product advertising or marketing and promotional activities, such amounts are recognized as a reduction to revenue unless they qualify for expense recognition.
Constraints of variable consideration have not been material.
Custom products
Custom products which are associated with the Company’s Gaming segment (semi-custom products), sold under non-cancellable purchases orders, for which the Company has an enforceable right to payment, and which have no alternative use to the Company at contract inception, are recognized as revenue, over the time of production of the products by the Company. The Company utilizes a cost-based input method, calculated as cost incurred plus estimated margin, to determine the amount of revenue to recognize for in-process, but incomplete, customer orders at a reporting date. The Company believes that a cost-based input method is the most appropriate manner to measure how the Company satisfies its performance obligations to customers because the effort and costs incurred best depict the Company’s satisfaction of its performance obligation.
Sales of semi-custom products are not subject to a right of return. Custom products arrangements generally involve a single performance obligation. There are no variable consideration estimates associated with custom products.
Development and intellectual property licensing agreements
From time to time, the Company may enter into arrangements with customers that combine the provision of development services and a license to the right to use the Company’s IP. These arrangements are deemed to be single or multiple performance obligations based upon the nature of the arrangements. Revenue is recognized upon the transfer of control, over time or at a point in time, depending on the nature of the arrangements. The Company evaluates whether the licensing component is distinct. A licensing component is distinct if it is both (i) capable of being distinct and (ii) distinct in the context of the arrangement. If the license is not distinct, it is combined with the development services as a single performance obligation and recognized over time. If the license is distinct, revenue is recognized at a point in time when the customer has the ability to benefit from the license.
From time to time, the Company may enter into arrangements with customers that solely involve the sale or licensing of its patents or IP. Generally, there are no performance obligations beyond transferring the designated license to the Company’s patents or IP. Accordingly, revenue is recognized at a point in time when the customer has the ability to benefit from the license.
There are no variable consideration estimates associated with either combined development and IP arrangements or for standalone arrangements involving either the sale or licensing of IP.
Inventories
The Company values inventory at standard cost, adjusted to approximate the lower of actual cost or estimated net realizable value using assumptions about future demand and market conditions. In determining excess or obsolescence reserves for its products, the Company considers assumptions such as changes in business and economic conditions, other-than-temporary decreases in demand for its products, and changes in technology or customer requirements. In determining the lower of cost or net realizable value reserves, the Company considers assumptions such as recent historical sales activity and selling prices, as well as estimates of future selling prices. The Company fully reserves for inventories and non-cancellable purchase orders for inventory deemed obsolete. The Company performs periodic reviews of inventory items to identify excess inventories on hand by comparing on-hand balances and non-cancellable purchase orders to anticipated usage using recent historical activity as well as anticipated or forecasted demand. If estimates of customer demand diminish further or market conditions become less favorable than those projected by the Company, additional inventory carrying value adjustments may be required.
58
Business Combinations
The Company is required to use the acquisition method of accounting for business combinations. The acquisition method of accounting requires the Company to allocate the purchase consideration to the assets acquired and liabilities assumed from the acquiree based on their respective fair values as of the acquisition date. The excess of the fair value of purchase consideration over the fair value of these assets acquired and liabilities assumed is recorded as goodwill. When determining the fair values of assets acquired and liabilities assumed, management makes significant estimates and assumptions, especially with respect to intangible assets. Critical estimates in valuing intangible assets include, but are not limited to, expected future revenue growth rates and margins, future changes in technology, time to recreate customer relationships, useful lives, and discount rates. Fair value estimates are based on the assumptions that management believes a market participant would use in pricing the asset or liability. These estimates are inherently uncertain and, therefore, actual results may differ from the estimates made. As a result, during the measurement period of up to one year from the acquisition date, the Company may record adjustments to the assets acquired and liabilities assumed with the corresponding offset to goodwill. Upon the conclusion of the measurement period or final determination of the fair value of the purchase price of an acquisition, whichever comes first, any subsequent adjustments are recorded in the Consolidated Statements of Operations.
Goodwill
The Company performs its goodwill impairment analysis as of the first day of the fourth quarter of each year and, if certain events or circumstances indicate that an impairment loss may have been incurred, on a more frequent basis. The analysis may include both qualitative and quantitative factors to assess the likelihood of an impairment.
The Company has the option to first perform qualitative testing to determine if it is more likely than not that the fair value of a reporting unit exceeds its carrying amount. Qualitative factors include industry and market considerations, overall financial performance, share price trends and market capitalization and Company-specific events. If the Company concludes it is more likely than not that the fair value of a reporting unit exceeds its carrying amount, the Company does not proceed to perform a quantitative impairment test.
If the Company concludes it is more likely than not that the fair value of a reporting unit is less than its carrying value or elects to bypass the qualitative test, a quantitative goodwill impairment test will be performed by comparing the fair value of each reporting unit to its carrying value. The Company’s quantitative impairment analysis uses a combination of the income approach, which requires estimates of the present value of expected future cash flows of a reporting unit, and the market approach, which uses financial ratios of comparable companies to arrive at an estimated value for the reporting units. Significant estimates and assumptions used in the income approach include assessments of macroeconomic conditions, growth rates of reporting units in the near- and long-term, expectations of the Company’s ability to execute on roadmaps and projections, and the discount rate applied to cash flows. Significant estimates used in the market approach include the identification of comparable companies for each reporting unit, and the determination of the appropriate multiples to apply to a reporting unit based on adjustments and consideration of specific attributes of that reporting unit. If a reporting unit’s fair value is determined to be less than its carrying value, a goodwill impairment charge is recognized for the amount by which the reporting unit’s fair value is less than its carrying value, not to exceed the total amount of goodwill allocated to that reporting unit.
Long-Lived and Intangible Assets
Long-lived and intangible assets to be held and used are reviewed for impairment if indicators of potential impairment exist and at least annually for indefinite-lived intangible assets. Impairment indicators are reviewed on a quarterly basis. Assets are grouped and evaluated for impairment at the lowest level of identifiable cash flows.
When indicators of impairment exist and assets are held for use, the Company estimates future undiscounted cash flows attributable to the related asset groups. In the event such cash flows are not expected to be sufficient to recover the recorded value of the assets, the assets are written down to their estimated fair values based on the expected discounted future cash flows attributable to the asset group or based on appraisals. Factors affecting impairment of assets held for use include the ability of the specific assets to generate separately identifiable positive cash flows.
When assets are removed from operations and held for sale, the Company estimates impairment losses as the excess of the carrying value of the assets over their fair value. Market conditions are among the factors affecting impairment of assets held for sale. Changes in any of these factors could necessitate impairment recognition in future periods for assets held for use or assets held for sale.
59
Accounts Receivable
Accounts receivable are primarily comprised of trade receivables presented net of rebates, price protection and an allowance for credit loss. Accounts receivable also include unbilled receivables, which primarily represent work completed on development services recognized as revenue but not yet invoiced to customers and semi-custom products under non-cancellable purchase orders that have no alternative use to the Company at contract inception, for which revenue has been recognized but not yet invoiced to customers. All unbilled accounts receivables are expected to be billed and collected within twelve months.
Investments
Available for Sale Debt Securities. The Company classifies its investments in debt securities at the date of acquisition as available-for-sale. Available-for-sale debt securities are reported at fair value with the related unrealized gains and losses included, net of tax, in accumulated other comprehensive income (loss), a component of stockholders’ equity. If an available-for-sale debt security’s fair value is less than its amortized cost basis, then the Company evaluates whether the decline is the result of a credit loss, in which case an impairment is recorded through an allowance for credit losses. Unrealized gains and losses not attributable to credit losses are included, net of tax, in accumulated other comprehensive income (loss), a component of stockholders’ equity. Classification of available-for-sale debt securities as current or non-current is based on the Company’s intent and belief in its ability to sell these securities and use the proceeds from sale in operations within 12 months.
Non-marketable Securities. The Company’s investments in non-marketable securities of privately-held companies are accounted for under the measurement alternative, defined as cost, less impairments, adjusted for subsequent observable price changes and are periodically assessed for impairment when events or circumstances indicate that a decline in value may have occurred. The Company's periodic assessment of impairment is made by considering available evidence, including the investee’s general market and industry conditions and product development status. The Company also assesses the investee’s ability to meet business milestones, its financial condition, and near-term prospects, including the rate at which the investee is using its cash, the investee’s need for possible additional funding at a lower valuation and any bona fide offer to purchase the investee.
Fair Value Measurements
The Company’s financial instruments are measured and recorded at fair value on a recurring basis, except for non-marketable equity investments in privately-held companies, which are generally accounted for under the measurement alternative.
Fair Value Hierarchy
The fair value framework requires the categorization of assets and liabilities into three levels based upon the assumptions (inputs) used to price the assets or liabilities. The guidance for fair value measurements requires that assets and liabilities carried at fair value be classified and disclosed in one of the following categories:
Level 1 — Quoted (unadjusted) prices in active markets for identical assets or liabilities.
Level 2 — Observable inputs other than quoted prices included in Level 1, such as quoted prices for similar assets or liabilities in active markets; quoted prices for identical or similar assets or liabilities in markets that are not active; or other inputs that are observable or can be corroborated by observable market data for substantially the full term of the asset or liability.
60
Property and Equipment
Property and equipment are stated at cost. Depreciation and amortization are provided on a straight-line basis over the estimated useful lives of one to 15 years for equipment, 34 to 44 years for buildings, and leasehold improvements are measured by the shorter of the remaining terms of the leases or the estimated useful economic lives of the improvements.
Leases
Operating and finance leases are recorded as right-of-use (ROU) assets and lease liabilities on the Company’s balance sheet. ROU assets represent the Company’s right to use an underlying asset for the lease term and lease liabilities represent the Company’s obligation to make lease payments arising from the lease. Operating and finance lease ROU assets and liabilities are initially recognized based on the present value of lease payments over the lease term. In determining the present value of lease payments, the Company uses the implicit interest rate if readily determinable. When the implicit interest rate is not readily determinable, the Company uses its incremental borrowing rate, which is based on its collateralized borrowing capabilities over a similar term of the lease payments. The Company utilizes the consolidated group incremental borrowing rate for all leases as the Company has centralized treasury operations. Lease expense for operating lease payments is recognized on a straight-line basis over the lease term. The Company has elected the accounting policy to not recognize ROU assets and lease liabilities that arise from short-term (12 months or less) leases for any class of underlying asset. Operating leases are included in operating lease ROU assets, other current liabilities, and long-term operating lease liabilities on the Company’s consolidated balance sheets. The Company’s finance leases are immaterial.
Foreign Currency Translation/Transactions
The functional currency of the majority of the Company’s foreign subsidiaries is the U.S. dollar. For certain foreign subsidiaries where the local currency is the functional currency, assets and liabilities are translated from foreign currencies into U.S. dollars. Gains or losses arising from translation of foreign currency denominated assets and liabilities (i.e., cumulative translation adjustment) are included as a component of accumulated other comprehensive income (loss) in stockholders' equity.
61
Stock-Based Compensation
The Company estimates stock-based compensation cost for stock options at the grant date based on the option’s fair value as calculated by the Black-Scholes model. For time-based restricted stock units (RSUs), fair value is based on the closing price of the Company’s common stock on the grant date. The Company estimates the grant-date fair value of RSUs that involve a market condition using the Monte Carlo simulation model. The Company estimates the grant-date fair value of stock to be issued under the Company’s Employee Stock Purchase plan (ESPP) using the Black-Scholes model. Compensation expense is recognized over the vesting period of the applicable award using the straight-line method, except for the compensation expense related to RSUs with performance or market conditions (PRSUs), which are recognized ratably for each vesting tranche from the service inception date to the end of the requisite service period. Forfeiture rates are estimated at the time of grant and revised, if necessary, in subsequent periods if actual forfeitures differ from those estimates.
Income Taxes
The Company computes the provision for income taxes using the liability method and recognizes deferred tax assets and liabilities for temporary differences between financial statement and income tax bases of assets and liabilities, as well as for operating loss and tax credit carryforwards. The Company measures deferred tax assets and liabilities using tax rates applicable to taxable income in effect for the years in which those tax assets are expected to be realized or settled and provides a valuation allowance against deferred tax assets when it cannot conclude that it is more likely than not that some or all deferred tax assets will be realized. The assessment requires significant judgment and is performed in each of the applicable taxing jurisdictions. In addition, the Company recognizes tax benefits from uncertain tax positions only if it is more likely than not that they will be sustained, based on the technical merits of the positions, on examination by the jurisdictional tax authority.
Global Intangible Low-Taxed Income (GILTI). In 2022, the Company elected to change its method of accounting for the United States GILTI tax from recording the tax impact in the period it is incurred to recognizing deferred taxes for temporary tax basis differences expected to reverse as GILTI tax in future years. The change is considered preferable based on the Company’s facts and circumstances as it provides better and more timely information of expected future income tax liabilities arising from temporary tax differences primarily associated with the Xilinx acquisition. As a result of the acquisition, the Company recorded $27.3 billion of identified intangible assets (refer to Note 5 - Business Combinations), of which $16.9 billion are related to foreign operations which will be amortized to income from operations over the assets’ estimated useful lives, but for which the Company will not receive a tax deduction under GILTI. This accounting policy change resulted in the recording of $857 million of deferred tax liabilities in connection with the Xilinx acquisition as disclosed in Note 14 - Income Taxes. In addition, for the year ended December 31, 2022, it resulted in a decrease in the income tax provision with a corresponding increase to net income of $296 million and an increase in basic and diluted earnings per share of $0.19, as compared to the computation under the previous accounting policy. This accounting policy change had no material impact on the Company’s historical consolidated financial statements.
62
NOTE 3 – Supplemental Financial Statement Information
Accounts Receivable, net
As of December 31, 2022 and December 25, 2021, Accounts receivable, net included unbilled accounts receivable of $1.1 billion and $329 million, respectively. Unbilled accounts receivables primarily represent work completed for development services and on custom products for which revenue has been recognized but not yet invoiced. All unbilled accounts receivable are expected to be billed and collected within 12 months.
Inventories |
December 31, 2022 |
December 25, 2021 |
|||||||||
| (In millions) | |||||||||||
| Raw materials | $ | $ | |||||||||
| Work in process | |||||||||||
| Finished goods | |||||||||||
| Total inventories | $ | $ | |||||||||
Property and Equipment, net |
December 31, 2022 |
December 25, 2021 |
|||||||||
| (In millions) | |||||||||||
| Land | $ | $ | |||||||||
| Building and leasehold improvements | |||||||||||
| Equipment | |||||||||||
| Construction in progress | |||||||||||
| Property and equipment, gross | |||||||||||
| Accumulated depreciation | ( |
( |
|||||||||
| Total property and equipment, net | $ | $ | |||||||||
Depreciation expense for 2022, 2021 and 2020 was $439 million, $296 million and $217 million, respectively.
Other Non-current Assets |
December 31, 2022 |
December 25, 2021 |
|||||||||
| (In millions) | |||||||||||
| Prepaid long-term supply agreements | $ | $ | |||||||||
| Software and technology licenses, net | |||||||||||
| Other | |||||||||||
| Total other non-current assets | $ | $ | |||||||||
Prepaid long-term supply agreements relate to payments made to vendors to secure long-term supply capacity.
63
Accrued Liabilities |
December 31, 2022 |
December 25, 2021 |
|||||||||
| (In millions) | |||||||||||
| Accrued marketing programs | $ | $ | |||||||||
| Accrued compensation and benefits | |||||||||||
| Customer program liabilities | |||||||||||
| Other accrued and current liabilities | |||||||||||
| Total accrued liabilities | $ | $ | |||||||||
Revenue
Revenue allocated to remaining performance obligations that are unsatisfied (or partially unsatisfied) include amounts received from customers and amounts that will be invoiced and recognized as revenue in future periods for development services, IP licensing and product revenue. As of December 31, 2022, the aggregate transaction price allocated to remaining performance obligations under contracts with an original expected duration of more than one year was $247 million, of which $213 million is expected to be recognized in the next 12 months. The revenue allocated to remaining performance obligations does not include amounts which have an original expected duration of one year or less.
Revenue recognized over time associated with custom products and development services accounted for approximately 24 %, 23 % and 18 % of the Company’s revenue in 2022, 2021 and 2020, respectively.
NOTE 4 – Segment Reporting
Management, including the Chief Operating Decision Maker (CODM), who is the Company’s Chief Executive Officer, reviews and assesses operating performance using segment net revenue and operating income (loss). These performance measures include the allocation of expenses to the reportable segments based on management’s judgment. In the second quarter of fiscal year 2022, the Company updated its segment reporting structure to align financial reporting with the manner in which the Company manages its business in strategic end markets. The Company’s disclosed measure of segment operating results has been updated consistent with the revised manner in which the Company’s CODM assesses the company’s financial performance and allocates resources. All prior-period segment data have been retrospectively adjusted.
The Company’s four reportable segments are:
•the Data Center segment, which primarily includes server CPUs and GPUs, DPUs, FPGAs and Adaptive SoC products for data centers;
•the Client segment, which primarily includes CPUs, accelerated processing units that integrate microprocessors and GPUs (APUs), and chipsets for desktop and notebook personal computers;
•the Gaming segment, which primarily includes discrete GPUs, semi-custom SoC products and development services; and
•the Embedded segment, which primarily includes embedded CPUs and GPUs, FPGAs, and Adaptive SoC products.
From time to time, the Company may also sell or license portions of its IP portfolio.
In addition to these reportable segments, the Company has an All Other category, which is not a reportable segment. This category primarily includes certain expenses and credits that are not allocated to any of the reportable segments because the CODM does not consider these expenses and credits in evaluating the performance of the reportable segments. This category primarily includes amortization of acquisition-related intangibles, employee stock-based compensation expense, acquisition-related costs and licensing gain.
64
The following table provides a summary of net revenue and operating income (loss) by segment for 2022, 2021 and 2020.
| Year Ended | |||||||||||||||||
| December 31, 2022 |
December 25, 2021 |
December 26, 2020 |
|||||||||||||||
| (In millions) | |||||||||||||||||
| Net revenue: | |||||||||||||||||
| Data Center | $ | $ | $ | ||||||||||||||
| Client | |||||||||||||||||
| Gaming | |||||||||||||||||
| Embedded | |||||||||||||||||
| Total net revenue | $ | $ | $ | ||||||||||||||
| Operating income (loss): | |||||||||||||||||
| Data Center | $ | $ | $ | ||||||||||||||
| Client | |||||||||||||||||
| Gaming | ( |
||||||||||||||||
| Embedded | ( |
||||||||||||||||
| All Other | ( |
( |
( |
||||||||||||||
| Total operating income (loss) | $ | $ | $ | ||||||||||||||
The following table provides items included in All Other category:
| Year Ended | |||||||||||||||||
| December 31, 2022 |
December 25, 2021 |
December 26, 2020 |
|||||||||||||||
| (In millions) | |||||||||||||||||
| Operating loss: | |||||||||||||||||
| Stock-based compensation expense | $ | $ | $ | ||||||||||||||
| Acquisition-related costs | |||||||||||||||||
| Amortization of acquisition-related intangibles | |||||||||||||||||
| Licensing gain | ( |
( |
|||||||||||||||
| Total operating loss | $ | $ | $ | ||||||||||||||
The Company does not discretely allocate assets to its operating segments, nor does management evaluate operating segments using discrete asset information.
The following table summarizes sales to external customers by geographic regions based on billing location of the customer:
| Year Ended | |||||||||||||||||
| December 31, 2022 |
December 25, 2021 |
December 26, 2020 |
|||||||||||||||
| (In millions) | |||||||||||||||||
| United States | $ | $ | $ | ||||||||||||||
| China (including Hong Kong) | |||||||||||||||||
| Japan | |||||||||||||||||
| Europe | |||||||||||||||||
| Taiwan | |||||||||||||||||
| Singapore | |||||||||||||||||
| Other countries | |||||||||||||||||
| Total sales to external customers | $ | $ | $ | ||||||||||||||
65
The following table summarizes sales to major customers that accounted for at least 10% of the Company’s consolidated net revenue for the respective years:
| Year Ended | |||||||||||||||||
| December 31, 2022 |
December 25, 2021 |
December 26, 2020 |
|||||||||||||||
| Customer A | % | % | * | ||||||||||||||
| Customer B | * | % | * | ||||||||||||||
* |
Less than 10% |
|||||||
Sales to customers A and B consisted of sales of products from the Gaming and Client segments, respectively.
The following table summarizes Property and equipment, net by geographic areas:
| December 31, 2022 |
December 25, 2021 |
||||||||||
| (In millions) | |||||||||||
| United States | $ | $ | |||||||||
| Canada | |||||||||||
| China | |||||||||||
| Singapore | |||||||||||
| India | |||||||||||
| Ireland | |||||||||||
| Other countries | |||||||||||
| Total property and equipment, net | $ | $ | |||||||||
NOTE 5 – Business Combinations
Pensando Acquisition
On May 26, 2022, the Company completed the acquisition of all issued and outstanding shares of Pensando, a leader in next-generation distributed computing, for a transaction valued at approximately $1.9 billion. The recorded purchase consideration of $1.7 billion is net of deferred cash compensation requiring future services and other customary closing adjustments. The acquisition of Pensando and its leading distributed services platform expands the Company’s ability to offer leadership solutions for cloud, enterprise, and edge customers.
66
The purchase consideration was preliminarily allocated as follows:
| (In millions) | |||||
| Cash and cash equivalents | $ | ||||
| Accounts receivable | |||||
| Inventory | |||||
| Prepaid expenses and other current assets | |||||
| Property and equipment | |||||
| Deferred tax assets | |||||
| Acquisition-related intangibles | |||||
| Total Assets |
|
||||
| Accounts payable | |||||
| Accrued and other liabilities | |||||
| Total Liabilities |
|
||||
| Fair value of net assets acquired | |||||
| Goodwill | |||||
| Total purchase consideration | $ |
|
|||
The Company allocated the purchase price to tangible and identified intangible assets acquired and liabilities assumed based on the preliminary estimates of their fair values, which were determined using generally accepted valuation techniques based on estimates and assumptions made by management. The fair values are subject to adjustment for up to one year after the close of the transaction as additional information is obtained. Any adjustments to the preliminary purchase price allocation identified during the measurement period are recognized in the period in which the adjustments are determined. Adjustments to the preliminary purchase price allocation since the completion of the acquisition resulted in an immaterial decrease to goodwill.
Goodwill arising from the Pensando acquisition was assigned to the Company’s Data Center segment. Goodwill was primarily attributed to expanded market opportunities expected to be achieved from the integration of Pensando. Goodwill is not expected to be deductible for income tax purposes.
67
Following are details of the purchase consideration allocated to acquired intangible assets:
| Fair Value | Weighted-average estimated useful life | ||||||||||
| (In millions) | (In years) | ||||||||||
Developed technology (1)
|
$ | ||||||||||
Customer relationships (2)
|
|||||||||||
Customer backlog (3)
|
|||||||||||
Product trademarks (4)
|
|||||||||||
| Identified intangible assets subject to amortization | |||||||||||
In-process research and development (IPR&D) not subject to amortization (5)
|
N/A | ||||||||||
| Total identified intangible assets acquired | $ | ||||||||||
1.The fair value of developed technology was determined using the income approach, specifically the multi-period excess earnings method.
2.Customer relationships represent the fair value of existing contractual relationships and customer loyalty determined based on existing relationships using the income approach, specifically the with and without method.
3.Customer backlog represents the fair value of non-cancellable customer contract orders using the income approach, specifically the multi-period excess earnings method.
4.Product trademarks primarily relate to the Pensando product-related trademarks, and the fair value was determined by applying the income approach, specifically the relief from royalty method.
5.The fair value of IPR&D was determined using the income approach, specifically the multi-period excess earnings method.
The fair value of the identified intangible assets subject to amortization are amortized over the assets’ estimated useful lives based on the pattern in which the economic benefits are expected to be received to cost of sales and operating expenses.
IPR&D consists of projects that have not yet reached technological feasibility as of the acquisition date. Accordingly, the Company recorded an indefinite-lived intangible asset of $220 million for the fair value of these projects, which will initially not be amortized. Instead, these projects will be tested for impairment annually and whenever events or changes in circumstances indicate that these projects may be impaired. Once the project reaches technological feasibility, the Company will begin to amortize the intangible assets over their estimated useful lives.
From the Pensando Acquisition Date to December 31, 2022, the Consolidated Statements of Operations include immaterial revenue and operating results attributable to Pensando, which are reported under the Data Center segment.
In 2022, Pensando acquisition-related costs of $102 million was recorded under Cost of sales, Research and development, and Marketing, general and administrative expenses on the Company’s Consolidated Statements of Operations. Acquisition-related costs are primarily comprised of direct transaction costs, fair value adjustments for acquired inventory and certain compensation charges. The Company may incur additional acquisition-related costs in the future related to the acquisition.
Xilinx Acquisition
On February 14, 2022, the Company completed the acquisition of all issued and outstanding shares of Xilinx, a leading provider of adaptive computing solutions, for a total purchase consideration of $48.8 billion ($46.4 billion, net of cash acquired of $2.4 billion). The acquisition of Xilinx expands the Company’s product portfolio to include adaptable hardware platforms that enable hardware acceleration and rapid innovation across a variety of technologies. With the acquisition of Xilinx, the Company now offers FPGAs, Adaptive SoC products and ACAP products. The purchase consideration consisted of $48.5 billion of fair value of 429 million shares of the Company’s common stock issued to Xilinx stockholders and $275 million of fair value of replacement equity awards attributable to services rendered pre-combination. As the transaction closed prior to the opening of markets on the Xilinx Acquisition Date, the fair value of the common stock issued to Xilinx stockholders was based on the closing price of the Company’s common stock on February 11, 2022 of $113.18 per share.
The financial results of Xilinx are included in the Company’s consolidated financial statements from the Xilinx Acquisition Date to December 31, 2022 and are reported under the Embedded and Data Center segments.
68
The purchase consideration was allocated as follows:
| (In millions) | |||||
| Cash and cash equivalents | $ | ||||
| Short-term investments | |||||
| Accounts receivable | |||||
| Inventories | |||||
| Prepaid expenses and other current assets | |||||
| Property and equipment | |||||
| Operating lease right-of-use assets | |||||
| Acquisition-related intangibles | |||||
| Deferred tax assets | |||||
| Other non-current assets | |||||
| Total Assets |
|
||||
| Accounts payable | |||||
| Accrued liabilities | |||||
| Other current liabilities | |||||
| Long-term debt | |||||
| Long-term operating lease liabilities | |||||
| Deferred tax liabilities | |||||
| Other long-term liabilities | |||||
| Total Liabilities |
|
||||
| Fair value of net assets acquired | |||||
| Goodwill | |||||
| Total purchase consideration | $ |
|
|||
The Company allocated the purchase price to tangible and identified intangible assets acquired and liabilities assumed based on the estimates of their fair values, which were determined using generally accepted valuation techniques based on estimates and assumptions made by management.
Goodwill arising from the acquisition of Xilinx was assigned to the Embedded and Data Center segments. Goodwill was primarily attributed to increased synergies expected to be achieved from the integration of Xilinx. Goodwill is not expected to be deductible for income tax purposes.
Following are details of the purchase consideration allocated to acquired intangible assets:
| Fair Value | Weighted-average estimated useful life | ||||||||||
| (In millions) | (In years) | ||||||||||
Developed technology (1)
|
$ | ||||||||||
Customer relationships (2)
|
|||||||||||
Customer backlog (3)
|
|||||||||||
Corporate trade name (4)
|
|||||||||||
Product trademarks (4)
|
|||||||||||
| Identified intangible assets subject to amortization | |||||||||||
In-process research and development (IPR&D) not subject to amortization (5)
|
N/A | ||||||||||
| Total identified intangible assets acquired | $ | ||||||||||
1.The fair value of developed technology was determined using the income approach, specifically, the multi-period excess earnings method.
2.Customer relationships represent the fair value of existing contractual relationships and customer loyalty determined based on existing relationships using the income approach, specifically the with and without method.
69
3.Customer backlog represents the fair value of non-cancellable customer contract orders using the income approach, specifically the multi-period excess earnings method.
4.Corporate trade name and product trademarks primarily relate to the Xilinx brand and product-related trademarks, respectively, and the fair values were determined by applying the income approach, specifically the relief from royalty method.
5.The fair value of IPR&D was determined using the income approach, specifically the multi-period excess earnings method.
The fair value of the identified intangible assets subject to amortization are amortized over the assets’ estimated useful lives based on the pattern in which the economic benefits are expected to be received to cost of sales and operating expenses.
IPR&D consists of projects that have not yet reached technological feasibility as of the acquisition date. Accordingly, the Company recorded an indefinite-lived intangible asset of $970 million for the fair value of these projects, which will initially not be amortized. Instead, these projects are tested for impairment annually and whenever events or changes in circumstances indicate that these projects may be impaired. Once the project reaches technological feasibility, the Company will begin to amortize the intangible assets over their estimated useful life.
The Company also assumed unvested restricted stock units with estimated fair value of $1.2 billion, of which $275 million was included as a component of the purchase consideration and $951 million will be recognized as expense subsequent to the acquisition.
The Consolidated Statements of Operations include the following revenue and operating income attributable to Xilinx in 2022:
| 2022 | |||||
| (In millions) | |||||
| Net revenue | $ | ||||
| Operating income | $ | ||||
Operating income attributable to Xilinx recorded under the Embedded and Data Center segments does not include $4.2 billion of amortization of acquisition-related intangibles, employee stock-based compensation expense and acquisition-related costs, which are recorded under the “All Other” segment.
In 2022, Xilinx acquisition-related costs of $350 million were recorded under Cost of sales, Research and development, and Marketing, general and administrative expenses on the Company’s Consolidated Statements of Operations. Acquisition-related costs are primarily comprised of direct transaction costs, fair value adjustments for acquired inventory and certain compensation charges. The Company may incur additional acquisition-related costs in the future related to the Xilinx acquisition.
Supplemental Unaudited Pro Forma Information
Following are the supplemental consolidated financial results of the Company, Xilinx and Pensando on an unaudited pro forma basis, as if the acquisitions had been consummated as of the beginning of the fiscal year 2021 (i.e., December 27, 2020).
| December 31, 2022 |
December 25, 2021 |
||||||||||
| (in millions) | |||||||||||
| Net revenue | $ | $ | |||||||||
| Net income | $ | $ | |||||||||
70
The Company’s fiscal year ends on the last Saturday in December of each year, Xilinx’s fiscal year ended on the Saturday nearest March 31 of each year and Pensando’s fiscal year ended on January 31 of each year. The unaudited pro forma information above is presented on the basis of the Company’s fiscal year and combines the historical results of the fiscal periods of the Company with the following historical results of Xilinx and Pensando: the twelve months ended December 31, 2022 includes Xilinx results for the twelve-month period beginning January 2, 2022 through December 31, 2022 and Pensando results for the twelve-month period beginning January 1, 2022 through December 31, 2022; and the twelve months ended December 25, 2021 includes Xilinx results for the twelve months ended January 1, 2022 and Pensando results for the twelve months ended December 31, 2021.
The unaudited pro forma financial information presented is for informational purposes only and is not necessarily indicative of the results of operations that would have been achieved if the Xilinx and Pensando acquisitions were completed at the beginning of fiscal year 2021 and are not indicative of the future operating results of the combined company. The pro forma results include adjustments related to purchase accounting, primarily amortization of acquisition-related intangible assets, fixed asset depreciation expense and expense from assumed stock-based compensation awards. The pro forma results also include amortization expense of acquired Xilinx inventory fair value step-up of $184 million in fiscal year 2021 and no Xilinx inventory fair value step-up expense in fiscal year 2022.
NOTE 6 – Acquisition-related Intangible Assets and Goodwill
Acquisition-related Intangible Assets
Acquisition-related intangibles as of December 31, 2022 were as follows:
| Weighted-average Remaining Useful Life | December 31, 2022 | |||||||||||||||||||
| Gross Carrying Amount | Accumulated Amortization | Net Carrying Amount | ||||||||||||||||||
| (In millions) | ||||||||||||||||||||
| Developed technology | $ | $ | ( |
$ | ||||||||||||||||
| Customer relationships | ( |
|||||||||||||||||||
| Customer backlog | ( |
|||||||||||||||||||
| Corporate trade name | ( |
|||||||||||||||||||
| Product trademarks | ( |
|||||||||||||||||||
| Identified intangible assets subject to amortization | ( |
|||||||||||||||||||
| IPR&D not subject to amortization | N/A | — | ||||||||||||||||||
| Total acquisition-related intangible assets | $ | $ | ( |
$ | ||||||||||||||||
Acquisition-related intangible asset balance as of December 25, 2021 was not material.
Acquisition-related intangible amortization expense was $3.5 billion in fiscal year 2022.
Based on the carrying value of acquisition-related intangibles recorded as of December 31, 2022, and assuming no subsequent impairment of the underlying assets, the estimated annual amortization expense for acquisition-related intangibles is expected to be as follows:
| Fiscal Year | (In millions) | ||||
| 2023 | $ | ||||
| 2024 | |||||
| 2025 | |||||
| 2026 | |||||
| 2027 | |||||
| 2028 and thereafter | |||||
| Total | $ | ||||
71
Goodwill
In the second quarter of fiscal year 2022, the Company reassigned goodwill balances among the updated reportable segments to reflect changes in its segment reporting structure. The Company performed a goodwill impairment test immediately prior to and after the segment change and determined that no indicators of impairment to goodwill existed.
The carrying amount of goodwill as of December 31, 2022 and December 25, 2021 was $24.2 billion and $289 million, respectively, and was assigned to reporting units within the following reportable segments:
| December 25, 2021 | Acquisitions | Adjustments and Reassignment due to segment change | December 31, 2022 | ||||||||||||||||||||
| (In millions) | |||||||||||||||||||||||
| Reportable segments before segment change: | |||||||||||||||||||||||
| Enterprise, Embedded and Semi-Custom | $ | $ | $ | ( |
$ | ||||||||||||||||||
| Xilinx | ( |
||||||||||||||||||||||
| Reportable segments after segment change: | |||||||||||||||||||||||
| Data Center | |||||||||||||||||||||||
| Gaming | |||||||||||||||||||||||
| Embedded | |||||||||||||||||||||||
| Total | $ | $ | $ | $ | |||||||||||||||||||
NOTE 7 – Related Parties—Equity Joint Ventures
ATMP Joint Ventures
The Company holds a 15 % equity interest in two joint ventures (collectively, the ATMP JV) with affiliates of Tongfu Microelectronics Co., Ltd, a Chinese joint stock company. The Company has no obligation to fund the ATMP JV. The Company accounts for its equity interests in the ATMP JV under the equity method of accounting due to its significant influence over the ATMP JV.
The ATMP JV provides assembly, test, mark and packaging (ATMP) services to the Company. The Company assists the ATMP JV in its management of certain raw material inventory. The purchases from and resales to the ATMP JV of inventory under the Company’s inventory management program are reported within purchases and resales with the ATMP JV and do not impact the Company’s consolidated statement of operations.
The Company’s purchases from the ATMP JV during 2022 and 2021 amounted to $1.7 billion and $1.1 billion, respectively. As of December 31, 2022 and December 25, 2021, the amounts payable to the ATMP JV were $463 million and $85 million, respectively, and are included in Payables to related parties on the Company’s consolidated balance sheets. The Company’s resales to the ATMP JV during 2022 and 2021 amounted to $15 million and $28 million, respectively. As of December 31, 2022 and December 25, 2021, the Company had receivables from ATMP JV of $2 million for each year, included in Receivables from related parties on the Company’s consolidated balance sheets.
During 2022, 2021 and 2020, the Company recorded gains of $14 million, $6 million and $5 million in Equity income in investee on its consolidated statement of operations, respectively. As of December 31, 2022 and December 25, 2021, the carrying value of the Company’s investment in the ATMP JV was approximately $83 million and $69 million, respectively.
THATIC Joint Ventures
The Company holds equity interests in two joint ventures (collectively, the THATIC JV) with Higon Information Technology Co., Ltd. (THATIC), a third-party Chinese entity. As of December 31, 2022 and December 25, 2021, the carrying value of the investment was zero.
72
NOTE 8 – Debt and Revolving Credit Facility
Debt
The Company’s total debt as of December 31, 2022 and December 25, 2021 consisted of:
| December 31, 2022 |
December 25, 2021 |
||||||||||
| (In millions) | |||||||||||
7.50% Senior Notes Due August 2022 (7.50% Notes) |
$ | $ | |||||||||
2.950% Senior Notes Due 2024 (Xilinx 2024 Notes) |
|||||||||||
2.125% Convertible Senior Notes Due 2026 (2.125% Notes) |
|||||||||||
2.375% Senior Notes Due 2030 (Xilinx 2030 Notes) |
|||||||||||
| Total debt (principal amount) | |||||||||||
| Unamortized debt discount and issuance costs | ( |
||||||||||
| Total debt (net) | |||||||||||
| Less: current portion of long-term debt | ( |
||||||||||
| Total long-term debt | $ | $ | |||||||||
In August 2022, the Company repaid its $312 million 7.50% Senior Notes.
Assumed Xilinx Notes
In connection with the acquisition of Xilinx, the Company assumed $1.5 billion in aggregate principal of Xilinx’s 2.95% Notes and 2.375% Notes (together, the Assumed Xilinx Notes) which were recorded at fair value as of the Xilinx Acquisition Date. The difference between the fair value at the Xilinx Acquisition Date and the principal outstanding of the Assumed Xilinx Notes is being amortized through interest expense over the remaining term of the debt. The Assumed Xilinx Notes are general unsecured senior obligations of the Company with semi-annual fixed interest payments due on June 1 and December 1. The indentures governing the Assumed Xilinx Notes contain various covenants which limit the Company’s ability to, among other things, create certain liens on principal property or the capital stock of certain subsidiaries, enter into certain sale and leaseback transactions with respect to principal property, and consolidate or merge with, or convey, transfer or lease all or substantially all of the Company’s assets to another person.
3.924% Senior Notes Due 2032 and 4.393% Senior Notes Due 2052
On June 9, 2022, the Company issued $1.0 billion in aggregate principal amount of 3.924 % Notes and 4.393 % Notes. The 3.924 % Notes and 4.393 % Notes are general unsecured senior obligations of the Company. The interest is payable semi-annually on June 1 and December 1 of each year, commencing on December 1, 2022. The 3.924 % and 4.393 % Notes are governed by the terms of an indenture dated June 9, 2022 between the Company and US Bank Trust Company, National Association as trustee. As of December 31, 2022, the outstanding aggregate principal amount of the 3.924 % Notes and 4.393 % Notes was $1.0 billion.
73
The Company may redeem some or all of the 3.924 % Notes and 4.393 % Notes prior to March 1, 2032 and December 1, 2051, respectively, at a price equal to the greater of the present value of the principal amount and future interest through the maturity of the 3.924 % Notes or 4.393 % Notes or 100% of the principal amount plus accrued and unpaid interest. Holders have the right to require the Company to repurchase all or a portion of the 3.924 % Notes or 4.393 % Notes in the event that the Company undergoes a change of control as defined in the indenture, at a repurchase price of 101% of the principal amount plus accrued and unpaid interest. Additionally, an event of default may result in the acceleration of the maturity of the 3.924 % Notes and 4.393 % Notes.
2.125% Notes
During 2022, activity on the 2.125% Notes was immaterial.
7.50% Senior Notes Due 2022
On August 15, 2012, the Company issued $500 million of its 7.50 % Senior Notes due 2022 (7.50 % Notes). These notes matured on August 15, 2022.
Future Payments on Total Debt
| Term Debt (Principal only) |
|||||
| Year | (In millions) | ||||
| 2023 | $ | ||||
| 2024 | |||||
| 2025 | |||||
| 2026 | |||||
| 2027 | |||||
| 2028 and thereafter | |||||
| Total | $ | ||||
Revolving Credit Facility
On April 29, 2022, the Company entered into a Credit Agreement (Revolving Credit Agreement) with Wells Fargo Bank, N.A. as administrative agent and the other banks identified therein as lenders. The Revolving Credit Agreement provides for a five-year revolving credit facility in an aggregate principal amount not to exceed $3.0 billion (subject to certain terms and conditions).
Revolving loans under the Revolving Credit Agreement can be Secure Overnight Financing Rate (SOFR) Loans or Base Rate Loans (each as defined in the Revolving Credit Agreement) at the Company's option. Each SOFR Loan will bear interest at a rate per annum equal to the applicable SOFR Rate plus a margin based on the Company's Debt Ratings (as defined in the Revolving Credit Agreement) from time to time of between 0.625% and 1.250%. Each Base Rate Loan will bear interest at a rate per annum equal to the Base Rate (as defined in the Revolving Credit Agreement) plus a margin based on the Company's Debt Ratings from time to time of between 0.000% and 0.250%. In addition, the Company has agreed to pay a commitment fee based on the Company's Debt Ratings from time to time of between 0.050% and 0.125% (as defined in the Revolving Credit Agreement). The Revolving Credit Agreement also contains a sustainability-linked pricing component which provides for interest rate and facility fee reductions or increases based on the Company meeting or missing targets related to environmental sustainability, specifically greenhouse gas emissions.
The Revolving Credit Agreement contains customary representations and warranties, and affirmative and negative covenants and events of default applicable to the Company and its subsidiaries. As of December 31, 2022, the Company was in compliance with these covenants.
As of December 31, 2022, the Company had no outstanding borrowings under this revolving credit facility but may borrow in the future and use the proceeds for payment of expenses in connection with working capital and general corporate expenses.
74
NOTE 9 – Financial Instruments
Financial Instruments Recorded at Fair Value on a Recurring Basis
| December 31, 2022 | December 25, 2021 | ||||||||||||||||||||||||||||||||||
| (In millions) | Level 1 | Level 2 | Total | Level 1 | Level 2 | Total | |||||||||||||||||||||||||||||
| Cash equivalents | |||||||||||||||||||||||||||||||||||
| Money market funds | $ | $ | $ | $ | $ | $ | |||||||||||||||||||||||||||||
| Commercial paper | |||||||||||||||||||||||||||||||||||
| Time deposits and certificates of deposits | |||||||||||||||||||||||||||||||||||
| Short-term investments | |||||||||||||||||||||||||||||||||||
| Commercial paper | |||||||||||||||||||||||||||||||||||
| Time deposits and certificates of deposits | |||||||||||||||||||||||||||||||||||
| Asset-backed and mortgage-backed securities | |||||||||||||||||||||||||||||||||||
| U.S. Treasury and agency securities | |||||||||||||||||||||||||||||||||||
| Foreign government and agency securities | |||||||||||||||||||||||||||||||||||
| Other non-current assets | |||||||||||||||||||||||||||||||||||
| Time deposits and certificates of deposits | |||||||||||||||||||||||||||||||||||
| Equity investments | |||||||||||||||||||||||||||||||||||
| Deferred compensation plan investments | |||||||||||||||||||||||||||||||||||
| Total assets measured at fair value | $ | $ | $ | $ | $ | $ | |||||||||||||||||||||||||||||
The Company did not have any financial instruments measured at fair value on a recurring basis within Level 3 fair value measurements as of December 31, 2022 or December 25, 2021.
Deferred compensation plan investments are primarily mutual fund investments held in a Rabbi trust established to maintain the Company’s executive deferred compensation plan.
| December 31, 2022 | |||||||||||||||||||||||
| Cost/ Amortized Cost | Gross Unrealized Gains | Gross Unrealized Losses | Estimated Fair Value | ||||||||||||||||||||
| (in millions) | |||||||||||||||||||||||
| Asset-backed and mortgage-backed securities | $ | $ | $ | ( |
$ | ||||||||||||||||||
| Commercial paper | ( |
||||||||||||||||||||||
| Money market funds | |||||||||||||||||||||||
| Time deposits and certificates of deposits | |||||||||||||||||||||||
| U.S. Treasury and agency securities | ( |
||||||||||||||||||||||
| Foreign government and agency securities | |||||||||||||||||||||||
| $ | $ | $ | ( |
$ | |||||||||||||||||||
As of December 31, 2022, the Company did not have material available-for-sale debt securities which had been in a continuous unrealized loss position of more than twelve months.
75
The contractual maturities of investments classified as available-for-sale are as follows:
| December 31, 2022 | December 25, 2021 | ||||||||||||||||||||||
| Amortized Cost | Fair Value | Amortized Cost | Fair Value | ||||||||||||||||||||
| (In millions) | (In millions) | ||||||||||||||||||||||
| Due within 1 year | $ | $ | $ | $ | |||||||||||||||||||
| Due in 1 year through 5 years | |||||||||||||||||||||||
| Due in 5 years and later | |||||||||||||||||||||||
| $ | $ | $ | $ | ||||||||||||||||||||
Financial Instruments Not Recorded at Fair Value
The carrying amounts and estimated fair values of the Company’s long-term debt are as follows:
| December 31, 2022 | December 25, 2021 | ||||||||||||||||||||||
| Carrying Amount |
Estimated Fair Value |
Carrying Amount |
Estimated Fair Value |
||||||||||||||||||||
| (In millions) | |||||||||||||||||||||||
| Current portion of long-term debt, net | $ | $ | $ | $ | |||||||||||||||||||
| Long-term debt, net of current portion | |||||||||||||||||||||||
The estimated fair value of the Company’s long-term debt is based on Level 2 inputs of quoted prices for the Company’s debt and comparable instruments in inactive markets.
The fair value of the Company’s accounts receivable, accounts payable and other short-term obligations approximate their carrying value based on existing terms.
Financial Instruments Measured at Fair Value on a Non-Recurring Basis
As of December 31, 2022, the Company had non-marketable securities in privately-held companies of $137 million. The balance of non-marketable securities in privately-held companies as of December 25, 2021 was not material.
Hedging Transactions and Derivative Financial Instruments
Foreign Currency Forward Contracts Designated as Accounting Hedges
The Company enters into foreign currency forward contracts to hedge its exposure to foreign currency exchange rate risk related to future forecasted transactions denominated in currencies other than the U.S. Dollar. These contracts generally mature within 24 months and are designated as accounting hedges. As of December 31, 2022 and December 25, 2021, the notional value of the Company’s outstanding foreign currency forward contracts designated as cash flow hedges was $1.9 billion and $894 million, respectively. The fair value of these contracts, recorded as a liability, was $27 million as of December 31, 2022. The fair value of these contracts as of December 25, 2021 was not material.
Foreign Currency Forward Contracts Not Designated as Accounting Hedges
The Company also enters into foreign currency forward contracts to reduce the short-term effects of foreign currency fluctuations on certain receivables or payables denominated in currencies other than the U.S. Dollar. These forward contracts generally mature within 3 months and are not designated as accounting hedges. As of December 31, 2022 and December 25, 2021, the notional value of these outstanding contracts was $485 million and $291 million, respectively. The fair value of these contracts was not material as of December 31, 2022 and December 25, 2021.
The cash flows associated with derivative instruments as cash flow hedging instruments are classified in the same category in the Consolidated Statement of Cash Flows as the cash flows of the related items.
76
NOTE 10 – Concentrations of Credit Risk
Financial instruments that potentially subject the Company to concentrations of credit risk consist primarily of investments in time deposits, available-for-sale debt securities and trade receivables.
The Company places its investments with high credit quality financial institutions. At the time an investment is made, investments in commercial paper of industrial firms and financial institutions are rated A1, P1, F1 or better. The Company invests in bonds that are rated A, A2 or better and repurchase agreements, each of which have securities of the type and quality listed above as collateral.
The Company believes that concentrations of credit risk with respect to trade receivables are limited because a large number of geographically diverse customers make up the Company’s customer base, thus diluting the trade credit risk. One customer accounted for approximately 18 % of the total consolidated accounts receivable balance as of December 31, 2022. Two customers each accounted for approximately 20 % and 15 % of the total consolidated accounts receivable balance as of December 25, 2021. However, the Company does not believe the receivable balance from these customers represents a significant credit risk based on past collection experience and review of their current credit quality.
NOTE 11 – Earnings Per Share
Basic earnings per share is computed based on the weighted-average number of shares outstanding.
Diluted earnings per share is computed based on the weighted-average number of shares outstanding plus potentially dilutive shares outstanding during the period. Potentially dilutive shares are determined by applying the treasury stock method to the Company’s stock options, RSUs (including PRSUs), common stock to be issued under the ESPP and warrants. Potentially dilutive shares issuable upon conversion of the 2.125 % Convertible Senior Notes due 2026 (2.125 % Notes) are calculated using the if-converted method.
| Year Ended | |||||||||||||||||
| December 31, 2022 | December 25, 2021 | December 26, 2020 | |||||||||||||||
| (In millions, except per share amounts) | |||||||||||||||||
| Numerator | |||||||||||||||||
| Net income for basic earnings per share | $ | $ | $ | ||||||||||||||
| Effect of potentially dilutive shares: | |||||||||||||||||
| Interest expense related to the 2.125% Notes | |||||||||||||||||
| Net income for diluted earnings per share | $ | $ | $ | ||||||||||||||
| Denominator | |||||||||||||||||
| Basic weighted-average shares | |||||||||||||||||
| Effect of potentially dilutive shares: | |||||||||||||||||
| Employee equity plans and warrants | |||||||||||||||||
| 2.125% Notes | |||||||||||||||||
| Diluted weighted-average shares | |||||||||||||||||
| Earnings per share: | |||||||||||||||||
| Basic | $ | $ | $ | ||||||||||||||
| Diluted | $ | $ | $ | ||||||||||||||
Potential shares from employee equity plans and the impact from the conversion of the 2.125 % Notes up to the conversion date, totaling 16 million and 2 million shares for 2022 and 2021, respectively, were not included in the earnings per share calculation because their inclusion would have been anti-dilutive.
77
NOTE 12 – Common Stock and Stock-Based Compensation
Common Stock
| Year Ended | |||||||||||||||||
| December 31, 2022 |
December 25, 2021 |
December 26, 2020 |
|||||||||||||||
| (In millions) | |||||||||||||||||
| Balance, beginning of period | |||||||||||||||||
| Common stock issued in the acquisition of Xilinx | |||||||||||||||||
| Common stock issued under employee equity plans | |||||||||||||||||
| Repurchases of common stock | ( |
( |
|||||||||||||||
| Common stock repurchases for tax withholding on equity awards | ( |
( |
( |
||||||||||||||
| Issuance of common stock to settle convertible debt | |||||||||||||||||
| Balance, end of period | |||||||||||||||||
Stock Repurchase Program
In May 2021, the Company’s Board of Directors approved a stock repurchase program authorizing up to $4 billion of the Company’s common stock (Existing Repurchase Program). In February 2022, the Company’s Board of Directors approved a new stock repurchase program in addition to the Existing Repurchase Program to purchase up to $8 billion of outstanding common stock in the open market (collectively referred to as the “Repurchase Program”).
During the year ended December 31, 2022, the Company repurchased 36.3 million shares of its common stock under the Repurchase Program for $3.7 billion. As of December 31, 2022, $6.5 billion remained available for future stock repurchases under this program. This Repurchase Program does not obligate the Company to acquire any common stock, has no termination date and may be suspended or discontinued at any time.
Stock-Based Compensation
The Company’s employee equity programs are intended to attract, retain and motivate highly qualified employees. On April 29, 2004, the Company’s stockholders approved the 2004 Equity Incentive Plan, as amended and restated (the 2004 Plan). In the fourth quarter of 2017, the Company introduced the 2017 ESPP, as amended and restated (the 2017 Plan).
Under the 2004 Plan, stock options generally vest and become exercisable over a three-year period from the date of grant and expire within seven years after the grant date. Unvested shares that are reacquired by the Company from forfeited outstanding equity awards become available for grant and may be reissued as new awards.
Under the 2004 Plan, the Company can grant (i) stock options, and (ii) RSUs, including time-based RSUs and PRSUs.
Stock Options. Under the 2004 Plan, nonstatutory and incentive stock options may be granted. The exercise price of the shares subject to each nonstatutory stock option and incentive stock option cannot be less than 100 % of the fair market value of the Company’s common stock on the date of the grant. The exercise price of each option granted under the 2004 Plan must be paid in full at the time of the exercise.
Time-based RSUs. Time-based RSUs are awards that can be granted to any employee, director or consultant and that obligate the Company to issue a specific number of shares of the Company’s common stock in the future if the vesting terms and conditions are satisfied.
PRSUs. PRSUs can be granted to certain of the Company’s senior executives. The performance metrics can be financial performance, non-financial performance and/or market conditions. Each PRSU award reflects a target number of shares (Target Shares) that may be issued to an award recipient before adjusting based on the Company’s financial performance, non-financial performance and/or market conditions. The actual number of shares that a grant recipient receives at the end of the period may range from 0 % to 250 % of the Target Shares granted, depending upon the degree of achievement of the performance target designated by each individual award.
78
ESPP. Under the 2017 Plan, eligible employees who participate in an offering period may have up to 15 % of their eligible earnings withheld, up to certain limitations, to purchase shares of common stock at 85 % of the lower of the fair market value on the first or the last business day of the six-month offering period. The offering periods commence in May and November each year.
As of December 31, 2022, the Company had 32 million shares of common stock that were available for future grants and 28 million shares reserved for issuance upon the exercise of outstanding stock options or the vesting of unvested RSUs, including PRSUs, under the 2004 Plan. In addition, the Company had 36 million shares of common stock that were available for issuance under the 2017 plan. With the acquisition of Xilinx, the Company assumed the Xilinx, Inc. 2007 Equity Incentive Plan (2007 Plan) and may grant stock options and awards under this plan. As of December 31, 2022, the Company had 18 million shares of common stock that were available for future grants under the 2007 Plan.
Valuation and Expense
| Year Ended | |||||||||||||||||
| December 31, 2022 | December 25, 2021 | December 26, 2020 | |||||||||||||||
| (In millions) | |||||||||||||||||
| Cost of sales | $ | $ | $ | ||||||||||||||
| Research and development | |||||||||||||||||
| Marketing, general, and administrative | |||||||||||||||||
| Total stock-based compensation expense before income taxes | |||||||||||||||||
| Income tax benefit | ( |
( |
( |
||||||||||||||
| Total stock-based compensation expense, net of income taxes | $ | $ | $ | ||||||||||||||
Stock Options. The weighted-average estimated fair value of employee stock options granted during 2022, 2021 and 2020 was $44.35 , $46.07 and $38.49 per share, respectively, using the following assumptions:
| December 31, 2022 | December 25, 2021 | December 26, 2020 | |||||||||||||||
| Expected volatility | % | % | 57.87 | % | |||||||||||||
| Risk-free interest rate | % | % | 0.18 | % | |||||||||||||
| Expected dividends | % | % | % | ||||||||||||||
| Expected life (in years) | 4.30 | ||||||||||||||||
The Company uses a combination of the historical volatility of its common stock and the implied volatility for publicly traded options on the Company’s common stock as the expected volatility assumption. The risk-free interest rate is based on the rate for a U.S. Treasury zero-coupon yield curve with a term that approximates the expected life of the option grant at the date closest to the option grant date. The expected dividend yield is zero as the Company does not expect to pay dividends in the near future. The expected term of employee stock options represents the weighted-average period the stock options are expected to remain outstanding.
The following table summarizes stock option activity and related information:
| Outstanding Number of Shares |
Weighted- Average Exercise Price |
Aggregate Intrinsic Value | Weighted-Average Remaining Contractual Life (in years) |
||||||||||||||||||||
| (In millions, except share price) | |||||||||||||||||||||||
| Balance as of December 25, 2021 | $ | ||||||||||||||||||||||
| Granted | $ | ||||||||||||||||||||||
| Exercised | ( |
$ | |||||||||||||||||||||
| Balance as of December 31, 2022 | $ | $ | |||||||||||||||||||||
| Exercisable December 31, 2022 | $ | $ | |||||||||||||||||||||
The total intrinsic value of stock options exercised for 2022, 2021 and 2020 was $139 million, $277 million and $180 million, respectively.
79
As of December 31, 2022, the Company had $35 million of total unrecognized compensation expense related to stock options, which will be recognized over the weighted-average period of 2.74 years.
Time-based RSUs. The weighted-average grant date fair values of time-based RSUs granted during 2022, 2021 and 2020 were $92.92 , $78.59 and $32.52 per share, respectively.
The following table summarizes time-based RSU activity and related information:
| Number of Shares |
Weighted- Average Grant Date Fair Value | Aggregate Intrinsic Value | Weighted-Average Remaining Contractual Life (in years) |
||||||||||||||||||||
| (In millions except share price) | |||||||||||||||||||||||
| Unvested shares as of December 25, 2021 | $ | ||||||||||||||||||||||
| Assumed with acquisition of Xilinx | 12 | $ | 103.35 | ||||||||||||||||||||
| Granted | $ | ||||||||||||||||||||||
| Forfeited | ( |
$ | |||||||||||||||||||||
| Vested | ( |
$ | |||||||||||||||||||||
| Unvested shares as of December 31, 2022 | $ | $ | |||||||||||||||||||||
The total fair value of time-based RSUs vested during 2022, 2021 and 2020 was $889 million, $678 million and $642 million, respectively.
As of December 31, 2022, the Company had $2.0 billion of total unrecognized compensation expense related to time-based RSUs, which will be recognized over the weighted-average period of 1.67 years.
PRSUs. The weighted-average grant date fair values of PRSUs granted during 2022, 2021 and 2020 were $121.12 , $153.89 and $122.95 , respectively, using the following assumptions:
| December 31, 2022 | December 25, 2021 | December 26, 2020 | |||||||||||||||
| Expected volatility | 50.65% - 53.51% |
% | |||||||||||||||
| Risk-free interest rate | 1.14% - 3.17% |
% | |||||||||||||||
| Expected dividends | % | % | % | ||||||||||||||
| Expected term (in years) | 2.07 - 3.07 |
3.00 | |||||||||||||||
The Company uses the historical volatility of its common stock and risk-free interest rate based on the rate for a U.S. Treasury zero-coupon yield curve with a term that approximates the expected life of the PRSUs grant at the date closest to the grant date. The expected dividend yield is zero as the Company does not expect to pay dividends in the near future. The expected term of PRSUs represents the requisite service periods of these PRSUs.
The following table summarizes PRSU activity and related information:
| Number of Shares |
Weighted-Average Grant Date Fair Value |
Aggregate Intrinsic Value | Weighted-Average Remaining Contractual Life (in years) |
||||||||||||||||||||
| (In millions except share price) | |||||||||||||||||||||||
| Unvested shares as of December 25, 2021 | $ | ||||||||||||||||||||||
| Granted | $ | ||||||||||||||||||||||
| Forfeited | $ | ||||||||||||||||||||||
| Vested | ( |
$ | |||||||||||||||||||||
| Unvested shares as of December 31, 2022 | $ | $ | |||||||||||||||||||||
The total fair value of PRSUs vested during 2022, 2021 and 2020 was $254 million, $98 million and $76 million, respectively.
As of December 31, 2022, the Company had $101 million of total unrecognized compensation expense related to PRSUs, which will be recognized over the weighted-average period of 1.76 years.
80
ESPP. The weighted-average grant date fair value for the ESPP during 2022, 2021 and 2020 was $24.71 , $27.27 and $20.97 per share, respectively, using the following assumptions:
| December 31, 2022 | December 25, 2021 | December 28, 2020 | |||||||||||||||
| Expected volatility | |||||||||||||||||
| Risk-free interest rate | |||||||||||||||||
| Expected dividends | % | % | % | ||||||||||||||
| Expected term (in years) | |||||||||||||||||
The Company uses the historical volatility of its common stock and the risk-free interest rate based on the rate for a U.S. Treasury zero-coupon yield curve with a term that approximates the expected life of the ESPP grant at the date closest to the ESPP grant date. The expected dividend yield is zero as the Company does not expect to pay dividends in the near future. The expected term of the ESPP represents the six-month offering period.
During 2022, 3 million shares of common stock were purchased under the ESPP at a purchase price of $59.29 resulting in aggregate cash proceeds of $160 million. As of December 31, 2022, the Company had $37 million of total unrecognized compensation expense related to the ESPP, which will be recognized over the weighted-average period of 0.36 years.
Xilinx Replacement Awards
In connection with the acquisition of Xilinx, the Company issued equity awards as replacement for assumed equity awards to Xilinx employees. The replacement awards include restricted stock units of approximately 12 million shares with a weighted average fair value of $103.35 per share and have terms that are substantially the same as the assumed Xilinx awards. The fair value of replacement awards related to services rendered up to the Xilinx Acquisition Date was recognized as a component of the total purchase consideration while the remaining fair value of replacement awards attributable to post-combination services is being recognized as stock-based compensation expense over the remaining post-acquisition vesting period.
NOTE 13 – Retirement Benefit Plans
NOTE 14 – Income Taxes
| Year Ended | |||||||||||||||||
| December 31, 2022 | December 25, 2021 | December 26, 2020 | |||||||||||||||
| (In millions) | |||||||||||||||||
| U.S. | $ | $ | $ | ||||||||||||||
| Non-U.S. | ( |
||||||||||||||||
| Total pre-tax income including equity income in investee | $ | $ | $ | ||||||||||||||
81
| Year Ended | |||||||||||||||||
| December 31, 2022 | December 25, 2021 | December 26, 2020 | |||||||||||||||
| (In millions) | |||||||||||||||||
| Current: | |||||||||||||||||
| U.S. federal | $ | $ | $ | ||||||||||||||
| U.S. state and local | |||||||||||||||||
| Non-U.S. | |||||||||||||||||
| Total | |||||||||||||||||
| Deferred: | |||||||||||||||||
| U.S. federal | ( |
( |
|||||||||||||||
| U.S. state and local | ( |
( |
( |
||||||||||||||
| Non-U.S. | ( |
( |
( |
||||||||||||||
| Total | ( |
( |
|||||||||||||||
| Income tax provision (benefit) | $ | ( |
$ | $ | ( |
||||||||||||
The table below displays the reconciliation between statutory federal income taxes and the total income tax provision (benefit).
| Year Ended | |||||||||||||||||
| December 31, 2022 | December 25, 2021 | December 26, 2020 | |||||||||||||||
| (In millions) | |||||||||||||||||
| Statutory federal income tax expense at 21% | $ | $ | $ | ||||||||||||||
| State taxes (benefit) | ( |
( |
|||||||||||||||
| Foreign rate detriment (benefit) | ( |
||||||||||||||||
| GILTI and other foreign inclusion | ( |
||||||||||||||||
| Foreign-Derived Intangible Income (FDII) deduction | ( |
( |
|||||||||||||||
| Research credits | ( |
( |
( |
||||||||||||||
| Stock-based and non-deductible compensation | ( |
( |
|||||||||||||||
| Valuation allowance change | ( |
||||||||||||||||
| Other | |||||||||||||||||
| Income tax provision (benefit) | $ | ( |
$ | $ | ( |
||||||||||||
The Company recorded an income tax benefit of $122 million in 2022 and an income tax provision of $513 million in 2021, representing effective tax rates of (10%) and 14%, respectively. The reduction in income tax expense in 2022 was primarily due to the lower pre-tax income coupled with a $261 million FDII tax benefit and $241 million of research and development (R&D) tax credits.
Beginning in 2022, provisions in the U.S. Tax Cuts and Jobs Act of 2017 require the Company to capitalize and amortize R&D expenditures rather than deducting the costs as incurred. The capitalization resulted in an increase in 2022 taxable income which also increased the income eligible for the FDII tax benefit. Additionally, there was a pre-tax loss incurred outside of the U.S. primarily due to the GAAP amortization of Xilinx acquisition-related items and therefore, the Company recorded a corresponding tax benefit associated with the reversal of the previously established GILTI deferred tax liability.
As a part of the Xilinx acquisition and as a result of certain employment and operational commitments the Company has made in Singapore, the Company has been granted a Development and Expansion Incentive (DEI) that is effective through 2031. The DEI reduces the local tax on Singapore income from a statutory rate of 17% to 5% through 2031. Due to the current year pre-tax loss, the Company did not receive any income tax or EPS benefit.
82
The Company recorded an income tax provision of $513 million in 2021 and an income tax benefit of $1.2 billion in 2020, representing effective tax rates of 14% and (95)% respectively. The income tax provision in 2021 was a result of higher income in the U.S. and increase in foreign taxes, partially offset by $147 million of FDII benefit, $78 million of R&D tax credits, and $125 million of excess tax benefit for stock-based compensation net of non-deductible officers’ compensation.
The income tax benefit in 2020 was primarily due to $1.3 billion of tax benefit from the valuation allowance release in the U.S. This benefit was partially offset by approximately $10 million of withholding tax expense related to cross-border transactions, $13 million of state and foreign taxes and $75 million increase in valuation allowance against certain state and foreign tax credits, which are reflected as part of the state taxes and foreign rate benefit in the reconciliation table above.
Deferred income taxes reflect the net tax effects of tax carryovers and temporary differences between the carrying amounts of assets and liabilities for financial reporting purposes and the balances for income tax purposes. Significant components of the Company’s deferred tax assets and liabilities as of December 31, 2022 and December 25, 2021 were as follows:
| December 31, 2022 |
December 25, 2021 |
||||||||||
| (In millions) | |||||||||||
| Deferred tax assets: | |||||||||||
| Net operating loss carryovers | $ | $ | |||||||||
| Accruals and reserves not currently deductible | |||||||||||
| Employee benefits not currently deductible | |||||||||||
| Federal and state tax credit carryovers | |||||||||||
| Foreign R&D and investment tax credits | |||||||||||
| Capitalized costs | |||||||||||
| Lease liability | |||||||||||
| Capitalized R&D | |||||||||||
| Other | |||||||||||
| Total deferred tax assets | |||||||||||
| Less: valuation allowance | ( |
( |
|||||||||
| Total deferred tax assets, net of valuation allowance | |||||||||||
| Deferred tax liabilities: | |||||||||||
| Acquired intangibles | ( |
( |
|||||||||
| Right-of-use assets | ( |
( |
|||||||||
| Undistributed foreign earnings | ( |
( |
|||||||||
| GILTI | ( |
||||||||||
| Other | ( |
( |
|||||||||
| Total deferred tax liabilities | ( |
( |
|||||||||
| Net deferred tax assets (liabilities) | $ | ( |
$ | ||||||||
As a result of the acquisition of Xilinx, the Company recorded $4.3 billion of net deferred tax liabilities primarily on the excess of book basis over the tax basis of the acquired intangible assets, including $857 million of GILTI net deferred tax liability.
Additionally, as the result of the new R&D capitalization tax law effective in 2022, the capitalized amounts resulted in increased current year taxable income, but which are deductible as amortized in future periods. Therefore, the Company recorded a deferred tax asset for the capitalized R&D expenditures.
83
The movement in the deferred tax valuation allowance was as follows:
| December 31, 2022 | December 25, 2021 | December 26, 2020 | |||||||||||||||
| (In millions) | |||||||||||||||||
| Balance at beginning of year | $ | $ | $ | ||||||||||||||
| Charges (reductions) to income tax expense and other accounts* | ( |
||||||||||||||||
| Acquisition-related | |||||||||||||||||
Net recoveries+
|
|||||||||||||||||
| Balance at end of year | $ | $ | $ | ||||||||||||||
| * | Amounts recorded in 2020 reflect release of valuation allowances. |
||||
| + | The net recoveries for all were primarily related to net originating deferred tax assets and newly generated tax credits. | ||||
Under current U.S. tax law, the impact of future distributions of undistributed earnings that are indefinitely reinvested are anticipated to be subject to withholding taxes from local jurisdictions and non-conforming U.S. state jurisdictions. The amount of cumulative undistributed earnings that are permanently reinvested that could be subject to withholding taxes are $460 million as of December 31, 2022.
Through the end of fiscal year 2022, the Company continued to maintain a valuation allowance of approximately $2.1 billion for certain federal, state, and foreign tax attributes. The federal valuation allowance maintained is due to limitations under Internal Revenue Code Section 382 or 383, separate return loss year rules, or dual consolidated loss rules. Certain state and foreign valuation allowance maintained is due to lack of sufficient sources of future taxable income.
The Company’s U.S. federal and state net operating losses carryforwards as of December 31, 2022, were $435 million and $476 million, respectively. Net operating losses (NOLs) may be subject to limitations by the Internal Revenue Code and similar provisions. $71 million of U.S. federal NOLs will expire between 2023 and 2037, and $364 million of federal NOLs have no expiration date, and the state NOLs will expire at various dates through 2042. The difference between the amount of federal NOLs which are recorded on the Company’s balance sheet as deferred tax assets and their related valuation allowance, and the amounts reported on the Company’s tax returns are the result of uncertain tax positions the Company has taken during the current year and for which an income tax reserve has been recorded. The federal tax credits of $12 million will expire at various dates between 2023 and 2042. The state tax credits of $722 million will expire at various dates between 2023 through 2038 except for California R&D credit, which does not expire. The Company also has $595 million of credit carryforward in Canada that will expire between 2026 and 2040.
The Company also recorded $142 million of current tax payable as of the Xilinx acquisition date. Additionally, the Company assumed $203 million of long-term liabilities for uncertain tax positions, including $12 million of interest, as well as $321 million of long-term liabilities for transition tax payable over three years. Included in the assumed liabilities for uncertain tax positions is a tax position with respect to whether stock-based compensation from Xilinx’s cost sharing arrangement should be shared among cost share participants. The Company has concluded that the law was unsettled and believes the current uncertain tax position liability is sufficient and will continue to monitor developments in relevant tax court cases.
84
A reconciliation of the Company's gross unrecognized tax benefits was as follows:
| December 31, 2022 | December 25, 2021 | December 26, 2020 | |||||||||||||||
| (In millions) | |||||||||||||||||
| Balance at beginning of year | $ | $ | $ | ||||||||||||||
| Increases for tax positions taken in the current year | |||||||||||||||||
| Increases for tax positions taken in prior years | |||||||||||||||||
| Decreases for tax positions taken in prior years | ( |
( |
( |
||||||||||||||
| Increases to tax positions taken in prior years through acquisitions | |||||||||||||||||
| Decreases for settlements with taxing authorities and statute of limitation lapses | ( |
( |
( |
||||||||||||||
| Balance at end of year | $ | $ | $ | ||||||||||||||
The amount of unrecognized tax benefits that would impact the effective tax rate if recognized was $1.2 billion, $215 million and $77 million as of December 31, 2022, December 25, 2021 and December 26, 2020, respectively. The Company’s policy is to include interest and penalties related to income tax liabilities within the provision for income taxes on the Consolidated Statements of Operations. The Company had $81.3 million of accrued penalties and interest related to unrecognized tax benefits as of December 31, 2022 including $12 million assumed from the Xilinx acquisition. The Company had no
The Company is subject to taxation in the U.S. and foreign jurisdictions. Earnings from non-U.S. activities are subject to local country income tax. The material jurisdiction in which the Company is subject to potential examination by the taxing authority is the United States, where tax years from 2008 are open for audit. Pre-acquisition Xilinx U.S. tax returns for fiscal years 2018 and 2019 are currently under audit by the IRS.
NOTE 15 – Other Income (Expense), Net
| Year Ended | |||||||||||||||||
| December 31, 2022 | December 25, 2021 | December 26, 2020 | |||||||||||||||
| (In millions) | |||||||||||||||||
| Interest income | $ | $ | $ | ||||||||||||||
| Loss on debt redemption, repurchase and conversion | ( |
( |
|||||||||||||||
| Gains (losses) on equity investments, net | ( |
||||||||||||||||
| Other income (expense) | ( |
( |
|||||||||||||||
| Other income (expense), net | $ | $ | $ | ( |
|||||||||||||
NOTE 16 – Commitments and Guarantees
Operating Leases
The Company has entered into operating and finance leases for its corporate offices, data centers, research and development facilities and certain equipment. The leases expire at various dates through 2031, some of which include options to extend the lease for up to ten years.
85
For 2022, 2021 and 2020, the Company recorded $118 million, $71 million and $59 million, respectively, of operating lease expense, including short-term lease expense. For 2022 and 2021, the Company recorded $40 million and $26 million, respectively, of variable lease expense, which primarily included operating expenses and property taxes associated with the usage of facilities under the operating leases. For 2022 and 2021, cash paid for operating leases included in operating cash flows was $108 million and $67 million, respectively. The Company’s finance and short-term leases are immaterial to the Company’s consolidated financial statements.
| December 31, 2022 |
|||||
| Weighted-average remaining lease term in years – operating leases | |||||
| Weighted-average discount rate – operating leases | % | ||||
Future minimum lease payments under non-cancellable operating lease liabilities as of December 31, 2022 are as follows:
| Year | (In millions) | ||||
| 2023 | $ | ||||
| 2024 | |||||
| 2025 | |||||
| 2026 | |||||
| 2027 | |||||
| 2028 and thereafter | |||||
| Total minimum lease payments | |||||
| Less: interest | ( |
||||
| Present value of net minimum lease payments | |||||
| Less: current portion | ( |
||||
| Total long-term operating lease liabilities | $ | ||||
Certain other operating leases contain provisions for escalating lease payments subject to changes in the consumer price index.
Commitments
The Company’s purchase commitments primarily include the Company’s obligations to purchase wafers and substrates from third parties and future payments related to certain software and technology licenses and IP licenses. Purchase commitments include obligations made under noncancellable purchase orders and contractual obligations requiring minimum purchases or for which cancellation would lead to significant penalties.
Total future unconditional purchase commitments as of December 31, 2022 were as follows:
| Year | (In millions) | ||||
| 2023 | $ | ||||
| 2024 | |||||
| 2025 | |||||
| 2026 | |||||
| 2027 | |||||
| 2028 and thereafter | |||||
| Total unconditional purchase commitments | $ | ||||
On an ongoing basis, the Company works with suppliers on the timing of payments and deliveries of purchase commitments, taking into account business conditions.
86
Warranties and Indemnities
The Company generally warrants that its products sold to its customers will conform to its approved specifications and be free from defects in material and workmanship under normal use and conditions for one year . The Company may also offer to three-year limited warranties based on product type and negotiated warranty terms with certain customers. The Company accrues warranty costs to Cost of sales at the time of sale of warranted products.
Changes in the Company’s estimated liability for product warranty during 2022 and 2021 are as follows:
| December 31, 2022 |
December 25, 2021 |
||||||||||
| (In millions) | |||||||||||
| Beginning balance | $ | $ | |||||||||
| Provisions during the period | |||||||||||
| Settlements during the period | ( |
( |
|||||||||
| Ending balance | $ | $ | |||||||||
In addition to product warranties, the Company from time to time in its normal course of business indemnifies other parties with whom it enters into contractual relationships, including customers, lessors and parties to other transactions with the Company, with respect to certain matters. In these limited matters, the Company has agreed to hold certain third parties harmless against specific types of claims or losses such as those arising from a breach of representations or covenants, third-party claims that the Company’s products when used for their intended purpose(s) and under specific conditions infringe the intellectual property rights of a third party, or other specified claims made against the indemnified party. It is not possible to determine the maximum potential amount of liability under these indemnification obligations due to the unique facts and circumstances that are likely to be involved in each particular claim and indemnification provision. Historically, payments made by the Company under these obligations have not been material. In addition, the impact from changes in estimates for pre-existing warranties has been immaterial.
NOTE 17 – Contingencies
Quarterhill Inc. Litigation
On July 2, 2018, three entities named Aquila Innovations, Inc. (Aquila), Collabo Innovations, Inc. (Collabo), and Polaris Innovations, Ltd. (Polaris), filed separate patent infringement complaints against the Company in the United States District Court for the Western District of Texas. Aquila alleges that the Company infringes two patents (6,239,614 and 6,895,519) relating to power management; Collabo alleges that the Company infringes one patent (7,930,575) related to power management; and Polaris alleges that the Company infringes two patents (6,728,144 and 8,117,526) relating to control or use of dynamic random-access memory, or DRAM. Each of the three complaints seeks unspecified monetary damages, interest, fees, expenses, and costs against the Company; Aquila and Collabo also seek enhanced damages. Aquila, Collabo, and Polaris each appear to be related to a patent assertion entity named Quarterhill Inc. (formerly WiLAN Inc.).
On May 14, 2020, at the request of Polaris, the Court dismissed all claims related to one of the two patents in suite in the Polaris case. On June 10, 2020, the Court granted AMD’s motions to stay the Polaris and Aquila cases pending the completion of inter partes review of each of the patents-in-suit in those cases by the Patent Trial and Appeal Board. On February 22, 2021, February 26, 2021, and March 10, 2021, the Patent Trial and Appeal Board issued final written decisions in inter partes reviews invalidating all asserted claims of the remaining Polaris and Aquila patents.
On May 10, 2021, Aquila filed a notice of appeal to the Court of Appeals for the Federal Circuit for the IPR decision regarding U.S. Patent No. 6,895,519. On April 30, 2021, Polaris filed a notice of appeal to the Court of Appeals for the Federal Circuit for the IPR decision regarding U.S. Patent No. 8,117,526. On May 14, 2021, AMD filed a notice of cross-appeal to the Court of Appeals for the Federal Circuit for the IPR decision regarding U.S. Patent No. 8,117,526. On July 18, 2022, the Court of Appeals for the Federal Circuit affirmed the Patent Trial and Appeal Board’s decision.
87
On February 8, 2022, Polaris filed a lawsuit against Xilinx, Inc. alleging infringement of four patents related to memory chips and memory interfaces. On February 22, 2022, the Company was served with the complaint. On April 14, 2022, the Company filed a motion to dismiss the complaint. On April 28, 2022, Polaris filed an amended complaint. On May 12, 2022, the Company filed an answer to the amended complaint.
On June 1, 2022, Polaris filed two lawsuits against the Company and Hewlett-Packard GmbH, HP Deutschland GmbH in the Hamburg and Munich Courts in Germany, alleging infringement of two patents related to memory chips and memory interfaces. On July 15, 2022, Polaris filed a lawsuit against the Company, ASUSTeK Computer Inc., and ASUS Computer GmbH, alleging infringement of a patent related to memory chips and memory interfaces.
Based upon information presently known to management, the Company believes that the potential liability of the above listed legal proceeding, if any, will not have a material adverse effect on its financial condition, cash flows or results of operations.
Monterey Research Litigation
On November 15, 2019, Monterey Research, LLC (Monterey) filed a patent infringement complaint against the Company in the United States District Court for the District of Delaware. Monterey alleges that the Company infringes six U.S. patents: 6,534,805 (related to SRAM cell design); 6,629,226 (related to read interface protocols); 6,651,134 (related to memory devices); 6,765,407 (related to programmable digital circuits); 6,961,807 (related to integrated circuits and associated memory systems); and 8,373,455 (related to output buffer circuits). On August 12, 2021, Monterey filed two patent infringement complaints in the United States District Court for the Western District of Texas. In the first complaint, Monterey alleges that the Company infringes two patents (8,694,776 and 9,767,303) related to memory controllers, three patents (8,572,297, 7,609,799, and 7,899,145) related to circuit designs, and one patent (6,979,640) related to semiconductor processing. In the second complaint, Monterey alleges that the Company infringes one patent (6,680,516) related to semiconductor processing. On March 31, 2022, the Company entered into an agreement which will provide the Company a license to the Monterey Research patents. The agreement did not have a material adverse effect on the Company’s financial condition, cash flows, or results of operation.
Analog Devices Litigation
On December 5, 2019, Analog Devices, Inc. (ADI) filed a lawsuit against Xilinx alleging infringement of eight patents related to switching circuits, comparators, analog to digital convertors, signal conditioners, and switched capacitors. On January 21, 2020, Xilinx filed its answer and counterclaims alleging infringement by ADI of eight patents related to digital to analog converters, serializing data paths, transceivers, networks on chip, termination circuits, and data transmitters. In November 2022, the Company and Analog Devices, Inc. resolved all ongoing patent litigations, based on mutually agreed upon terms. As part of this resolution, the two companies have committed to pursue technology collaborations to bring next generation solutions to their communications and data center customers. The agreement did not have a material adverse effect on the Company’s financial condition, cash flows, or results of operations.
Future Link Systems Litigation
On December 21, 2020, Future Link Systems, LLC (Future Link) filed a patent infringement complaint against the Company in the United States District Court for the Western District of Texas. Future Link alleges that the Company infringes three U.S. patents: 7,983,888 (related to simulated PCI express circuitry); 6,363,466 (related to out of order data transactions); and 6,622,108 (related to interconnect testing). On December 21, 2021, Future Link filed a lawsuit alleging infringement of two U.S. patents (8,099,614 and 7,685,439) related to power management. On December 28, 2021, Future Link filed a complaint at the United States International Trade Commission alleging infringement of the same two power management patents. Several of the Company’s customers were also named as respondents. On March 31, 2022, the Company entered into an agreement which will provide the Company a license to the Future Link patents. The agreement did not have a material adverse effect on the Company’s financial condition, cash flows, or results of operations.
88
Environmental Matters
The Company is named as a responsible party on Superfund clean-up orders for three sites in Sunnyvale, California that are on the National Priorities List. Since 1981, the Company has discovered hazardous material releases to the groundwater from former underground tanks and proceeded to investigate and conduct remediation at these three sites. The chemicals released into the groundwater were commonly used in the semiconductor industry in the United States in the wafer fabrication process prior to 1979.
In 1991, the Company received Final Site Clean-up Requirements Orders from the California Regional Water Quality Control Board relating to the three sites. The Company has entered into settlement agreements with other responsible parties on two of the orders. During the term of such agreements, other parties have agreed to assume most of the foreseeable costs as well as the primary role in conducting remediation activities under the orders. The Company remains responsible for additional costs beyond the scope of the agreements as well as all remaining costs in the event that the other parties do not fulfill their obligations under the settlement agreements.
To address anticipated future remediation costs under the orders, the Company has computed and recorded an estimated environmental liability of approximately $3.9 million and has not recorded any potential insurance recoveries in determining the estimated costs of the cleanup. The progress of future remediation efforts cannot be predicted with certainty and these costs may change. The Company believes that any amount in addition to what has already been accrued would not be material.
Other Legal Matters
89
Report of Independent Registered Public Accounting Firm
To the Stockholders and the Board of Directors of Advanced Micro Devices, Inc.
Opinion on the Financial Statements
We have audited the accompanying consolidated balance sheets of Advanced Micro Devices, Inc. (the Company) as of December 31, 2022 and December 25, 2021, the related consolidated statements of operations, comprehensive income, stockholders’ equity and cash flows for each of the three years in the period ended December 31, 2022, and the related notes (collectively referred to as the “consolidated financial statements”). In our opinion, the consolidated financial statements present fairly, in all material respects, the financial position of the Company as of December 31, 2022 and December 25, 2021, and the results of its operations and its cash flows for each of the three years in the period ended December 31, 2022, in conformity with U.S. generally accepted accounting principles.
We also have audited, in accordance with the standards of the Public Company Accounting Oversight Board (United States) (PCAOB), the Company’s internal control over financial reporting as of December 31, 2022, based on criteria established in Internal Control-Integrated Framework issued by the Committee of Sponsoring Organizations of the Treadway Commission (2013 framework) and our report dated February 27, 2023 expressed an unqualified opinion thereon.
Change in Accounting Principle
As discussed in Note 2 to the consolidated financial statements, the Company has elected to change its method of accounting for the United States Global Intangible Low-Taxed Income (GILTI) tax to recognize deferred taxes for temporary tax basis differences expected to reverse as GILTI tax in future years.
Basis for Opinion
These financial statements are the responsibility of the Company's management. Our responsibility is to express an opinion on the Company’s financial statements based on our audits. We are a public accounting firm registered with the PCAOB and are required to be independent with respect to the Company in accordance with the U.S. federal securities laws and the applicable rules and regulations of the Securities and Exchange Commission and the PCAOB.
We conducted our audits in accordance with the standards of the PCAOB. Those standards require that we plan and perform the audit to obtain reasonable assurance about whether the financial statements are free of material misstatement, whether due to error or fraud. Our audits included performing procedures to assess the risks of material misstatement of the financial statements, whether due to error or fraud, and performing procedures that respond to those risks. Such procedures included examining, on a test basis, evidence regarding the amounts and disclosures in the financial statements. Our audits also included evaluating the accounting principles used and significant estimates made by management, as well as evaluating the overall presentation of the financial statements. We believe that our audits provide a reasonable basis for our opinion.
90
Critical Audit Matters
The critical audit matters communicated below are matters arising from the current period audit of the financial statements that were communicated or required to be communicated to the audit committee and that: (1) relate to accounts or disclosures that are material to the financial statements and (2) involved our especially challenging, subjective or complex judgments. The communication of critical audit matters does not alter in any way our opinion on the consolidated financial statements, taken as a whole, and we are not, by communicating the critical audit matters below, providing separate opinions on the critical audit matters or on the accounts or disclosures to which they relate.
Inventory Valuation |
||||||||
| Description of the Matter | At December 31, 2022, the Company’s net inventory balance was $3,771 million. As discussed in Note 2 to the consolidated financial statements, the Company adjusts the inventory carrying value to the lower of actual cost or the estimated net realizable value after completing ongoing reviews of on-hand inventory quantities exceeding forecasted demand and by considering recent historical activity as well as anticipated demand. Auditing management’s inventory carrying value adjustments involved significant judgment because the estimates are based on several factors that are affected by market, industry, and competitive conditions outside the Company's control. In estimating inventory carrying value adjustments, management developed assumptions such as forecasts of future sales quantities and the selling prices, which are sensitive to the competitiveness of product offerings, customer requirements, and product life cycles. These significant assumptions are forward-looking and could be affected by future economic and market conditions. | |||||||
| How We Addressed the Matter in Our Audit |
We obtained an understanding, evaluated the design and tested the operating effectiveness of internal controls over the Company's inventory carrying value adjustment determination process, including the basis for developing the above-described assumptions and management’s judgments. Our audit procedures included, among others, testing the reasonableness of management’s key assumptions and judgments and testing the accuracy and completeness of the underlying data used to determine the amount of inventory carrying value adjustments. For instance, we compared the quantities and carrying value of on-hand inventories to related unit sales, both historical and forecasted, assessed the reasonableness of management’s estimates of future sales prices by analyzing historical sales and evaluating any factors that may impact sales prices, and evaluated the appropriateness and adequacy of management’s adjustments to such sales forecasts by analyzing potential technological changes in line with product life cycles. We also assessed the accuracy of forecasts underlying management's estimates by comparing management’s historical forecasts to actual results, evaluated industry and market factors and performed sensitivity analyses over the significant assumptions used by management to evaluate necessary changes in the inventory carrying value adjustments. |
|||||||
91
| Business Combination | ||||||||
Description of the Matter |
During fiscal year 2022, the Company completed the acquisition of Xilinx, Inc. (“Xilinx”) for consideration of $48.8 billion, as disclosed in Note 5 to the consolidated financial statements. The transaction was accounted for as a business combination. Auditing the Company's accounting for its acquisition of Xilinx was complex due to the significant estimation uncertainty in the Company’s determination of the fair value of certain identified intangible assets, principally consisting of developed technology and customer relationships. The significant estimation uncertainty was primarily due to the sensitivity of the respective fair values to underlying assumptions about the future performance of the acquired business. The Company used a discounted cash flow model to measure the developed technology and customer relationship intangible assets. The significant assumptions used to estimate the value of these intangible assets included certain assumptions that form the basis of the forecasted results, specifically, revenue growth rates, technology migration curves, and time to recreate customer relationships. These significant assumptions are forward looking and could be affected by future economic and market conditions. |
|||||||
| How We Addressed the Matter in Our Audit |
We obtained an understanding, evaluated the design and tested the operating effectiveness of controls over the Company’s accounting for the acquisition. This included testing controls over the estimation process supporting the recognition and measurement of the developed technology and customer relationships intangible assets, including the valuation models and underlying assumptions used to develop such estimates. To test the estimated fair value of the developed technology and customer relationships intangible assets, we performed audit procedures that included, among others, evaluating the Company's selection of the valuation methodology, evaluating the methods and significant assumptions used by the Company, and evaluating the completeness and accuracy of the underlying data supporting the significant assumptions and estimates. For example, we compared the significant assumptions to current industry, market and economic trends and to the Company's budgets and forecasts, and Xilinx’s historical operating results. We involved our valuation specialists to assist with our evaluation of the methodology used by the Company and significant assumptions included in the fair value estimates. Our valuation specialists’ procedures included, among others, developing a range of independent estimates for the discount rates used in the valuation models and comparing those to the discount rates selected by management. |
|||||||
/s/ Ernst & Young LLP
We have served as the Company’s auditor since 1970.
February 27, 2023
92
Report of Independent Registered Public Accounting Firm
To the Stockholders and the Board of Directors of Advanced Micro Devices, Inc.
Opinion on Internal Control over Financial Reporting
We have audited Advanced Micro Devices, Inc.’s internal control over financial reporting as of December 31, 2022, based on criteria established in Internal Control-Integrated Framework issued by the Committee of Sponsoring Organizations of the Treadway Commission (2013 framework) (the COSO criteria). In our opinion, Advanced Micro Devices, Inc. (the Company) maintained, in all material respects, effective internal control over financial reporting as of December 31, 2022, based on the COSO criteria.
We also have audited, in accordance with the standards of the Public Company Accounting Oversight Board (United States) (PCAOB), the consolidated balance sheets of the Company as of December 31, 2022 and December 25, 2021, the related consolidated statements of operations, comprehensive income, stockholders’ equity and cash flows for each of the three years in the period ended December 31, 2022, and the related notes and our report dated February 27, 2023 expressed an unqualified opinion thereon.
Basis for Opinion
The Company’s management is responsible for maintaining effective internal control over financial reporting and for its assessment of the effectiveness of internal control over financial reporting included in the accompanying Management’s Report on Internal Control over Financial Reporting. Our responsibility is to express an opinion on the Company’s internal control over financial reporting based on our audit. We are a public accounting firm registered with the PCAOB and are required to be independent with respect to the Company in accordance with the U.S. federal securities laws and the applicable rules and regulations of the Securities and Exchange Commission and the PCAOB.
We conducted our audit in accordance with the standards of the PCAOB. Those standards require that we plan and perform the audit to obtain reasonable assurance about whether effective internal control over financial reporting was maintained in all material respects.
Our audit included obtaining an understanding of internal control over financial reporting, assessing the risk that a material weakness exists, testing and evaluating the design and operating effectiveness of internal control based on the assessed risk, and performing such other procedures as we considered necessary in the circumstances. We believe that our audit provides a reasonable basis for our opinion.
Definition and Limitations of Internal Control Over Financial Reporting
A company’s internal control over financial reporting is a process designed to provide reasonable assurance regarding the reliability of financial reporting and the preparation of financial statements for external purposes in accordance with generally accepted accounting principles. A company’s internal control over financial reporting includes those policies and procedures that (1) pertain to the maintenance of records that, in reasonable detail, accurately and fairly reflect the transactions and dispositions of the assets of the company; (2) provide reasonable assurance that transactions are recorded as necessary to permit preparation of financial statements in accordance with generally accepted accounting principles, and that receipts and expenditures of the company are being made only in accordance with authorizations of management and directors of the company; and (3) provide reasonable assurance regarding prevention or timely detection of unauthorized acquisition, use, or disposition of the company’s assets that could have a material effect on the financial statements.
93
Because of its inherent limitations, internal control over financial reporting may not prevent or detect misstatements. Also, projections of any evaluation of effectiveness to future periods are subject to the risk that controls may become inadequate because of changes in conditions, or that the degree of compliance with the policies or procedures may deteriorate.
/s/ Ernst & Young LLP
San Jose, California
February 27, 2023
94
ITEM 9. CHANGES IN AND DISAGREEMENTS WITH ACCOUNTANTS ON ACCOUNTING AND FINANCIAL DISCLOSURE
None.
ITEM 9A. CONTROLS AND PROCEDURES
Disclosure Controls and Procedures
We maintain disclosure controls and procedures that are designed with the objective of providing reasonable assurance that information required to be disclosed in our reports filed under the Exchange Act, such as this Annual Report on Form 10-K is recorded, processed, summarized and reported within the time periods specified in the SEC’s rules and forms, and that such information is accumulated and communicated to our management, including our Chief Executive Officer and Chief Financial Officer, as appropriate, to allow timely decisions regarding required disclosure. In designing and evaluating our disclosure controls and procedures, our management recognizes that any controls and procedures, no matter how well designed and operated, can provide only reasonable assurance of achieving the desired control objectives, and our management is required to apply its judgment in evaluating the cost-benefit relationship of possible controls and procedures.
As of December 31, 2022, the end of the period covered by this report, we carried out an evaluation, under the supervision and with the participation of our management, including our Chief Executive Officer and Chief Financial Officer, of the effectiveness of the design and operation of our disclosure controls and procedures pursuant to Exchange Act Rules 13a-15(e) and 15d-15(e). This type of evaluation is performed on a quarterly basis so that conclusions of management, including our Chief Executive Officer and Chief Financial Officer, concerning the effectiveness of the disclosure controls can be reported in our periodic reports on Form 10-Q and Form 10-K. The overall goals of these evaluation activities are to monitor our disclosure controls and to modify them as necessary. We intend to maintain the disclosure controls as dynamic systems that we adjust as circumstances merit. Based on the foregoing, our Chief Executive Officer and Chief Financial Officer concluded that our disclosure controls and procedures were effective at the reasonable assurance level as of the end of the period covered by this report.
Management’s Report on Internal Control over Financial Reporting
Internal control over financial reporting refers to the process designed by, or under the supervision of, our Chief Executive Officer and Chief Financial Officer, and effected by our Board of Directors, management and other personnel, to provide reasonable assurance regarding the reliability of financial reporting and the preparation of financial statements for external purposes in accordance with U.S. generally accepted accounting principles, and includes those policies and procedures that:
1.Pertain to the maintenance of records that in reasonable detail accurately and fairly reflect the transactions and dispositions of the assets of the Company;
2.Provide reasonable assurance that transactions are recorded as necessary to permit preparation of financial statements in accordance with U.S. generally accepted accounting principles, and that receipts and expenditures of the Company are being made only in accordance with authorizations of management and directors of the Company; and
3.Provide reasonable assurance regarding prevention or timely detection of unauthorized acquisition, use or disposition of the Company’s assets that could have a material effect on the financial statements. Internal control over financial reporting cannot provide absolute assurance of achieving financial reporting objectives because of its inherent limitations.
Internal control over financial reporting is a process that involves human diligence and compliance and is subject to lapses in judgment and breakdowns resulting from human failures. Internal control over financial reporting also can be circumvented by collusion or improper management override. Because of such limitations, there is a risk that material misstatements may not be prevented or detected on a timely basis by internal control over financial reporting. However, these inherent limitations are known features of the financial reporting process. Therefore, it is possible to design into the process safeguards to reduce, though not eliminate, this risk. Management is responsible for establishing and maintaining adequate internal control over financial reporting for the Company.
95
Management has used the 2013 framework set forth in the report entitled “Internal Control—Integrated Framework” published by the Committee of Sponsoring Organizations of the Treadway Commission to evaluate the effectiveness of the Company’s internal control over financial reporting. Management has concluded that the Company’s internal control over financial reporting was effective as of December 31, 2022 at the reasonable assurance level. Our independent registered public accounting firm, Ernst & Young LLP, has issued an attestation report on the Company’s internal control over financial reporting as of December 31, 2022, which is included in Part II, Item 8, above.
Changes in Internal Control over Financial Reporting
There has been no change in our internal controls over financial reporting during our most recently completed fiscal quarter that has materially affected, or is reasonably likely to materially affect, our internal controls over financial reporting. We are currently in the process of integrating the Xilinx and Pensando operations, control processes and information systems into our systems and control environment. We believe that we have taken the necessary steps to monitor and maintain appropriate internal controls over financial reporting during this integration.
ITEM 9B. OTHER INFORMATION
The U.S. government has designated the Russian Federal Security Service (the FSB) as a blocked party under Executive Order 13382. In addition, the U.S. Department of the Treasury’s Office of Foreign Assets Control has issued General License No. 1B (the OFAC General License), which generally authorizes certain licensing, permitting, certification, notification, and related transactions with the FSB as may be required for the importation, distribution, or use of information technology products in the Russian Federation.
As previously disclosed in our Quarterly Report on Form 10-Q for the fiscal quarter ended March 26, 2022, Xilinx, which we acquired on February 14, 2022, previously authorized prior to such acquisition certain third-party resellers in Russia to periodically file notifications with, or apply for import licenses and permits from, the FSB on its behalf in connection with the importation of its products into the Russian Federation, as permitted under the OFAC General License. Subsequent to February 14, 2022, but during the fiscal quarter ended March 26, 2022, third-party resellers filed additional notifications with and/or applied for import licenses and permits from the FSB on behalf of Xilinx. During the fiscal quarter ended March 26, 2022, we and our subsidiaries, including Xilinx, suspended shipments to the Russian Federation.
There was no gross revenue or net profits of ours or any of our subsidiaries directly associated with these filing activities. We and our subsidiaries do not sell products or provide services to the FSB.
ITEM 9C. DISCLOSURE REGARDING FOREIGN JURISDICTIONS THAT PREVENT INSPECTIONS
Not applicable.
96
PART III
ITEM 10. DIRECTORS, EXECUTIVE OFFICERS AND CORPORATE GOVERNANCE
The information under the captions “Item 1—Election of Directors” (including “Consideration of Stockholder Nominees for Director”), “Corporate Governance,” “Meetings and Committees of the Board of Directors,” “Executive Officers” and “Section 16(a) Beneficial Ownership Reporting Compliance” in our proxy statement for our 2023 annual meeting of stockholders (our 2023 Proxy Statement) is incorporated herein by reference. There were no material changes to the procedures by which stockholders may recommend nominees to our board of directors. See also, “Part 1, Item 1-Website Access to Company Reports and Corporate Governance Documents,” above.
ITEM 11. EXECUTIVE COMPENSATION
The information under the captions “Directors’ Compensation and Benefits” (including “2022 Non-Employee Director Compensation”), “Compensation Discussion and Analysis,” “Compensation Policies and Practices,” “Executive Compensation” (including “2022 Summary Compensation Table,” “2022 Nonqualified Deferred Compensation,” “Outstanding Equity Awards at 2022 Fiscal Year-End,” “Grants of Plan-Based Awards in 2022” and “Option Exercises and Stock Vested in 2022) and “Severance and Change in Control Arrangements” in our 2023 Proxy Statement is incorporated herein by reference.
ITEM 12. SECURITY OWNERSHIP OF CERTAIN BENEFICIAL OWNERS AND MANAGEMENT AND
RELATED STOCKHOLDER MATTERS
The information under the captions “Principal Stockholders,” “Security Ownership of Directors and Executive Officers” and “Equity Compensation Plan Information” in our 2023 Proxy Statement is incorporated herein by reference.
ITEM 13. CERTAIN RELATIONSHIPS AND RELATED TRANSACTIONS AND DIRECTOR INDEPENDENCE
The information under the captions “Corporate Governance—Independence of Directors” and “Certain Relationships and Related Transactions” in our 2023 Proxy Statement is incorporated herein by reference.
ITEM 14. PRINCIPAL ACCOUNTING FEES AND SERVICES
The information under the captions “Item 2—Ratification of Appointment of Independent Registered Public Accounting Firm—Independent Registered Public Accounting Firm’s Fees” in our 2023 Proxy Statement is incorporated herein by reference.
With the exception of the information specifically incorporated by reference in Part III of this Annual Report on Form 10-K from our 2023 Proxy Statement, our 2023 Proxy Statement will not be deemed to be filed as part of this report. Without limiting the foregoing, the information under the captions “Compensation Committee Report” and “Audit Committee Report” in our 2023 Proxy Statement is not incorporated by reference in this Annual Report on Form 10-K.
97
PART IV
ITEM 15. EXHIBITS, FINANCIAL STATEMENT SCHEDULES
1. Financial Statements
The financial statements of AMD are set forth in Item 8 of this Annual Report on Form 10-K, as indexed below.
Index to Consolidated Financial Statements
Reports of Independent Registered Public Accounting Firm (PCAOB ID: |
||||||||
All schedules have been omitted because the information is not required, is not applicable, or is included in the Notes to the Consolidated Financial Statements.
2. Exhibits
The exhibits listed in the accompanying Index to Exhibits are filed as part of, or incorporated by reference into, this Annual Report on Form 10-K. The following is a list of such Exhibits:
| Exhibit | Description of Exhibits | ||||||||||
| 2.1 | |||||||||||
| 3.1 | |||||||||||
| 3.2 | |||||||||||
| 4.1 | |||||||||||
| 4.2 | |||||||||||
| 4.3 | |||||||||||
| 4.4 | |||||||||||
98
| 4.5 | |||||||||||
| 4.6 | |||||||||||
| 4.7 | |||||||||||
| 4.8 |
First Supplemental Indenture, dated as of June 9, 2022, by and between the Company and U.S. Bank Trust Company, National Association, as trustee, including the Form of 2032 Note and Form of 2052 Note, filed as exhibit 4.2 to AMD’s Current Report on Form 8-K dated June 9, 2022, is hereby incorporated by reference.
|
||||||||||
| *10.1 | |||||||||||
| *10.2 | |||||||||||
| *10.3 | |||||||||||
| *10.4 | |||||||||||
| *10.5 | |||||||||||
| *10.6 | |||||||||||
| *10.7 | |||||||||||
| *10.8 | |||||||||||
| *10.9 | |||||||||||
| 10.10 | |||||||||||
| **10.11 | |||||||||||
| 10.12 | |||||||||||
99
| 10.13 | |||||||||||
| 10.14 | |||||||||||
| *10.15 | |||||||||||
| *10.16 | |||||||||||
| *10.17 | |||||||||||
| *10.18 | |||||||||||
| *10.19 | |||||||||||
| 10.20 | |||||||||||
| *10.21 | |||||||||||
| *10.22 | |||||||||||
| *10.23 | |||||||||||
| *10.24 | |||||||||||
| *10.25 | |||||||||||
| *10.26 | |||||||||||
| *10.27 | |||||||||||
| *10.28 | |||||||||||
100
| *10.29 | |||||||||||
| *10.30 | |||||||||||
| *10.31 | |||||||||||
| *10.32 | |||||||||||
| *10.33 | |||||||||||
| *10.34 | |||||||||||
| *10.35 | |||||||||||
| *10.36 | |||||||||||
| *10.37 | |||||||||||
| *10.38 | |||||||||||
| *10.39 | |||||||||||
| *10.40 | |||||||||||
| *10.41 | |||||||||||
| *10.42 | |||||||||||
| *10.43 | |||||||||||
101
| *10.44 | |||||||||||
| *10.45 | |||||||||||
| ***10.46 | |||||||||||
| ***10.47 | |||||||||||
| ***10.48 | |||||||||||
| ***10.49 | |||||||||||
| ***10.50 | |||||||||||
| ***10.51 | |||||||||||
| ***10.52 | |||||||||||
| **10.53 | |||||||||||
| 10.54 | |||||||||||
| *10.55 | |||||||||||
| *10.56 | |||||||||||
| *10.57 | |||||||||||
102
| ***10.58 | |||||||||||
| ***10.59 | First Amendment to Amended and Restated Wafer Supply Agreement No. 7, among Advanced Micro Devices, Inc., GLOBALFOUNDRIES, Inc. and GLOBALFOUNDRIES U.S. Inc., dated December 23, 2021, filed as Exhibit 10.63 to AMD’s Annual Report on Form 10-K for the year ended December 25, 2021, is hereby incorporated by reference. |
||||||||||
| 10.60 | |||||||||||
| *10.61 | |||||||||||
| *10.62 | |||||||||||
| *10.63 | |||||||||||
| *10.64 | |||||||||||
| *10.65 | |||||||||||
| *10.66 | |||||||||||
| *10.67 | |||||||||||
| *10.68 | |||||||||||
| 18.1 | |||||||||||
| 21 | |||||||||||
| 23 | |||||||||||
| 24 | |||||||||||
| 31.1 | |||||||||||
| 31.2 | |||||||||||
| 32.1 | |||||||||||
103
| 32.2 | |||||||||||
| 101.INS | XBRL Instance Document -the instance document does not appear in the Interactive Data File because its XBRL tags are embedded within the Inline XBRL document | ||||||||||
| 101.SCH | XBRL Taxonomy Extension Schema Document | ||||||||||
| 101.CAL | XBRL Taxonomy Extension Calculation Linkbase Document | ||||||||||
| 101.DEF | XBRL Taxonomy Extension Definition Linkbase Document | ||||||||||
| 101.LAB | XBRL Taxonomy Extension Label Linkbase Document | ||||||||||
| 101.PRE | XBRL Taxonomy Extension Presentation Linkbase Document | ||||||||||
| 104 | Cover Page Interactive Data File -the Cover Page Interactive Data File does not appear in the Interactive Data File because its XBRL tags are embedded within the Inline XBRL document | ||||||||||
_____________________
* Management contracts and compensatory plans or arrangements.
** Portions of this exhibit have been omitted pursuant to a request for confidential treatment, which has been granted. These portions have been filed separately with the SEC.
*** Portions of this exhibit have been omitted because they are both (i) not material and (ii) would be competitively harmful if publicly disclosed.
AMD will furnish a copy of any exhibit on request and payment of AMD’s reasonable expenses of furnishing such exhibit.
ITEM 16. FORM 10-K SUMMARY
Not applicable.
104
SIGNATURES
Pursuant to the requirements of Section 13 or 15(d) of the Securities Exchange Act of 1934, the registrant has duly caused this report to be signed on its behalf by the undersigned, thereunto duly authorized.
| February 27, 2023 |
ADVANCED MICRO DEVICES, INC.
|
||||||||||
| By: | /s/ Lisa T. Su | ||||||||||
| Lisa T. Su | |||||||||||
| Chair, President and Chief Executive Officer | |||||||||||
Pursuant to the requirements of the Securities Exchange Act of 1934, this report has been signed below by the following persons, on behalf of the registrant and in the capacities and on the dates indicated.
| Signature | Title | Date | |||||||||||||||
| /s/Lisa T. Su | President and Chief Executive Officer (Principal Executive Officer), Director |
February 27, 2023 | |||||||||||||||
| Lisa T. Su | |||||||||||||||||
| /s/Jean Hu | Executive Vice President, Chief Financial Officer and Treasurer (Principal Financial Officer) |
February 27, 2023 | |||||||||||||||
| Jean Hu | |||||||||||||||||
| /s/Darla Smith | Corporate Vice President, Chief Accounting Officer (Principal Accounting Officer) | February 27, 2023 | |||||||||||||||
| Darla Smith | |||||||||||||||||
| * | Lead Independent Director | February 27, 2023 | |||||||||||||||
| Nora M. Denzel | |||||||||||||||||
| * | Director | February 27, 2023 | |||||||||||||||
| Mark Durcan | |||||||||||||||||
| * | Director | February 27, 2023 | |||||||||||||||
| Mike P. Gregoire | |||||||||||||||||
| * | Director | February 27, 2023 | |||||||||||||||
| Joe A. Householder | |||||||||||||||||
| * | Director | February 27, 2023 | |||||||||||||||
| John W. Marren | |||||||||||||||||
| * | Director | February 27, 2023 | |||||||||||||||
| Jon A. Olson | |||||||||||||||||
| * | Director | February 27, 2023 | |||||||||||||||
| Abhi Y. Talwalkar | |||||||||||||||||
| * | Director | February 27, 2023 | |||||||||||||||
| Beth W. Vanderslice | |||||||||||||||||
| *By: | /s/Lisa T. Su | ||||
| Lisa T. Su, Attorney-in-Fact | |||||
105