10-K: Annual report [Section 13 and 15(d), not S-K Item 405]
Published on February 4, 2026
UNITED STATES SECURITIES AND EXCHANGE COMMISSION
Washington, D.C. 20549
FORM 10-K
(Mark One)
| ANNUAL REPORT PURSUANT TO SECTION 13 OR 15(d) OF THE SECURITIES EXCHANGE ACT OF 1934. | |||||
For the fiscal year ended | |||||
| OR | |||||
| TRANSITION REPORT PURSUANT TO SECTION 13 OR 15(d) OF THE SECURITIES EXCHANGE ACT OF 1934. | |||||
For the transition period from to | |||||
Commission File Number 001-07882

(Exact name of registrant as specified in its charter)
| (State or other jurisdiction of incorporation or organization) | (I.R.S. Employer Identification No.) | ||||
(Address of principal executive offices)(Zip Code)
(408 ) 749-4000
(Registrant’s telephone number, including area code)
Securities registered pursuant to Section 12(b) of the Act:
| (Title of each class) | (Trading symbol) | (Name of each exchange on which registered) | ||||||
Securities registered pursuant to Section 12(g) of the Act:
None
Indicate by check mark if the registrant is a well-known seasoned issuer, as defined in Rule 405 of the Securities Act. Yes ☑ No ☐
Indicate by check mark if the registrant is not required to file reports pursuant to Section 13 or Section 15(d) of the Exchange Act. Yes ☐ No ☑
Indicate by check mark whether the registrant (1) has filed all reports required to be filed by Section 13 or 15(d) of the Securities Exchange Act of 1934 during the preceding 12 months (or for such shorter period that the registrant was required to file such reports), and (2) has been subject to such filing requirements for the past 90 days. Yes ☑ No ☐
Indicate by check mark whether the registrant has submitted electronically every Interactive Data File required to be submitted pursuant to Rule 405 of Regulation S-T during the preceding 12 months (or for such shorter period that the registrant was required to submit such files): Yes ☑ No ☐
Indicate by check mark whether the registrant is a large accelerated filer, an accelerated filer, a non-accelerated filer, a smaller reporting company, or an emerging growth company. See the definitions of “large accelerated filer,” “accelerated filer,” “smaller reporting company,” and “emerging growth company” in Rule 12b-2 of the Exchange Act.
| ☑ | Accelerated filer | ☐ | Non-accelerated filer | ☐ | Smaller reporting company | Emerging growth company | |||||||||||||||||||||||
If an emerging growth company, indicate by check mark if the registrant has elected not to use the extended transition period for complying with any new or revised financial accounting standards provided pursuant to Section 13(a) of the Exchange Act. ☐
Indicate by check mark whether the registrant has filed a report on and attestation to its management’s assessment of the effectiveness of its internal control over financial reporting under Section 404(b) of the Sarbanes-Oxley Act (15 U.S.C.7262(b)) by the registered public accounting firm that prepared or issued its audit report. ☑
If securities are registered pursuant to Section 12(b) of the Act, indicate by check mark whether the financial statements of the registrant included in the filing reflect the correction of an error to previously issued financial statements. ☐
Indicate by check mark whether any of those error corrections are restatements that required a recovery analysis of incentive-based compensation received by any of the registrant’s executive officers during the relevant recovery period pursuant to §240.10D-1(b). ☐
Indicate by check mark whether the registrant is a shell company (as defined by Rule 12b-2 of the Exchange Act). Yes ☐ No ☑
As of June 28, 2025, the aggregate market value of the registrant’s common stock held by non-affiliates of the registrant was approximately $232.3 billion based on the reported closing sale price of $143.81 per share as reported on The NASDAQ Global Select Market (NASDAQ) on June 27, 2025, which was the last business day of the registrant’s most recently completed second fiscal quarter.
Indicate the number of shares outstanding of each of the registrant’s classes of common stock, as of the latest practicable date: 1,630,410,843 shares of common stock, $0.01 par value per share, as of January 30, 2026.
DOCUMENTS INCORPORATED BY REFERENCE
INDEX
ITEM 6. | ||||||||
PART I
ITEM 1. BUSINESS
Cautionary Statement Regarding Forward-Looking Statements
The statements in this report include forward-looking statements within the meaning of the Private Securities Litigation Reform Act of 1995. These forward-looking statements are based on current expectations and beliefs and involve numerous risks and uncertainties that could cause actual results to differ materially from expectations. These forward-looking statements speak only as of the date hereof or as of the dates indicated in the statements and should not be relied upon as predictions of future events, as we cannot assure you that the events or circumstances reflected in these statements will be achieved or will occur. You can identify forward-looking statements by the use of forward-looking terminology including “believes,” “expects,” “may,” “will,” “should,” “seeks,” “intends,” “plans,” “pro forma,” “estimates,” “anticipates,” or the negative of these words and phrases, other variations of these words and phrases or comparable terminology. The forward-looking statements relate to, among other things: possible impact of future accounting rules on AMD’s consolidated financial statements; demand for AMD’s products; AMD’s strategy and expected benefits; the growth, change and competitive landscape of the markets in which AMD participates; international sales will continue to be a significant portion of total sales in the foreseeable future; the expectation that AMD’s cash, cash equivalents, and short-term investments together with the availability under that certain revolving credit facility (the Revolving Credit Agreement) made available to AMD and certain of its subsidiaries, our commercial paper program, and our cash flows from operations will be sufficient to fund AMD’s operations, including capital expenditures, purchase and lease commitments and strategic activities over the next 12 months and beyond; AMD’s ability to obtain sufficient external financing on favorable terms, or at all; AMD’s expectation that based on management’s current knowledge, the potential liability related to AMD’s current litigation will not have a material adverse effect on its financial position, results of operation or cash flows; anticipated ongoing and increased costs related to enhancing and implementing information security controls; revenue allocated to remaining performance obligations that are unsatisfied which will be recognized in the next 12 months; a small number of customers will continue to account for a substantial part of AMD’s revenue and receivables in the future; the expected implications from the development of the legal and regulatory environment relating to emerging technologies such as AI; AMD’s expectation to utilize the cloud service capacity in its operations or assign the capacity; AMD’s expectation that it will not pay dividends in the near future; AMD’s ability to achieve its corporate responsibility initiatives; expected future AI technology trends and developments; the expected benefits of AMD’s acquisitions; and AMD’s expectation to fund stock repurchases through cash generated from operations. For a discussion of the factors that could cause actual results to differ materially from the forward-looking statements, see “Part I, Item 1A—Risk Factors” and the “Financial Condition” section set forth in “Part II, Item 7-Management’s Discussion and Analysis of Financial Condition and Results of Operations,” or MD&A, and such other risks and uncertainties as set forth below in this report or detailed in our other Securities and Exchange Commission (SEC) reports and filings. We assume no obligation to update forward-looking statements.
Additionally, we make certain voluntary disclosures in this report and on our website, which are informed by various standards and frameworks (including standards for the measurement of underlying data), and the interests of various stakeholders. As such, these voluntary disclosures may not necessarily be “material” under the federal securities laws for SEC reporting purposes. Furthermore, much of this information is subject to methodological considerations or information, including from third-parties, that is still evolving and subject to change, and which AMD does not independently verify. For example, our disclosures based on any standards may change due to revisions in framework requirements, availability of information, changes in our business or applicable government policies, or other factors, some of which may be beyond our control.
1
References in this Annual Report on Form 10-K to “AMD,” “we,” “us,” “management,” “our” or the “Company” mean Advanced Micro Devices, Inc. and our consolidated subsidiaries.
Overview
AMD drives innovation in high performance and AI computing to solve the world’s most important challenges. AMD technology powers billions of experiences across cloud and AI infrastructure, embedded systems, AI PCs and gaming. With a broad portfolio of AI-optimized CPUs, GPUs, networking and software, AMD delivers full-stack solutions that help customers turn data into breakthroughs, with the speed and scale needed for a new era of intelligent computing. Our high-performance product portfolios provide differentiated solutions, including semi-custom System-on-Chip (SoCs), adaptive SoCs and accelerated processing units (APUs). For data centers, we offer AI accelerators, microprocessors (CPUs), graphic processing units (GPUs), data processing units (DPUs), AI Network Interface Cards (AI NICs) and field programmable gate arrays (FPGAs). We offer ultra-low latency networking solutions. We also offer data center rack-scale platform designs that incorporate AMD data center products to meet the growing performance demands of AI supercomputers and machine learning workloads. In client computing, our CPUs, APUs and chipsets for desktops and notebooks deliver performance, efficiency, AI capabilities and modern security features for gamers, creators, consumers and enterprises. AMD was the first company to integrate a dedicated neural processing unit (NPU) on the same SoC as an x86 CPU for AI PCs. By bringing NPU‑accelerated AI capabilities directly into mainstream x86 platforms, we established a differentiated technology footprint that supports a growing ecosystem of AI‑enabled applications and lays the groundwork for the multi‑generation Ryzen™ AI roadmap that continues to expand our leadership. Our GPUs, including discrete GPUs and semi-custom SoCs, are combined with software to power immersive gaming experiences across PCs, game consoles and cloud gaming services. Our embedded computing portfolio delivers high-performance, scalable solutions across CPUs, APUs, FPGAs, System-on-Modules (SOMs) and adaptive SoCs for markets such as automotive, industrial, healthcare, storage and networking with integrated AI processing capabilities.
We develop comprehensive software stacks that include development tools, compilers and drivers to enable our high-performance CPUs, APUs, GPUs and FPGAs. We have a comprehensive and open AI software stack to support the diverse set of AI ecosystems across frameworks, large and small language models and applications. By working closely with customers, we deliver customized solutions that meet their evolving needs, leveraging our broad IP portfolio and leadership in design, integration and advanced packaging. Our investments in technologies such as our custom-ready chiplet platform and AMD Infinity Fabric™ switch position us to maintain our leadership as a custom-design silicon provider of choice.
Our Strategy
We believe AI is shaping the next era of computing and its full potential will be realized when it becomes pervasive across cloud, edge and endpoint devices. With our compute engines, intellectual property, software enablement and deep expertise, AMD is positioned to lead in this next computing era. Our broad portfolio spans supercomputing, cloud, edge, embedded and end devices, providing the unique opportunity to make AMD the end-to-end AI leader.
In 2025, a key priority was accelerating growth in our Data Center segment. Demand for our data center AI accelerator products was strong as large hyperscale customers, OEMs and ODMs deployed our AMD Instinct™ MI350X Series GPUs. We advanced our AMD AI GPU roadmap to deliver an annual cadence of leadership for AMD Instinct solutions, beginning with the AMD Instinct MI350 Series GPUs in 2025. Beyond GPUs, we launched the 5th Gen AMD EPYC™ family of server processors in 2025, which deliver leadership performance and capabilities for a wide range of data center workloads, including AI. In addition, we previewed our “Helios” AI rack-scale platform solution that incorporates all of our data center products (CPUs, GPUs and Networking) to address the growing AI compute requirements.
We strengthened our AI leadership through a number of strategic acquisitions during the year. In March 2025, we acquired ZT Group Int’l, Inc. (ZT Systems), where we retained certain intellectual property and employees associated with the design operations (ZT Design Business). This acquisition enables us to deliver end-to-end AI solutions and accelerate the design and deployment of AMD-powered AI infrastructure at scale optimized for the cloud. In October 2025, we sold the ZT data center infrastructure manufacturing business (ZT Manufacturing Business) to Sanmina Corporation (Sanmina). We made other strategic acquisitions during the year to advance our software capabilities and enable highly optimized solutions across the stack, support co-packaged optics solutions for next-generation AI systems, and bring deep expertise in high-speed inference and reasoning-based AI technologies for large-scale deployments.
2
We believe that AI systems will require not only powerful chips, but also full-stack innovation across compute, networking, systems architecture and software. AMD is uniquely positioned to deliver across this stack, combining industry-leading CPUs, GPUs and adaptive SoCs with networking, software and system integration expertise. We continue to invest in software capabilities and the open ecosystem through the AMD ROCm™ platform, delivering new features for high-performance AI training and inference. In 2025, we introduced key optimizations and expanded support for frameworks and libraries, improving performance for generative AI workloads and simplifying the developer experience.
In October 2025, we entered into a product purchase agreement with OpenAI OpCo, LLC, (OpenAI) to deploy 6 gigawatts of AMD GPUs, with the deployment of the first gigawatt of capacity powered by our AMD Instinct MI450 series products. This multiyear strategic partnership with OpenAI demonstrates our continued execution of hardware, software and full-stack solutions roadmaps.
Our Business
Beginning in the first quarter of fiscal year 2025, we combined the Client and Gaming segments into one reportable segment to align with how we manage our business. All prior period segment data were retrospectively adjusted.
Our three reportable segments are:
•the Data Center segment, which primarily includes AI accelerators, CPUs for servers, GPUs, APUs, DPUs, AI NICs, FPGAs and SoC products for data centers;
•the Client and Gaming segment, which primarily includes CPUs, APUs, chipsets for desktops and notebooks, discrete GPUs, and semi-custom SoC products and development services; and
•the Embedded segment, which primarily includes embedded CPUs, APUs, FPGAs, SOMs, and adaptive SoC products.
From time to time, the Company may also sell or license portions of its IP portfolio.
In addition to these reportable segments, we have an All Other category, which is not a reportable segment.
Data Center Segment
Data Center Market
The Data Center segment primarily includes server-class CPUs, GPUs, AI accelerators, DPUs, AI NICs, FPGAs, and adaptive SoC products. We leverage our technology to address the computational, visual data processing and AI workload acceleration needs in the data center market. Modern data centers require high performance, energy efficient, scalable and adaptable compute engines to meet the demand driven by the growing amount of data that needs to be stored, accessed, analyzed and managed. Different combinations of CPUs, GPUs, DPUs, AI NICs, FPGAs and adaptive SoCs enable the optimization of performance and power for a diverse set of workloads.
Data Center Products
Server CPUs. Our CPUs for server platforms currently include the AMD EPYC™ Series processors. EPYC CPUs, which are based on the x86 architecture, are server-specific processors designed for high-performance computing, enterprise IT, supercomputing, and large data centers. Our 5th generation AMD EPYC family of server processors delivers improved performance and efficiency for AI, cloud and enterprise workloads.
Data Center GPUs. Our AMD Instinct™ family of GPU products, including AMD Instinct MI200, MI300, MI325 and MI350 series, are based on AMD CDNA™ architecture and designed for AI training, inference and exascale-class scientific computing. We also announced next-generation AMD Instinct MI355X GPUs for large-scale AI deployments. Our visual cloud GPU offerings include products in the AMD Radeon™ PRO V families. Our visual cloud data center GPUs include a range of solutions tailored towards workloads requiring remote visualization, such as Desktop-as-a-Service, Workstation-as-a-Service and Cloud Gaming.
FPGAs and Adaptive SoCs. We offer a wide range of FPGAs, adaptive SoCs and acceleration cards for the data center. Devices include the Virtex™, Kintex™, Artix™, and Spartan™ FPGA products, as well as Zynq™ and Versal™ adaptive SoCs. Our Alveo™ accelerator cards provide a platform for accelerating multiple data center workloads at the edge or in the cloud.
3
Networking Products. Our AMD Pensando™ DPUs and comprehensive networking software stack offload data center infrastructure services from the host CPU and are used by large Infrastructure as a Service (IaaS) cloud providers to accelerate workload performance for hosted virtualized and bare-metal offerings. We introduced our AMD Pensando “Pollara” 400 AI NICs and “Vulcano” AI NICs, which deliver high-speed connectivity across GPU clusters providing high-performance, AI-ready, flexible solutions for scale-out networking.
The AMD Solarflare™ portfolio continues to offer low latency networking solutions for capital markets, including hardware adapters and the Onload™ user space networking libraries.
Client and Gaming Segment
Client Business
Client Market
Our CPUs and APUs power PCs that are an integral part of how customers work, learn and play. The Client market encompasses the global personal computing ecosystem, including desktop and notebook PCs sold primarily through OEMs, distributors and select direct customers. Our products consist mainly of x86 CPUs and APUs marketed under the AMD Ryzen™ and AMD Ryzen™ AI brands for consumer, commercial and enthusiast segments. Our customers focus on a combination of performance, efficiency, reliability, and value that aligns with their specific use cases. We built a leadership roadmap across these areas and are continuing to further differentiate end user experiences by infusing AI across our portfolio.
Client Products
Desktop CPUs. Our desktop CPU and APU offerings include the AMD Ryzen™ and AMD Ryzen Threadripper™ processors. The Ryzen 9000 Series processors feature “Zen 5” cores, along with X3D models featuring 2nd generation AMD 3D V-Cache™ technology for leadership gaming performance. In 2025, we launched processors for gaming and content creation with Ryzen 9 9950X3D and Ryzen 9 9900X3D. In January 2026, we announced the Ryzen 7 9850X3D, in addition to our Ryzen 7 9800X3D series. Our Ryzen Threadripper™ 9000 Series processors for professional workstations feature increased core counts, expanded memory bandwidth and updated platform capabilities. Our portfolio also includes a broad range of Ryzen 9000 and Ryzen series desktop processors featuring a wide range of capabilities and price points for the growing Socket AM5 platform. In 2025, we released additional AMD Ryzen G Series processors with integrated advanced graphics to extend the longevity of the Socket AM4 platform.
Notebook CPUs. Our latest mobile processors are designed to deliver premium laptop experiences with local AI. In 2025, we launched AMD Ryzen AI 300 Series processors featuring a next generation NPU supporting Microsoft Copilot+ PCs, our latest “Zen 5” architecture and our AMD RDNA™ 3.5 graphics architecture. In January 2026, we launched our Ryzen AI 400 series processors, the next generation of processors for AI PCs. Building on our AI PC momentum, we expanded our portfolio by introducing Ryzen AI-powered platforms across notebooks and mini desktops and introduced a new reference platform for AI developers in January 2026, the Ryzen AI Halo, that features up to 128GB of memory for large AI model support. We also expanded the Ryzen AI Max processor lineup with the Ryzen AI Max+392 and Ryzen AI Max+388 to enable wider price points for our maximum GPU configurations. Our AMD Ryzen 8000 Series mobile processors, built on the “Zen 4” architecture feature our first generation NPU, and our Ryzen 10 and 100 series mobile processors, powered by both our “Zen 2” and “Zen 3+” core architectures, all address mainstream consumer and commercial markets. For handheld gaming systems, our Ryzen Z1 Series continues to deliver immersive experiences, and we introduced the Ryzen Z2 Series, bringing higher efficiency and improved graphics performance for portable gaming devices including the new Asus ROG Xbox Ally.
4
Commercial CPUs. AMD Ryzen PRO solutions deliver enterprise-class security, manageability, and reliability for commercial client PCs including business notebooks, desktops, and workstations. In 2025, we reinforced our leadership in commercial computing with new Ryzen PRO offerings that integrate AI capabilities, delivering performance, mobility, and enterprise features for our customers. Our AMD Ryzen AI PRO 300 Series, brings world-class security and manageability, with leadership productivity, battery life and AI capabilities to business notebooks and mobile workstations. With the announcement of our Ryzen AI 400 PRO Series, we continued to expand our next gen AI PC leadership and offerings. In 2025, we also launched the AMD Ryzen PRO 200 Series mobile processors that expand our commercial CPU portfolio enabling high performance PCs spanning a range of price points. For desktops, the AMD Ryzen PRO 8000G Series desktops offer an integrated AI solution for enterprises, and our AMD Ryzen Threadripper PRO CPU enables leadership performance, expanded memory bandwidth and platform reliability for premium workstations.
Chipsets. We offer a full suite of chipset products to support our AMD Ryzen and AMD Ryzen Threadripper platforms, for entry level through professional workstation desktop systems. These chipsets complement our latest CPU innovations, supporting robust connectivity and scalability for diverse client computing needs.
Gaming Business
Graphics Market
Graphics processing is a fundamental component across many of our products. Our customers generally use our graphics solutions to enable immersive visualization and to process AI/ML based workloads. We develop our graphics products for use in various computing devices and entertainment platforms, including data centers, desktop PCs, notebook PCs, handheld devices, All-in-Ones and professional workstations. In addition, we leverage our core IP, including graphics and processing technologies, to develop semi-custom solutions deeply co-engineered with our customers, which has enabled many of today’s leading gaming consoles and handheld gaming products.
Semi-Custom Products. Our semi-custom products are tailored, high-performance, customer-specific solutions based on CPU, GPU and multi-media technologies. We work closely with our customers to define solutions precisely matching their system requirements. AMD semi-custom SoC products power the Sony PlayStation® 5, the Microsoft® Xbox Series S™ and X™ game consoles, as well as the recently revealed Valve Steam Machine PC.
Discrete Desktop and Notebook GPUs. Our AMD Radeon RX discrete GPU processors for PCs power the latest gaming and creation platforms. In 2025, we released our Radeon RX 9000 Series graphics cards, based on a new AMD RDNA™ 4 architecture, designed for increased AI performance, new levels of ray tracing capabilities and enhanced performance per watt to deliver new levels of performance for gamers and creators. All of our graphics products are supported by the AMD software: Adrenalin Edition™ application, which is regularly enhanced to provide the latest in performance, features, and stability. We also released FSR “Redstone” gaming technologies to integrate Machine Learning for improved performance and visuals on our Radeon RX 9000 graphics cards.
Professional GPUs. Our AMD Radeon PRO family of professional graphics products are designed for integration in desktop workstations, optimized through hardware and software for demanding use cases such as 3D rendering, design and manufacturing for Computer-Aided Design (CAD), and media and entertainment for broadcast and animation pipelines on high resolution displays. In 2025, we launched our Radeon AI PRO R9000 Series of graphics cards, intended for local AI inference and creative workloads enabling professionals to accelerate AI-driven content creation and advanced visualization tasks directly on their workstation.
5
Embedded Segment
The Embedded Market
The Embedded segment primarily includes embedded CPUs, APUs, FPGAs, and adaptive SoC products. Embedded products address computing needs in aerospace and defense, automotive, industrial, vision and healthcare, communications infrastructure, test and measurement, emulation and prototyping, audio, video and broadcasting, and data center. Typically, our embedded products are used in applications that require varying levels of performance, where key features may include relatively low power, small form factors, and 24x7 operations. High-performance graphics are important in some embedded systems. Support for Linux®, Windows® and other operating systems as well as for increasingly sophisticated applications are also critical for some customers. Other requirements may include meeting rigid specifications for industrial temperatures, shock, vibration and reliability. The embedded market has moved from developing proprietary, custom designs to leveraging industry-standard instruction set architectures and processors to help reduce cost and speed time to market.
Embedded Products
Embedded CPUs and APUs. Our embedded portfolio expanded in 2025 with the introduction of three new AMD EPYC embedded processor series: AMD EPYC Embedded 9005 Series, EPYC Embedded 4005 Series processors and EPYC Embedded 2005 Series. These new series deliver enhanced performance and extended lifecycles for networking, storage, and edge server applications. We also launched the AMD Ryzen Embedded 9000 Series processors, offering performance-per-watt and low latency for automation systems and machine vision applications. In January 2026, we introduced a new family of Ryzen AI Embedded series processors with two new series: the Ryzen AI Embedded P100 and Ryzen AI Embedded X100 Series. These additions complement our existing AMD EPYC Embedded CPUs and AMD Ryzen Embedded Series processors including V-Series APUs and CPUs and R-Series APUs and CPUs. Our embedded solutions are designed to support high performance compute, high-bandwidth network connectivity and security, high-performance storage requirements for enterprise and cloud infrastructure, 3D graphics performance and 4K multimedia requirements of automotive infotainment systems.
FPGAs and Adaptive SoCs. Our FPGA products are hardware-customizable devices that can be tailored to meet the specific needs of each customer, enabling them to differentiate their products and accelerate time to market. Our FPGA families include AMD UltraScale+™, UltraScale™ 7 Series, and other earlier series. Adaptive SoC products include the AMD Zynq™ SoC and Zynq UltraScale+ Multi-Processing System-on-a-Chip (MPSoC), which combine FPGA technology with a heterogeneous processing system, as well as the industry’s first RFSoC architecture with integrated radio frequency (RF) data converters (Zynq UltraScale+ RFSoC and Zynq RFSoC DFE). The AMD Versal™ portfolio, composed of software-programmable adaptive SoCs, is a heterogeneous compute platform that combines a processing system, programmable logic, AI Engines, and digital signal processing (DSP) Engines. The Versal devices achieve dramatic system-level performance improvements over today's fastest FPGA competitors’ solutions and accelerate applications in a wide variety of markets, including aerospace and defense, automotive, industrial, vision and healthcare, communications infrastructure, test and measurement, emulation and prototyping, audio, video and broadcasting, and data center. Our Versal RF Series delivers compute performance for aerospace and defense applications. We introduced our Versal Premium Series Gen 2, the first adaptive compute devices supporting next-generation CXL® and PCIe® connectivity.
Development Boards, Kits and Configuration Products. We offer development kits for all our FPGA and adaptive SoCs. These kits include hardware, development tools, IP, and reference designs that streamline and accelerate the development of domain-specific and market-specific applications. We continue to enhance developer productivity with expanded support for AMD Kria™ SOMs and starter kits, enabling rapid prototyping and deployment for motor control and edge AI applications. Our Kria K24 SOM provides high determinism and low latency for powering electric drives and motor controllers used in compute-intensive DSP applications at the edge. Coupled with our Kria KD240 Drives Starter Kit, an out-of-the-box-ready motor control-based development platform, the products offer a seamless path to production deployment.
6
Design Platforms and Services
Adaptable Platforms. We offer two types of platforms that support our customers' designs and reduce their development efforts: FPGAs and adaptive SoCs. FPGAs feature reconfigurable hardware as well as integrated memory, DSP, analog mixed signal, high-speed serial transceivers and networking cores coupled with advanced software for a broad range of applications in all of our end markets. Our adaptive SoCs feature a heterogeneous processing system with integrated programmable hardware fabric targeting embedded systems that need real-time control, analytics, sensor fusion and adaptable hardware for differentiation and acceleration. Our Zynq UltraScale+ RFSoCs feature integrated high-performance RF data converters targeting wireless, radar and cable access applications. Enabled by both hardware and software design tools and an extensive operating system, middleware, software stack and IP ecosystem, adaptive SoCs target software developers as well as traditional hardware designers. Our Versal portfolio combines a processing system, programmable logic, AI Engines, and DSP Engines with leading-edge memory and interfacing technologies to deliver powerful heterogeneous acceleration for any application. This product portfolio is ideally suited to accelerate a broad set of applications in the emerging era of big data and AI.
Software Development Platform. Our AMD Vivado™ Design Suite provides hardware design teams with the tools and methodology needed to program FPGAs and adaptive SoCs. Our Vitis™ unified software platform enables the development and deployment of embedded software and accelerated applications on our FPGAs and adaptive SoCs. Our Vitis AI unified software platform enables the development and deployment of AI software on our FPGAs and adaptive SoCs.
Sales and Marketing
We sell our products via a direct sales force, our OEMs (as described in detail below) and through independent distributors and sales representatives in both domestic and international markets. Our sales arrangements generally operate on the basis of product forecasts provided by the particular customer, but do not typically include any commitment or requirement for minimum product purchases. We use purchase orders and related documents, and contractual agreements as evidence of our sales arrangements. Our agreements typically contain standard terms and conditions covering matters such as payment terms, warranties and indemnities for issues specific to our products.
We generally warrant that our products sold to our customers will conform to our approved specifications and be free from defects in material and workmanship under normal use and conditions for one year. We offer up to three-year limited warranties for certain product types and sometimes provide other warranty periods based on negotiated terms with certain customers.
We market and sell our latest products under the AMD trademark.
Our product brand for server microprocessors is AMD EPYC™ processors.
Our product brands for data center graphics are AMD Instinct™ accelerators and AMD Radeon™ PRO V Series.
Our product brands for data center networking are AMD Pensando™ Pollara 400 AI NIC and AMD Pensando Salina DPU.
Our product brand for low-latency adapters for FinTech is AMD Solarflare™ adapters.
Our client product brands for desktop and notebook PCs include: AMD Ryzen™, AMD Ryzen™ AI, AMD Ryzen™ PRO, AMD Ryzen™ Threadripper™, AMD Ryzen™ Threadripper™ PRO, AMD Athlon™, and AMD PRO A-Series processors.
Our product brand for the consumer graphics market is AMD Radeon™ graphics, and AMD Embedded Radeon graphics is our product brand for the embedded graphics market.
Our product brand for professional graphics products is AMD Radeon™ PRO graphics.
We also market and sell our chipsets under AMD trademarks.
Our FPGA products are Virtex™ 6, Virtex 7, Virtex UltraScale+, Kintex™ 7, Kintex UltraScale™, Kintex UltraScale+, Artix™ 7, Artix UltraScale+, Spartan™ 6, and Spartan 7 brands.
7
Our product brands for adaptive SoCs are Zynq™ 7000, Zynq UltraScale+™ MPSoC, Zynq UltraScale+ RFSoCs, Versal™ HBM, Versal Premium, Versal Prime, Versal™ AI Core and Versal AI Edge.
The software tools for our programmable devices are Vitis™, Vitis AI™, and Vivado™ tools.
Our System-on-Module (SOM) product is the Kria™ brand.
We also sell low-power versions of our AMD Athlon™, as well as AMD Geode™, AMD Ryzen™, AMD EPYC™,
AMD R Series and G Series processors as embedded processor solutions.
Our compute and network acceleration board products are sold under the Alveo™ and Pensando™ brands.
We market our products through direct marketing and co-marketing programs. In addition, we have cooperative advertising and marketing programs with customers and third parties, including market development programs, pursuant to which we may provide product information, training, marketing materials and funds. Under our co-marketing development programs, eligible customers can use market development funds as reimbursement for advertisements and marketing programs related to our products and third-party systems integrating our products, subject to meeting defined criteria.
Customers
Our Data Center Segment customers consist primarily of hyperscale data centers, original equipment manufacturers (OEMs), original design manufacturers (ODMs), system integrators and independent distributors in both domestic and international markets. ODMs provide design and/or manufacturing services to branded and unbranded private label resellers, OEMs and system builders.
Our Client and Gaming Segment customers consist primarily of PC OEMs, a network of independent distributors and, for chipset products, ODMs that manufacture motherboards. PC OEMs and independent distributors as well as add-in-board manufacturers (AIBs), independent game console and portable gaming devices manufacturers and contract manufacturers for AMD branded graphics cards.
Our Embedded Segment products are sold to customers in a very wide range of markets such as aerospace and defense, automotive, industrial, vision and healthcare, communications infrastructure, test and measurement, emulation and prototyping, audio, video and broadcasting and data center. For these products, we either sell directly to our customers or through a network of distributors and OEM partners. We are also developing a network of Value Added Resellers (VARs) and Integrated Solution Vendors (ISVs) for our Alveo products.
We work closely with our customers to define product features, performance and timing of new products so that the products we are developing meet our customers’ needs. We also employ application engineers to assist our customers in designing, testing and qualifying system designs that incorporate our products. We believe that our commitment to customer service and design support improves our customers’ time to market and fosters relationships that encourage customers to use the next generation of our products.
We also work with our customers to create differentiated products that leverage our CPU, GPU, APU, DPU, AI NIC, and FPGA technology. Certain customers pay us non-recurring engineering fees for design and development services and a purchase price for the resulting products.
Original Equipment Manufacturers
We focus on three types of OEM partners: multi-nationals, selected regional accounts and selected global and local system integrators, who target commercial and consumer end customers of all sizes. Large multi-nationals and regional accounts are the core of our OEM partners’ business; however, we are increasingly focused on the VAR channel, which resells OEM systems to the mid-market and the small and medium business (SMB) segments. Additionally, we have increased our focus on global system integrators, which resell OEM systems, coupled with their software and services solutions into Enterprise, High Performance Computing (HPC) and Cloud Service Provider customers. Our OEM customers include numerous foreign and domestic manufacturers of servers and workstations, desktops, notebooks, PC motherboards and game consoles.
8
Hyperscale Data Centers
Large multi-national public cloud service providers and hyperscale private data centers directly and indirectly purchase a substantial portion of our data center-focused products, including server CPUs, GPU accelerators, DPUs, AI NICs, FPGAs and adaptive SoCs. These products are incorporated into servers and other data center appliances sold by OEMs to the hyperscale customers or into custom servers or hardware designed by or for these customers and manufactured by ODMs or contract manufacturers. Hyperscale data centers use these products to operate web-based applications or to support public cloud computing and storage service offerings, including but not limited to AI workloads such as generative AI models.
Third-Party Distributors
Our authorized channel distributors resell to sub-distributors, OEMs, ODMs and other customers. Typically, distributors handle a wide variety of products, and may include products from other manufacturers that compete with our products. Distributors typically maintain an inventory of our products. In most instances, our agreements with distributors protect their inventory of our products against price reductions and provide certain return rights with respect to any product that we have removed from our price book or are otherwise subject to discontinuation. In addition, some agreements with our distributors may contain standard stock rotation provisions permitting limited product returns.
Add-in-Board (AIB) Manufacturers and System Integrators
We offer component-level graphics and chipset products to AIB manufacturers who in turn build and sell board-level products using our technology to system integrators (SIs), retailers and sub distributors. In most instances, our agreements with AIBs protect their inventory of our products against price reductions. We also sell directly to some SI customers. SIs typically sell from positions of regional or product-based strength in the market. They usually operate on short design cycles and can respond quickly with new technologies. SIs often use discrete graphics solutions as a means to differentiate their products and add value to their customers.
Competition
The markets in which our products are sold are highly competitive and rapidly evolving and delivering the latest and best products to market on time is critical to revenue growth. The competitiveness of our products depends on a number of factors including, performance, total cost of ownership, timely product introductions, product quality and reliability, product features and capabilities, energy efficiency (including power consumption and battery life, given their impact on total cost of ownership), size (or form factor), selling price, cost, adherence to industry standards (and the creation of open industry standards), level of integration, software and hardware compatibility, ease of use and functionality of software design tools, completeness of applicable software solutions, security and stability, brand recognition and availability. Competition is expected to remain intense, driven by rapid technological change, evolving standards, shifting customer preferences, product obsolescence, and frequent product launches from both established and new competitors.
Competition in Data Center Segment
In the Data Center segment, we compete primarily against Intel Corporation (Intel) and Nvidia Corporation (Nvidia with our CPU, GPU DPU and AI NIC server products. In addition, we compete against Altera with our FPGA and adaptive SoC server products. A variety of smaller fabless silicon companies offer proprietary accelerator solutions and Arm®-based CPUs targeting data center use cases. In addition, some of our customers are internally developing their own data center microprocessor products and accelerator products which could impact the available market for our products.
Competition in Client and Gaming Segment
Our primary competitor in the supply of CPUs and APUs is Intel. A variety of companies provide or have developed Arm-based microprocessors and platforms which could lead to further adoption of Arm-based PC solutions.
9
Our principal competitor in the supply of discrete graphics is Nvidia, who is the discrete GPU market share leader, and Intel, who manufactures and sells integrated graphics processors and gaming-focused discrete GPUs. With respect to integrated graphics, higher unit shipments of our APUs and Intel’s integrated graphics may drive computer manufacturers to reduce the number of systems they build paired with discrete graphics components, particularly for notebooks, because they may offer satisfactory graphics performance for most mainstream PC users at a lower cost. We are the market share leader in semi-custom game console products, where graphics performance is critical.
Competition in Embedded Segment
We expect continued competition from our primary FPGA competitors such as Altera, Lattice Semiconductor Corporation and Microsemi Corporation, and from ASSP vendors such as Broadcom Corporation, Marvell Technology Group, Ltd., Analog Devices, Texas Instruments Incorporated, NXP Semiconductors N.V., Qualcomm Incorporated and NVIDIA. In addition, we expect continued competition from the ASIC market, which has been ongoing since the inception of FPGAs. Intel is our main competitor for embedded CPUs. Other competitors include manufacturers of high-density programmable logic products characterized by FPGA-type architectures; high-volume and low-cost FPGAs as programmable replacements for ASICs and ASSPs; ASICs and ASSPs with incremental amounts of embedded programmable logic; high-speed, low-density CPLDs; high-performance DSP devices; products with embedded processors; products with embedded multi-gigabit transceivers; discrete general-purpose GPUs targeting data center and automotive applications; and other new or emerging programmable logic products.
Research and Development
We focus our research and development (R&D) activities on designing and developing products. Our main area of focus is on delivering the next generation of processors (CPU and GPU), FPGAs and adaptive SoCs, accelerators (adaptive, graphics and DPU), SOMs and AI NICs, and the associated software for these products. We focus on designing, with security in mind, new integrated circuits (ICs) with improved performance and performance-per-watt in advanced semiconductor manufacturing processes, the design of logic and interface IP, advanced packaging technologies, and heterogeneous integration technologies. We also focus on software as part of the development of our products, including design automation tools for hardware, embedded software, AI stack, and optimized software tools and libraries that extend the reach of our platforms to software and AI developers. Through our R&D efforts, we were able to introduce a number of new products and enhance our IP core offerings and software.
We also work with industry leaders on process technology, design tools, intellectual property, software and other industry consortia to conduct early-stage R&D. We are also actively contributing to numerous industry open-source software initiatives and industry consortia across a broad range of technologies. We conduct product and system R&D activities for our products in the United States with additional design and development engineering teams located in various countries who undertake specific activities at the direction of our U.S. headquarters.
Manufacturing Arrangements and Assembly and Test Facilities
Third-Party Wafer Foundry Facilities
We utilize Taiwan Semiconductor Manufacturing Company Limited (TSMC) for the production of wafers for our HPC, FPGA and adaptive SoC products and GLOBALFOUNDRIES Inc. (GF), with respect to wafer purchases for our HPC products at the 12 nm and 14 nm technology nodes. Additionally, we utilize TSMC, United Microelectronics Corporation (UMC) and Samsung Electronics Co., Ltd. for the production of our ICs in the form of programmable logic devices.
Other Third-Party Manufacturers
We outsource board-level graphics product manufacturing to third-party manufacturers.
Assembly, Test, Mark and Packaging Facilities
Wafers for our products are either sorted by the foundry or delivered by the foundry to our assembly, test, mark and packaging (ATMP) partners or subcontractors located in the Asia-Pacific region, who package and test our final semiconductor products. We are party to two ATMP joint ventures (collectively, the ATMP JVs) with Tongfu Microelectronics Co., Ltd. The ATMP JVs, Siliconware Precision Industries Ltd. (SPIL) and King Yuan Electronics Company (KYEC) provide ATMP services for our products.
10
Intellectual Property and Licensing
We rely on contracts and intellectual property rights to protect our products and technologies from unauthorized third-party copying and use. Intellectual property rights include copyrights, patents, patent applications, trademarks, trade secrets and mask work rights. As of December 27, 2025, we had approximately 7,200 patents in the United States and approximately 2,200 patent applications pending in the United States. In certain cases, we have filed corresponding applications in foreign jurisdictions. Including United States and foreign matters, we have approximately 18,900 patent matters worldwide consisting of approximately 12,600 issued patents and 6,300 patent applications pending. We expect to file future patent applications in both the United States and abroad on significant inventions, as we deem appropriate. We do not believe that any individual patent, or the expiration of any patent, is or would be material to our business. As is typical in the semiconductor industry, we have numerous cross-licensing and technology exchange agreements with other companies under which we both transfer and receive intellectual property and technology rights. We have acquired various licenses from external parties to certain technologies that are implemented in our products, including our IP cores and devices. These licenses support our continuing ability to make and sell our products. We have also acquired licenses to certain proprietary software, open-source software, and related technologies, such as compilers, for our design tools. Continued use of such software and technology is important to the operation of the design tools upon which our customers depend.
Backlog
Sales are made primarily pursuant to purchase orders for current delivery or agreements covering purchases over a period of time. Although such orders or agreements may provide visibility into future quarters, they may not necessarily be indicative of actual sales for any succeeding period as some of these orders or agreements may be revised or canceled without penalty.
Seasonality
Our operating results tend to vary seasonally. Historically, our net revenue has been generally higher in the second half of the year than in the first half of the year, although market conditions and product transitions could impact these trends.
Human Capital
As of December 27, 2025, we had approximately 31,000 employees in our global workforce. We believe we are at our best when our culture of innovation and people from all kinds of backgrounds work together in an engaging and open environment. Areas of focus for us include:
Mission, Culture, and Engagement
Founded in 1969 as a Silicon Valley start-up, the AMD journey began with dozens of employees focused on leading-edge semiconductor products. From those modest beginnings, we have grown into a global company achieving many important industry firsts along the way. Today, we develop AI and high-performance computing to solve some of the world’s toughest challenges.
Our Vision - High performance and adaptive computing is transforming our lives.
Our Mission - Build great products that accelerate next-generation computing experiences.
Our employees are driven by this vision and mission. Innovation occurs when creative minds and diverse perspectives work together. This is the foundation of our unique culture and the reason we believe our employees are among the most engaged in our industry.
We conduct an annual survey of our global workforce to measure our culture, engagement, and workplace experience. The results are reviewed by our Board of Directors and acted upon by our senior leadership team. Results from our 2025 survey reported scores that continued to be among the very best for global companies in the technology industry.
Diversity, Belonging and Inclusion (DB&I)
Our diverse workforce allows us to create an inclusive workplace that encourages employees to share their opinions and different perspectives. We believe that having a diverse talent pipeline, encouraging a culture of respect and belonging, and enabling unique voices to be heard fosters innovation and makes our company stronger. Our
11
Employee Resource Groups (ERGs) encourage employee engagement and play an important role in our culture. ERGs are voluntary initiatives in which an employee chooses to actively participate in one or more employee engagement programs. In 2025, we broadened our commitment to developing our engineering talent by expanding mentoring opportunities and career development programs for engineering professionals at AMD.
Total Rewards
We invest in our workforce by offering competitive salaries, incentives, and benefits to ensure that we continue to attract and retain the industry’s best and brightest in an equitable manner. We regularly review our compensation practices, considering factors relevant to ensuring equitable pay such as an employee’s role, experience, skills, and performance. We also benchmark set pay ranges based on relevant market data and our overall workforce. We focus on flexibility and choice in our benefits that resonate with a multi-generational workforce as well as offering inclusive benefits. We also provide flexibility with in-person, hybrid and remote work as options for our employees.
We have a strong pay for performance culture that we believe drives superior results and our rewards programs enable us to attract, retain and motivate our workforce.
Development
We offer our employees opportunities to advance their careers at the Company and the majority of our new leaders are promoted from within. We are focused on leadership progression and encourage our employees to take advantage of new opportunities. Our manager and leadership development programs are highly rated, and we provide specialized development programs for our employees as well as educational assistance in the form of tuition reimbursement for eligible employees to continue their university education or achieve advanced certifications.
We have an enterprise-wide mentoring program where employees have the opportunity to learn from experienced colleagues, develop new skills, and build their professional networks. The program also supports effective onboarding, helping new hires more quickly acclimate to our company culture and work processes.
Employee Voice
At AMD, we value the importance of employee voice and actively engage in efforts to ensure that our employees' opinions and perspectives are heard and considered. Our employee voice strategy includes an annual AMDer Survey (engagement survey) referenced above. Additionally, we measure effectiveness across all elements of the employee lifecycle, including onboarding, exit, and regularly seek out employee feedback on areas including benefits and total rewards satisfaction. Further, our executive team holds frequent employee roundtables, town halls and global team meetings, which facilitate open communication and feedback from our workforce.
Government Regulations
Our global operations are subject to various United States and foreign laws and regulations, including, but not limited to, those relating to export control, customs, intellectual property, data privacy and security, climate, environmental, health and safety requirements, cybersecurity, tax, employment, competition and anti-trust, anti-corruption, anti-bribery, conflict minerals, corporate governance, financial and other disclosures, and AI. Compliance with these governmental laws and regulations do not presently have a material adverse impact on our capital expenditures, results of operations or competitive position. However, compliance with changes to existing or new regulations may have a material adverse impact on our future capital expenditures, results of operations or competitive position. In addition, the failure to comply with government laws and regulations may subject us to consequences including fines, limits on our ability to sell our products, suspension of certain of our business activities, reputational damage, criminal and civil liabilities, and sanctions, which may have a material adverse effect on our capital expenditures, results of operations or competitive position. For additional information about government regulations applicable to our business, and their potential impacts see Risk Factors in Item 1A.
Environmental Regulations
Our operations and properties are subject to various United States and foreign laws and regulations, including those relating to materials used in our products and the manufacturing processes of our products, discharge of pollutants into the environment, the treatment, transport, storage and disposal of solid and hazardous wastes and remediation of contamination. These laws and regulations require our suppliers to obtain permits for operations in making our products, including the discharge of air pollutants and wastewater. Environmental laws are complex, change frequently and tend to become more stringent over time.
12
Certain environmental laws, including the United States Comprehensive, Environmental Response, Compensation and Liability Act of 1980, or the Superfund Act, impose strict and, under certain circumstances, joint and several liability on current and previous owners or operators of real property for the cost of removal or remediation of hazardous substances and impose liability for damages to natural resources. These laws often impose liability even if the owner or operator did not know of, or was not responsible for, the release of such hazardous substances. These environmental laws also assess liability on persons who arrange for hazardous substances to be sent to disposal or treatment facilities when such facilities are found to be contaminated. Such persons can be responsible for cleanup costs even if they never owned or operated the contaminated facility. We have been named as a responsible party at three Superfund Sites in Sunnyvale, California that are on the National Priorities List. Since 1981, we have discovered hazardous material releases to the soil and groundwater from former underground tanks and proceeded to investigate and conduct remediation at these three sites. The chemicals released into the groundwater were commonly used in the semiconductor industry in the United States in the wafer fabrication process.
In 1991, we received Final Site Clean-up Requirements Orders from the California Regional Water Quality Control Board relating to the three sites. We entered into an agreement with another responsible party with respect to one of the sites. Pursuant to that agreement, the other party is responsible for cleanup of certain offsite contamination. We remain responsible for cleanup not covered by the agreement, including on-site cleanup, as well as all remaining costs in the event that the other party does not fulfill its obligations under the agreement.
To address anticipated future remediation costs under the orders, we have computed and recorded an estimated environmental liability of approximately $5.9 million and have not recorded any potential insurance recoveries in determining the estimated costs of the cleanup. The progress of future remediation efforts cannot be predicted with certainty and these costs may change. We believe that any amount in addition to what has already been accrued would not be material.
Additional environmental regulations on materials, chemicals, energy and waste apply directly or indirectly to the design, manufacturing, use and end-of-use of semiconductor devices and solutions. As examples, the European Union (EU) and China are among a growing number of jurisdictions that have enacted restrictions on the use of lead and other materials in electronic products. Chemical reporting and restriction requirements continue to evolve, namely related to per- and polyfluoroalkyl substances (PFAS). Jurisdictions including the EU, California and China are developing or have finalized product energy efficiency regulations impacting market access and/or public procurement for computers and servers. Existing and developing regulations related to electronic waste recycling and extended producer responsibility, including the EU, China, Brazil, India, as well as state and municipal jurisdictions like California and Sao Paulo Brazil, require labeling, fees and/or reporting to support recycling efforts. Certain of these laws target end-user products. However, the scope of such laws is inconsistent, which increases the complexity of compliance. We continue to work with customers, suppliers and industry groups to monitor and address product-related environmental regulations. While compliance has not historically had a material impact on our financial condition, earnings, or competitive position, there can be no assurance that these evolving laws will not require us to incur significant costs, modify our operations or product designs, or take other actions for compliance.
Additional Information
AMD was incorporated under the laws of Delaware on May 1, 1969 and became a publicly held company in 1972. Our common stock is currently listed on The NASDAQ Global Select Market (NASDAQ) under the symbol “AMD”. Our mailing address and executive offices are located at 2485 Augustine Drive, Santa Clara, California 95054, and our telephone number is (408) 749-4000. For financial information about geographic areas and for segment information with respect to revenues and operating results, refer to the information set forth in Note 4 of our consolidated financial statements. We use a 52- or 53-week fiscal year ending on the last Saturday in December. References in this report to 2025, 2024 and 2023 refer to the fiscal year unless explicitly stated otherwise.
AMD, the AMD Arrow logo, 3D V-Cache, Alveo, Athlon, Atrix, CDNA, CoolRunner, EPYC, FidelityFX, FirePro, FreeSync, Geode, Infinity Fabric, AMD Instinct, Kintex, Kria, Opteron, Pensando, Radeon, RDNA, ROCm, Ryzen, Spartan, Threadripper, UltraScale, UltraScale+, Versal, Virtex, Vitis, Vivado, XDNA, Xilinx, Zynq and combinations thereof are trademarks of Advanced Micro Devices, Inc.
Microsoft, Windows, and Xbox One are registered trademarks of Microsoft Corporation in the United States and/or other countries. Linux is the registered trademark of Linus Torvalds in the United States and/or other countries. PlayStation is a registered trademark of Sony Interactive Entertainment, Inc. Arm is a registered trademark of Arm Limited (or its subsidiaries) in the United States and/or other countries.
13
Other names are for informational purposes only and are used to identify companies and products and may be trademarks of their respective owners.
Website Access to Our SEC Filings and Corporate Governance Documents
On the Investor Relations pages of our website, http://ir.amd.com, we post links to our filings with the SEC, our Principles of Corporate Governance, our Code of Ethics for our executive officers, all other senior finance executives and certain representatives from legal and internal audit, including our Chief Executive Officer, Chief Financial Officer, Chief Accounting Officer and persons performing similar functions, our Global Code of Conduct, which applies to our Board of Directors and all of our employees, and the charters of the committees of our Board of Directors.
Our filings with the SEC are posted on our website as soon as reasonably practical after they are electronically filed with, or furnished to, the SEC. The SEC website, www.sec.gov, contains reports, proxy and information statements, and other information regarding issuers that file electronically with the SEC. You can also obtain copies of these documents by writing to us at: Corporate Secretary, AMD, 2485 Augustine Drive, Santa Clara, California 95054, or emailing us at: Corporate.Secretary@amd.com. All of these documents and filings are available free of charge.
If we make substantive amendments to our Code of Ethics or grant any waiver, including any implicit waiver, to our principal executive officer, principal financial officer, principal accounting officer, controller or persons performing similar functions, we intend to disclose the nature of such amendment or waiver on our website.
The information contained on our website is not incorporated by reference in, or considered to be a part of, this report.
14
ITEM 1A. RISK FACTORS
The risks and uncertainties described below are not the only ones we face. If any of the following risks actually occurs, our business, financial condition or results of operations could be materially adversely affected. In addition, you should consider the interrelationship and compounding effects of two or more risks occurring simultaneously.
Risk Factors Summary
The following is a summary of the principal risks that could adversely affect our business, financial condition and results of operations.
Economic and Strategic Risks
•The markets in which our products are sold are highly competitive and rapidly evolving.
•The semiconductor industry is highly cyclical and has experienced severe downturns.
•The demand for our products depends in part on the market conditions in the industries into which they are sold.
•The success of our business depends on our ability to introduce products on a timely basis with features and performance levels that provide value to our customers while supporting significant industry transitions.
•The loss of a significant customer may have a material adverse effect on us.
•Economic and market uncertainty may adversely impact our business and operating results.
•Our operating results are subject to quarterly and seasonal sales patterns.
•If we cannot adequately protect our technology or other intellectual property through patents, copyrights, trade secrets, trademarks and other measures, we may lose a competitive advantage and incur significant expenses.
•Unfavorable currency exchange rate fluctuations could adversely affect us.
Operational and Technology Risks
•We rely on third parties to manufacture our products, and if they are unable to do so on a timely basis in sufficient quantities and using competitive technologies, our business could be materially adversely affected.
•Essential equipment, materials, substrates or manufacturing processes may not be available to us.
•We may fail to achieve expected manufacturing yields for our products.
•Our revenue from our semi-custom System-on-Chip (SoC) products is dependent upon our semi-custom SoC products being incorporated into customers’ products and the success of those products.
•Our products may be subject to security vulnerabilities that could have a material adverse effect on us.
•IT outages, data loss, data breaches and cyberattacks could disrupt operations and compromise our intellectual property or other sensitive information, be costly to remediate or cause significant damage to our business, reputation, financial condition and results of operations.
•Uncertainties involving the ordering and shipment of our products could materially adversely affect us.
•Our ability to design and introduce new products includes the use of third-party intellectual property.
•We depend on third-party companies for the design, manufacture and supply of motherboards, software, memory and other computer platform components to support our business and products.
•If we lose Microsoft Corporation’s support for our products or other software vendors do not design and develop software to run on our products, our ability to sell our products could be materially adversely affected.
•Our reliance on third-party distributors and add-in-board (AIB) partners subjects us to certain risks.
•Our business depends on the proper functioning of our internal business processes and information systems.
•Our products may not be compatible with some or all industry-standard software and hardware.
15
•Costs related to defective products could have a material adverse effect on us.
•We may fail to maintain the efficiency of our supply chain as we respond to changes in customer demand.
•We outsource to third parties certain supply-chain logistics functions.
•We may be unable to effectively control the sales of our products on the gray market.
•Climate change may have an impact on our business.
Legal and Regulatory Risks
•Government actions and regulations, including but not limited to export regulations, import tariffs and trade protection measures, may limit our ability to export our products to certain customers.
•If we cannot realize our deferred tax assets, our results of operations could be adversely affected.
•Our business is subject to potential tax liabilities, including as a result of tax regulation changes.
•We are party to litigation and may become a party to other claims or litigation.
•We are subject to environmental laws, conflict minerals regulations, as well as a variety of other laws or regulations.
•Evolving expectations from governments, investors, customers and other stakeholders regarding corporate responsibility matters could result in additional costs, harm to our reputation and a loss of customers.
•Issues related to the responsible use of AI may result in reputational, competitive and financial harm and liability.
•The agreements governing our notes, our guarantee of Xilinx’s notes and the Revolving Credit Agreement.
•We may be required to satisfy financial obligations under guarantees and other commercial commitments.
Merger, Acquisition, Divestiture, and Integration Risks
•Acquisitions, joint ventures, and/or investments, and the failure to integrate acquired businesses may fail to materialize their anticipated benefits and could disrupt our business.
•Any impairment of our tangible, definite-lived intangible or indefinite-lived intangible assets, including goodwill, may adversely impact our financial position and results of operations.
General Risks
•Our worldwide operations are subject to political, legal and economic risks and natural disasters.
•We may incur future impairments of our technology license purchases.
•Our inability to continue to attract and retain key employees may hinder our business.
•Our stock price is subject to volatility.
For a more complete discussion of the material risks facing our business, see below.
16
Economic and Strategic Risks
The markets in which our products are sold are highly competitive and rapidly evolving.
Delivering the latest and best products to market on time is critical to revenue growth. The competitiveness of our products depends on a number of factors including, performance, total cost of ownership, timely product introductions, product quality and reliability, product features and capabilities, energy efficiency (including power consumption and battery life, given their impact on total cost of ownership), size (or form factor), selling price, cost, adherence to industry standards (and the creation of open industry standards), level of integration, software and hardware compatibility, ease of use and functionality of software design tools, completeness of applicable software solutions, security and stability, brand recognition and availability.
Competition is expected to remain intense, driven by rapid technological change, evolving standards, shifting customer preferences, product obsolescence, and frequent product launches from both established and new competitors. Some of our competitors may possess stronger market positions, larger customer bases, more design wins, and greater financial, sales, marketing, and distribution resources than us. As a result, they may be able to acquire market share or limit our ability to do so, more effectively capitalize on new market opportunities, and transition their products more efficiently than we can. Some competitors are pursuing alternative computing architectures, such as Arm, which could grow the Arm ecosystem and increase competition in consumer, commercial and data center, reducing demand for our products. Additionally, we may encounter competition from customers who internally develop products to support similar AI workloads to those supported by ours.
Our competitors may use their market position and financial resources to market and price their products in a way to dissuade customers from purchasing from us. For example, Intel Corporation (Intel) uses its microprocessor market position to price its products aggressively and target our customers and channel partners with special incentives. These aggressive activities have reduced and may reduce our unit sales and average selling prices for many of our products, adversely affecting our business. Similarly, Nvidia Corporation (Nvidia) leverages its market position in data center GPU, financial resources, and proprietary software ecosystem to promote its systems and influences customers who do business with us. Our competitors’ business practices, including allocation strategies, pricing actions, product mix and introduction schedules, licensing terms, marketing arrangements, product bundling strategies, lack of software inoperability and business acquisitions can limit customers’ ability to choose alternative products, including ours. This may limit our market share and decrease our margins and profitability, which may have a material adverse effect on our business.
In addition, strategic partnerships, acquisitions and business collaborations by and between our competitors may increase competition and adversely affect our business. For example, in September 2025, Nvidia announced a partnership and investment in Intel to partner on new data center and client platform products. This partnership may result in increased competition and pricing pressure for our products or could prevent us from participating in other opportunities, which could materially adversely impact our business, financial condition and margins.
The semiconductor industry is highly cyclical and has experienced severe downturns that have materially adversely affected, and may continue to materially adversely affect, our business in the future.
The semiconductor industry is highly cyclical and has experienced significant downturns, often alongside constant and rapid technological change, wide fluctuations in supply and demand, continuous new product introductions, price erosion and declines in general economic conditions. The growth of AI is further creating pressure on the semiconductor industry to timely design, manufacture and deliver semiconductor products and solutions to meet customer demand for computing power and AI infrastructure. We have incurred substantial losses in previous downturns, due to substantial declines in average selling prices; the cyclical nature of supply and demand imbalances in the semiconductor industry; a decline in demand for end-user products that incorporate our products; and excess inventory levels and periods of inventory adjustment. Such industry-wide fluctuations may materially adversely affect us in the future. Global economic uncertainty and weakness have in the past impacted the semiconductor market as consumers and businesses have deferred purchases, which negatively impacted demand for our products. Our financial performance has been, and may in the future be, negatively affected by these downturns.
The growth of our business is also dependent on continued demand for our products from high-growth adjacent emerging global markets. Our ability to be successful in such markets depends in part on our ability to establish adequate local infrastructure, as well as our ability to cultivate and maintain local relationships in these markets. If demand from these markets is below our expectations, sales of our products may decrease, which would have a material adverse effect on us.
17
The demand for our products depends in part on the market conditions in the industries into which they are sold. Fluctuations in demand for our products or a market decline in any of these industries could have a material adverse effect on our results of operations.
Industry-wide fluctuations in the computer marketplace have materially adversely affected us in the past and may materially adversely affect us in the future. We offer products that are used in different end markets and the demand for our products can vary among our Data Center, Client, Gaming and Embedded end markets. In our Data Center segment, we offer products that are optimized for generative AI applications and since 2024, we have experienced significant demand for our AI accelerators. The demand for such products will in part depend on the extent to which our customers utilize generative AI solutions in a wide variety of applications, and both the near-term and long-term trajectory of such generative AI solutions is unknown. Some customers in AI markets may be unable to secure access to internal and external infrastructure, including availability of sufficient data center capacity or energy for the buildout of data centers that use our products. In addition, construction delays in the scheduled buildout of data centers could impact the timing of customer demand. Such delays in the buildout of data centers could have a material adverse effect on our business, financial condition and future growth strategy. Customers may also lack, or be unable to, secure capital to fund their required AI infrastructure and may request alternative financing or deferred‑payment arrangements from vendors and suppliers. These limitations could delay or reduce the demand for our products, which could negatively impact our revenue.
Our Client and Gaming segment revenue is focused on the consumer desktop and notebook PC segments and will depend in part on the market’s adoption of AI PCs. We are actively building AI capabilities into all our Client products, such as Ryzen AI PC processors, but there can be no assurance about the rate and pace of adoption of such product offerings. In the past, revenue from the Client and Gaming segment has experienced a decline driven by, among other factors, the adoption of smaller and other form factors, increased competition and changes in replacement cycles. In addition, our GPU revenue in the past has been affected in part by the volatility of the cryptocurrency mining market. If we are unable to manage the risks related to the volatility of the cryptocurrency mining market (including potential actions by global monetary authorities), our GPU business could be materially adversely affected. The success of our semi-custom SoC products in our Client and Gaming segment is dependent on securing customers for our semi-custom design pipeline and consumer market conditions, including the success of game console systems and next generation consoles for Sony and Microsoft.
Our Embedded segment primarily includes embedded CPUs, APUs, FPGAs, System on Modules (SOMs) and adaptive SoC products some of which are subject to macroeconomic trends and volatile business conditions. To the extent our embedded customers are faced with higher inventory levels, they may choose to draw down their existing inventory and order less of our products.
18
The success of our business depends on our ability to introduce products on a timely basis with features and performance levels that provide value to our customers while supporting and coinciding with significant industry transitions.
Our success depends to a significant extent on the development, qualification, implementation and acceptance of new product designs and improvements that provide value to our customers. Our ability to identify industry changes, and adapt our strategy to develop, qualify and distribute, and have manufactured, new products and related technologies to meet evolving industry trends and requirements, at prices acceptable to our customers and on a timely basis, are significant factors in determining our competitiveness in our target markets. We cannot assure you that we will be able to meet the evolving needs of industry changes or that our efforts to execute our product roadmap will result in innovative products and technologies that provide value to our customers. If we fail to or are delayed in identifying, developing, qualifying or shipping new products or technologies that provide value to our customers and address these new trends, or if we fail to predict which new form factors, product features preferences or requirements consumers will adopt and adapt our business accordingly, we may lose competitive positioning, which could cause us to lose market share. Although we make substantial investments in research and development, we cannot be certain that we will be able to develop, obtain or successfully implement new products and technologies on a timely basis or that they will be well-received by our customers. Moreover, our investments in new products and technologies involve certain risks and uncertainties and could disrupt our ongoing business. New investments may not generate sufficient revenue and we may incur unanticipated liabilities. We cannot be certain that our ongoing investments in new products and technologies will be successful, will meet our expectations and will not adversely affect our reputation, financial condition and operating results. For example, as part of our pervasive AI strategy, we have a portfolio of hardware products and software tools to allow our customers to develop scalable and pervasive AI solutions. We are actively building AI capabilities into our products, but there can be no assurance about the rate and pace of adoption of such product offerings. In our Data Center segment, we offer products that are optimized for generative AI applications and we have experienced significant demand for our AI accelerators. The demand for such products in part will depend on the extent to which our customers utilize generative AI solutions in a wide variety of applications as both the near-term and long-term trajectory of such generative AI solutions is unknown. If we fail to develop and timely offer or deploy such products and technologies, keep pace with the product offerings of our competitors, or adapt to unexpected changes in industry standards or disruptive technological innovation, our business could be adversely affected. Additionally, our efforts in developing new AI technology solutions are inherently risky and may not always succeed. We may incur significant costs, resources, investments and delays and not achieve a return on investment or capitalize on the opportunities presented by demand for AI solutions. Moreover, while AI adoption is likely to continue and may accelerate, the long-term trajectory of this technological trend is uncertain.
Delays in developing, qualifying or shipping new products may cause us to miss our customers’ product design windows or, in some cases, breach contractual obligations. If our products are not selected by our customers in the initial design of their computer systems or products, they are typically excluded until at least the next design cycle. The process of being qualified for inclusion in a customer’s system or product can be lengthy and could cause us to further miss a cycle in the demand of end-users, which could result in a loss of market share and harm our business. We also depend on the timing and success of our customers’ platform launches. If our customers delay their product launches or if our customers do not effectively market their platforms with our products, it could result in a delay in bringing our products to market and cause us to miss a cycle in the demand of end-users, which could materially adversely affect our business. In addition, as market demand requires that products incorporate new features and performance standards on an industry-wide basis, product pricing declines over the life of a specific product. The introduction of new products and enhancements to existing products is necessary to maintain the overall corporate average selling price. If we are unable to introduce new products with sufficiently high sale prices or to increase unit sales volumes capable of offsetting the reductions in the sale prices of existing products over time, our business could be materially adversely affected.
Product transition risks may increase as the computing industry shifts toward shorter launch cycles and a broader range of accelerated computing platforms. Product transitions are complex and as such we may ship both new and prior-generation products concurrently. Customer adoption patterns can vary and while some customers may shift to newer products more quickly and reduce demand for current-generation offerings, other customers may lower their inventory of existing products before purchasing new ones. The increased frequency of product transitions and expansion of our product portfolio heightens the challenges of managing our supply and demand, which could adversely affect our revenue and inventory management. The increasing frequency and complexity of our newly introduced products may also result in unanticipated quality or production issues that could result in product delays.
19
The loss of a significant customer may have a material adverse effect on us.
We depend on a small number of customers for a substantial portion of our business and we expect that a small number of customers will continue to account for a significant part of our revenue and receivables in the future. If one of our key customers decides to stop buying our products, materially reduces its operations or its demand for our products, or has operations that are materially impaired for a significant period of time such that it is unable to receive or utilize our products, or pay its liabilities, our business would be materially adversely affected.
Economic and market uncertainty may adversely impact our business and operating results.
Uncertain global or regional economic conditions have and may in the future adversely impact our business. Uncertainty in the economic environment or other unfavorable changes in economic conditions, such as inflation, fluctuating interest rates, recession, slowing growth, increased unemployment, tighter credit markets, changes or uncertainty in fiscal monetary or trade policy, implementation of new or increased tariffs, retaliatory tariffs by other countries or other trade restrictions, or currency fluctuations, may negatively impact consumer confidence and spending causing our customers to stop or postpone purchases. During challenging economic times, our current or potential future customers may experience cash flow problems and as a result may modify, delay or cancel plans to purchase our products. Additionally, if our customers are not successful in generating sufficient revenue or are unable to secure financing, they may not be able to pay, or may delay payment of, accounts receivable that they owe us. If current or prospective customers default on or delay payments to us, our earnings and cash flow could be adversely impacted. This risk is heightened as we expect that a small number of customers will continue to account for a substantial part of our revenue. Moreover, our key suppliers may reduce their output or become insolvent, thereby adversely impacting our ability to manufacture our products. Adverse changes in economic conditions could increase costs of memory, equipment, materials or substrates and other supply chain expenses. For example, there is currently an industry-wide memory shortage as the demand for such components has outpaced supply. The price of memory has also increased as a result of the shortage. If we are not able to procure a stable supply of materials, including memory, on an ongoing basis and at reasonable costs to meet our production requirements, we could experience a supply shortage or an increase in production costs, which could negatively impact our gross margin and materially adversely affect our business. Our ability to forecast our operating results, make business decisions and execute our business strategy could be adversely impacted by challenging macroeconomic conditions. In addition, uncertain economic conditions could lead to higher borrowing costs and reduced availability of capital and credit markets, making it more difficult for us to raise funds through borrowings or private or public sales of debt or equity securities. An economic downturn or increased uncertainty could also lead to failures of counterparties including financial institutions and insurers, asset impairments and declines in the value of our financial instruments. If a banking institution in which we hold funds fails or is subject to significant adverse conditions in the financial or credit markets, we could be subject to a risk of loss of all or a portion of such uninsured funds or be subject to a delay in accessing all or a portion of such uninsured funds, which in turn could adversely impact our short-term liquidity and ability to meet our operating expense obligations.
Our operating results are subject to quarterly and seasonal sales patterns.
The profile of our sales may be weighted differently during the year. A large portion of our quarterly sales have historically been made in the last month of the quarter. This uneven sales pattern makes prediction of revenue for each financial period difficult and increases the risk of unanticipated variations in quarterly results and financial condition. In addition, our operating results tend to vary seasonally with the markets in which our products are sold. For example, historically, our net revenue has been generally higher in the second half of the year than in the first half of the year, although market conditions and product transitions could impact these trends. Many of the factors that create and affect quarterly and seasonal trends are beyond our control.
If we cannot adequately protect our technology or other intellectual property in the United States and abroad, through patents, copyrights, trade secrets, trademarks and other measures, we may lose a competitive advantage and incur significant expenses.
We rely on a combination of protections provided by contracts, including confidentiality and nondisclosure agreements, copyrights, patents, trademarks and common law rights, such as trade secrets, to protect our intellectual property. However, we cannot assure you that we will be able to adequately protect our technology or other intellectual property from third-party infringement or from misappropriation in the United States and abroad. Any patent licensed by us or issued to us could be challenged, invalidated, expire, or circumvented or rights granted thereunder may not provide a competitive advantage to us.
20
Furthermore, patent applications that we file may not result in issuance of a patent or, if a patent is issued, the patent may not be issued in a form that is advantageous to us. Despite our efforts to protect our intellectual property rights, others may independently develop similar products, duplicate our products or design around our patents and other rights. In addition, it is difficult to monitor compliance with, and enforce, our intellectual property on a worldwide basis in a cost-effective manner. In jurisdictions where foreign laws provide less intellectual property protection than afforded in the U.S. and abroad, our technology or other intellectual property may be compromised, and our business would be materially adversely affected.
Unfavorable currency exchange rate fluctuations could adversely affect us.
We have costs, assets and liabilities that are denominated in foreign currencies. As a consequence, movements in exchange rates could cause our foreign currency denominated expenses to increase as a percentage of revenue, affecting our profitability and cash flows. Whenever we believe appropriate, we hedge a portion of our foreign currency exposure to protect against fluctuations in currency exchange rates. We determine our total foreign currency exposure using projections of long-term expenditures for items such as payroll. We cannot assure you that these activities will be effective in reducing foreign exchange rate exposure. Failure to do so could have an adverse effect on our business, financial condition, results of operations and cash flow. In addition, the majority of our product sales are denominated in U.S. dollars. Fluctuations in the exchange rate between the U.S. dollar and the local currency may impact the cost of our products in the local currency for international customers. An appreciation of the U.S. dollar relative to the local currency could reduce sales of our products.
Operational and Technology Risks
We rely on third parties to manufacture our products, and if they are unable to do so on a timely basis in sufficient quantities and using competitive technologies, our business could be materially adversely affected.
We utilize third-party wafer foundries to fabricate the silicon wafers for all of our products. We rely on Taiwan Semiconductor Manufacturing Company Limited (TSMC) for the production of all wafers for microprocessor and GPU products at 7 nanometer (nm) or smaller nodes, and we rely primarily on GLOBALFOUNDRIES Inc. (GF) for wafers for microprocessor and GPU products manufactured at process nodes larger than 7 nm. We also utilize TSMC, United Microelectronics Corporation (UMC) and Samsung Electronics Co., Ltd. for our integrated circuits (IC) in the form of programmable logic devices. We also rely on third-party manufacturers to assemble, test, mark and pack (ATMP) our products. Our third-party package assembly partners are responsible for packaging technology used to fabricate our products. It is important to have reliable relationships with all of these third-party manufacturing suppliers to ensure adequate product supply to respond to customer demand.
We cannot guarantee that these manufacturers or our other third-party manufacturing suppliers will be able to meet our near-term or long-term manufacturing requirements. If we experience supply constraints from our third-party manufacturing suppliers, we may be required to allocate the reduced quantities of affected products amongst our customers, which could have a material adverse effect on our relationships with these customers and on our financial condition. In addition, if we are unable to meet customer demand due to fluctuating or late supply from our manufacturing suppliers, it could result in lost sales and have a material adverse effect on our business. For example, if TSMC is not able to manufacture wafers for our microprocessor and GPU products at 7 nm or smaller nodes and our newest IC products in sufficient quantities to meet customer demand, it could have a material adverse effect on our business.
21
We do not have long-term commitment contracts with some of our third-party manufacturing suppliers. We obtain many of these manufacturing services on a purchase order basis and these manufacturers are not required to provide us with any specified minimum quantity of product beyond the quantities in an existing purchase order. Accordingly, we depend on these suppliers to allocate to us a portion of their manufacturing capacity sufficient to meet our needs, to produce products of acceptable quality and at acceptable manufacturing yields and to deliver those products to us on a timely basis and at acceptable prices. The manufacturers we use also fabricate wafers and ATMP products for other companies, including certain of our competitors. They could choose to prioritize capacity for other customers, increase the prices that they charge us on short notice, require onerous prepayments, or reduce or eliminate deliveries to us, which could have a material adverse effect on our business. If we overestimate our customer demand or experience a decrease in customer demand, either could result in excess inventory and an increase in our production costs. We are party to a wafer supply agreement with GF where GF will provide a minimum annual capacity allocation to us and set pricing through 2026. If our actual wafer requirements are less than the number of wafers required to meet the applicable annual wafer purchase target, we could have excess inventory or higher inventory unit costs, both of which may adversely impact our gross margin and our results of operations.
Other risks associated with our dependence on third-party manufacturers include limited control over delivery schedules, yield, cycle times, quality assurance, price increases, lack of capacity in periods of excess demand, misappropriation of our intellectual property, dependence on several subcontractors, and limited ability to manage inventory and parts. Moreover, if any of our third-party manufacturers (or their subcontractors) suffer any damage to facilities, lose benefits under material agreements, experience power outages, water shortages, or high heat events, lack sufficient capacity to manufacture our products, encounter financial difficulties, are unable to secure necessary raw materials from their suppliers, suffer any other disruption or reduction in efficiency, or experience uncertain environmental, social, atmospheric or natural, economic or political circumstances or conditions, we may encounter supply delays or disruptions. For example, in the first quarter of 2024, we experienced some inventory loss due to an incident at a contract manufacturer. If we are unable to secure sufficient or reliable supply of products, our ability to meet customer demand may be adversely affected and this could materially affect our business.
If we transition the production of some of our products to new manufacturers, we may experience delayed product introductions, lower yields or poorer performance of our products. If we experience problems with product quality or are unable to secure sufficient capacity from a particular third-party manufacturer, or if we for other reasons cease utilizing one of those manufacturers, we may be unable to timely secure an alternative supply for any specific product. We could experience significant delays in the shipment of our products if we are required to find alternative third-party manufacturers, which could have a material adverse effect on our business.
We are party to two ATMP joint ventures (collectively, the ATMP JVs) with affiliates of Tongfu Microelectronics Co., Ltd. The majority of our ATMP services are provided by the ATMP JVs and there is no guarantee that the ATMP JVs will be able to fulfill our long-term ATMP requirements. If we are unable to meet customer demand due to fluctuating or late supply from the ATMP JVs, it could result in lost sales and have a material adverse effect on our business.
22
If essential equipment, materials, substrates or manufacturing processes are not available to manufacture our products, we could be materially adversely affected.
We may purchase equipment, materials and substrates for use by our back-end manufacturing service providers from a number of suppliers and our operations depend upon obtaining deliveries of adequate supplies of equipment and materials of acceptable quality on a timely basis. Our third-party suppliers also depend on the same timely delivery of adequate quantities of equipment and materials of acceptable quality in the manufacture of our products. In addition, as many of our products increase in technical complexity, we rely on our third-party suppliers to update their processes in order to continue meeting our back-end manufacturing needs. Certain equipment and materials that are used in the manufacture of our products are available only from a limited number of suppliers, or in some cases, a sole supplier. We also depend on a limited number of suppliers to provide the majority of certain types of IC packages for our microprocessors, including our APU products. Similarly, certain non-proprietary materials or components such as memory, printed circuit boards (PCBs), interposers, substrates and capacitors used in the manufacture of our products are currently available from only a limited number of suppliers. For example, there is currently an industry-wide memory shortage as the demand for such components has outpaced supply. The price of memory has also increased as a result of the shortage. If we are unable to procure a stable supply of memory, equipment, materials or substrates of acceptable quality on an ongoing basis and at reasonable costs to meet our production requirements, we could experience a shortage in memory, equipment, materials or substrate supply or an increase in production costs, which could have a material adverse effect on our business. We have long-term purchase commitments and prepayment arrangements with some of our suppliers. If the delivery of such supply is delayed or does not occur for any reason, it could materially impact our ability to procure and process the required volume of supply to meet customer demand. Conversely, if we overestimate our customer demand or experience a decrease in customer demand, either because customers cancel orders or choose to purchase from our competitors, it could result in excess inventory and an increase in our production costs, particularly since we have prepayment arrangements with certain suppliers. Because some of the equipment and materials that we and our third-party manufacturers purchase are complex, it is sometimes difficult to substitute one equipment or materials supplier for another.
From time to time, suppliers may extend lead times, limit supply or increase prices due to capacity constraints or other factors. Also, some of these materials and components may be subject to rapid changes in price, quality and availability. Interruption of supply or increased demand in the industry could cause shortages and price increases in various essential materials. Dependence on a sole supplier or a limited number of suppliers exacerbates these risks. If we are unable to procure certain of these materials for our back-end manufacturing operations, or our third-party manufacturers are unable to procure materials for manufacturing our products, our business would be materially adversely affected.
23
Failure to achieve expected manufacturing yields for our products could negatively impact our results of operations.
Semiconductor manufacturing yields are a result of product design, process technology and packaging technology, which is typically proprietary to the manufacturer, and low yields can result from design failures, packaging technology failures, process technology failures or a combination of some or all of these. Our third-party manufacturers are responsible for the process technologies used to fabricate silicon wafers. If our third-party manufacturers experience manufacturing inefficiencies or encounter disruptions, errors or difficulties during production, we may fail to achieve acceptable yields or we may experience product delivery delays. We cannot be certain that our third-party manufacturers will be able to develop, expand, obtain or successfully implement leading-edge manufacturing process or packaging technologies needed to manufacture future generations of our products profitably or on a timely basis or that our competitors will not develop new technologies, products or processes earlier. Moreover, during periods when our third-party manufacturers are implementing new process or packaging technologies, their manufacturing facilities may not be fully productive. A substantial delay in the technology transitions to smaller process technologies could have a material adverse effect on us, particularly if our competitors transition to more cost effective technologies before us. For example, we are presently focusing our 7 nm and lower product microprocessor and GPU portfolio on TSMC’s processes. If TSMC is not able to manufacture wafers for our products at 7 nm or smaller nodes in sufficient quantities to meet customer demand, it could have a material adverse effect on our business. Moreover, we rely on TSMC, UMC and our other foundries to produce wafers with competitive performance attributes for our IC products. Therefore, the foundries, particularly TSMC which manufactures our newest IC products, must be able to transition to advanced manufacturing process technologies and increased wafer sizes, produce wafers at acceptable yields and deliver them in a timely manner.
Any decrease in manufacturing yields could result in an increase in per unit costs, which would adversely impact our gross margin and/or force us to allocate our reduced product supply amongst our customers, which could harm our relationships and reputation with our customers and materially adversely affect our business.
Our revenue from our semi-custom SoC products is dependent upon our semi-custom SoC products being incorporated into customers’ products and the success of those products.
The revenue that we receive from our semi-custom SoC products is in the form of non-recurring engineering fees charged to third parties for design and development services and revenue received in connection with sales of our semi-custom SoC products to these third parties. As a result, our ability to generate revenue from our semi-custom products depends on our ability to secure customers for our semi-custom design pipeline, our customers’ desire to pursue the project and our semi-custom SoC products being incorporated into those customers’ products. Any revenue from sales of our semi-custom SoC products is directly related to sales of the third-party’s products and reflective of their success in the market. Moreover, we have no control over the marketing efforts of these third parties, and we cannot make any assurances that sales of their products will be successful in current or future years. Consequently, the semi-custom SoC product revenue expected by us may not be fully realized and our operating results may be adversely affected.
Our products may be subject to security vulnerabilities that could have a material adverse effect on us.
The products that we sell are complex and have been and may in the future be subject to security vulnerabilities that could result in, among other things, the loss, corruption, theft or misuse of confidential data or system performance issues. Our efforts to prevent and address security vulnerabilities may decrease performance, be only partially effective or not successful at all. We may depend on vendors to create mitigations to their technology that we incorporate into our products and they may delay or decline to make such mitigations. We may also depend on third parties, such as customers and end-users, to deploy our mitigations alone or as part of their own mitigations, and they may delay, decline or modify the implementation of such mitigations. Our relationships with our customers could be adversely affected as some of our customers may stop purchasing our products, reduce or delay future purchases of our products, or use competing products. Any of these actions by our customers could adversely affect our revenue. We have and may in the future be subject to claims and litigation related to security vulnerabilities. Actual or perceived security vulnerabilities of our products may subject us to adverse publicity, damage to our brand and reputation, and could materially harm our business or results of operations.
24
IT outages, data loss, data breaches and cyberattacks could disrupt operations and compromise our intellectual property or other sensitive information, be costly to remediate or cause significant damage to our business, reputation, financial condition and results of operations.
Our business relies on technology hardware, software, cloud services, infrastructure, networks and systems (collectively, IT Systems). We own and manage some IT Systems but also rely on critical third-party IT Systems, products and services. In the ordinary course of business, we and various third-party providers and business partners process and maintain sensitive data, including personal information about workers, customers and others, as well as intellectual property and proprietary or confidential information relating to our business and that of our customers and business partners (collectively, Confidential Data). Maintaining the availability, integrity and security of our IT Systems and Confidential Data is critical to our business and reputation. While we and others have implemented various controls and defenses, AMD and companies like AMD and our vendors and customers have been and are increasingly subject to cybersecurity attacks, risks and threats. Risks and threat factors range in sophistication from negligent or bad acts by individuals, hackers or insiders, to ransom gangs and state-sponsored attackers. Cyber threats may be generic, or they may be custom-crafted against our IT Systems or supply chain. The increased prevalence of remote working arrangements at AMD and our providers present additional operational risks and attack vectors to our IT Systems. Our IT Systems and Confidential Data are vulnerable to a range of cybersecurity risks and threats, including malicious code that is added to widely available open-source software, compromised commercial software or security vulnerabilities in our products or systems, or those of a third party, that are being used by attackers prior to mitigations being put in place, such as zero-day attacks. Cyberattacks have and may come into our IT Systems through the compromise of users’ access credentials or those of third-party IT systems or untrusted assets. Users’ access credentials can be compromised by phishing, vishing, smishing, multi-factor authentication (MFA) prompt bombing, hacking, or other social engineering, cybersecurity, theft activities, or unintentional disclosure due to a human error.
Threat actors are also increasingly using tools and techniques that circumvent controls, evade detection, and remove forensic evidence, which means that we and others may be unable to implement adequate preventative measures against cyberattacks or to anticipate, detect, deflect, contain or recover from them in a timely or effective manner. As AI capabilities improve and are increasingly adopted, we may see more sophisticated threats created through the use of AI technology to launch more automated, targeted and coordinated cyberattacks. These attacks could be crafted with an AI tool to directly attack IT Systems with increased speed and/or efficiency than a human threat actor or create more effective phishing emails. In addition, the threat could be introduced from the result of our or our customers and business partners incorporating the output of an AI tool that includes a threat, such as introducing malicious code by incorporating AI generated source code. We leverage AI tools and systems to help support our internal functions and operations. These systems are increasingly vulnerable to cybersecurity threats, which can significantly impact data security. Our network and storage applications, as well as those of our customers, business partners, and third-party providers, may be subject to unauthorized access by hackers or breached due to operator error, malfeasance or other system disruptions.
Cyberattacks that breach our security measures, or those of our third-party service providers, customers or business partners, could result in any or all of the following, which individually or collectively could materially adversely affect our financial condition and competitive position; unauthorized access to, misuse or disclosure of Confidential Data (such as intellectual property, sensitive business information or personally identifiable information (PII)); reputational harm and/or diminution in our competitiveness; loss of existing and/or future customers; litigation and/or regulatory investigations or enforcement; significant remediation, restoration and compliance costs; and the diversion of management’s attention and key information technology resources. In addition, many governments have enacted and are continuing to enact strict privacy and security laws, such as the UK’s and European Union’s General Data Protection Regulation (GDPR) and the California Consumer Privacy Act of 2018 (CCPA), as amended by the California Privacy Rights Act (CPRA), which provide for fines, penalties, and in the case of the CCPA and similar legislation, the basis for private claims for certain types of data breaches. We anticipate ongoing and increasing costs related to enhancing and implementing information security controls, including costs related to upgrading application, computer, and network security components; training workers to maintain and monitor our security controls; investigating, responding to and remediating any data security breach, and addressing any related litigation or regulatory proceedings; mitigating reputational harm; and complying with external regulations.
25
Uncertainties involving the ordering and shipment of our products could materially adversely affect us.
We typically sell our products pursuant to individual purchase orders. We generally do not have long-term supply arrangements with our customers or minimum purchase requirements except that orders generally must be for standard pack quantities. Generally, our customers may cancel orders for standard products more than 30 days prior to shipment without incurring significant fees. We base our inventory levels in part on customers’ estimates of demand for their products, which may not accurately predict the quantity or type of our products that our customers will want in the future or ultimately end up purchasing. Our ability to forecast demand is further complicated when our products are sold indirectly through downstream channel distributors and customers, as our forecasts for demand are then based on estimates provided by multiple parties throughout the downstream channel. To the extent we fail to forecast demand and product mix accurately or are unable to increase production or secure sufficient capacity and there is a mismatch between supply and demand for our products, it could limit our ability to meet customer demand and have a material adverse effect on our business. Many of our markets are characterized by short product lifecycles, which can lead to rapid obsolescence and price erosion. As product complexity has increased, manufacturing lead times have extended and longer production cycles, combined with short product cycles, increase the risk that customer demand for products may change between wafer order and finished good availability, which could result in significant mismatches between supply and demand. In addition, our customers may change their inventory practices on short notice for any reason. We may build inventories during periods of anticipated growth, and the cancellation or deferral of product orders or overproduction due to failure of anticipated orders to materialize could result in excess or obsolete inventory, which could result in write-downs of inventory and an adverse effect on gross margins. Our customers may also experience a shortage of, or delay in receiving certain components to build their products, which in turn may affect the demand for or the timing of our products. In April 2025, the U.S. government implemented a new license requirement for the export of certain semiconductor products to China (including Hong Kong and Macau) and D5 countries, or to companies headquartered in or with an ultimate parent located in such countries. This restriction impacts our AMD Instinct™ MI308 products. As a result of the restriction, we incurred approximately $800 million in inventory and related charges in the second quarter of 2025. We applied for and were granted some licenses by the U.S. government that allow us to ship our MI308 products to certain China-based customers. Sales of our MI308 products into China depend on customer demand, China’s import control rules and our ability to obtain licenses. As such, our revenues and results of operation could be negatively affected.
Excess or obsolete inventory have resulted in, and may in the future result in, write-downs of the value of our inventory. Factors that may result in excess or obsolete inventory, a reduction in the average selling price, or a reduction in our gross margin include: a sudden or significant decrease in demand for our products; a production or design defect in our products; a higher incidence of inventory obsolescence because of rapidly changing technology and customer requirements; a failure to accurately estimate customer demand for our products, including for our older products as our new products are introduced; or our competitors introducing new products or taking aggressive pricing actions.
Our ability to design and introduce new products in a timely manner includes the use of third-party intellectual property.
In the design and development of new and enhanced products, we rely on third-party intellectual property such as development and testing tools for software and hardware. Furthermore, certain product features may rely on intellectual property acquired from third parties that we incorporate into our software or hardware. The design requirements necessary to meet customer demand for more features and greater functionality from semiconductor products may exceed the capabilities of the third-party intellectual property or development or testing tools available to us. If the third-party intellectual property that we use becomes unavailable, is not available with required functionality or performance in the time frame, manufacturing technology, or price point needed for our new products or fails to produce designs or functionality that meet customer demands, or laws are adopted that affect our use of third party intellectual property in certain regions or products, our business could be materially adversely affected.
26
We depend on third-party companies for the design, manufacture and supply of motherboards, software, memory and other computer platform components to support our business and products.
We depend on third-party companies for the design, manufacture and supply of motherboards, graphics cards, software (e.g., BIOS, operating systems, drivers, AI models or tools), memory and other components that we use to design, support and sell, and our customers utilize to support and/or use our product offerings. We also rely on our AIB partners to support our products. In addition, our microprocessors are not designed to function with motherboards and chipsets designed to work with Intel microprocessors. If the designers, manufacturers, AIBs and suppliers of motherboards, graphics cards, software, memory and other components cease or reduce their design, quality, manufacture or production of current or future products that are based on, utilized in, or support our products, or laws are adopted that result in the same, our business could be materially adversely affected.
If we lose Microsoft Corporation’s support for our products or other software vendors do not design and develop software to run on our products, our ability to sell our products could be materially adversely affected.
Our ability to innovate beyond the x86 instruction set controlled by Intel depends partially on Microsoft designing and developing its operating systems to run on or support our x86-based microprocessor products. With respect to our graphics products, we depend in part on Microsoft to design and develop its operating system to run on or support our graphics products. Similarly, the success of our products in the market, such as our APU products, is dependent on independent software providers designing and developing software to run on our products. If Microsoft does not continue to design and develop its operating systems so that they work with our x86 instruction sets or does not continue to develop and maintain their operating systems to support our graphics products, independent software providers may forego designing their software applications to take advantage of our innovations and customers may not purchase PCs with our x86 products. In addition, some software drivers licensed for use with our x86 products are certified by Microsoft. If Microsoft did not certify a driver, or if we otherwise fail to retain the support of Microsoft or other software vendors, our ability to market our x86 products would be materially adversely affected.
Our reliance on third-party distributors and AIB partners subjects us to certain risks.
We market and sell our products directly and through third-party distributors and AIB partners pursuant to agreements that can generally be terminated for convenience by either party upon prior notice. These agreements are non-exclusive and permit both our distributors and AIB partners to offer our competitors’ products. We are dependent on our distributors and AIB partners to supplement our direct marketing and sales efforts. If any significant distributor or AIB partner or a substantial number of our distributors or AIB partners terminated their relationship with us, decided to market our competitors’ products over our products or decided not to market our products at all, our ability to bring our products to market would be impacted and we would be materially adversely affected. We extend credit to certain of our distributors and AIB partners. If we are unable to collect accounts receivable from our significant distributors and/or AIB partners or incur higher allowances for credit losses, it could have a material adverse effect on our business. If we are unable to manage the risks related to the use of our third-party distributors and AIB partners or offer appropriate incentives to focus them on the sale of our products, our business could be materially adversely affected.
Additionally, distributors and AIB partners typically maintain an inventory of our products. In most instances, our agreements with distributors protect their inventory of our products against price reductions, as well as provide return rights for any product that we have removed from our price book that is less than 12 months older than the manufacturing date. Some agreements with our distributors also contain standard stock rotation provisions permitting limited levels of product returns. Our agreements with AIB partners protect their inventory of our products against price reductions. In the event of a significant decline in the price of our products, the price protection rights we offer would materially adversely affect us because our revenue and corresponding gross margin would decline.
27
Our business depends on the proper functioning of our internal business processes and information systems and modification or interruption of such systems may disrupt our business, processes and internal controls.
We rely upon a number of internal business processes and information systems to support key business functions, and the efficient operation of these processes and systems is critical to our business. Our business processes and information systems need to be sufficiently scalable to support the growth of our business and may require modifications or upgrades that expose us to a number of operational risks. As such, our information systems will continually evolve and adapt in order to meet our business needs. These changes may be costly and disruptive to our operations and could impose substantial demands on management time.
These changes may also require changes in our information systems, modification of internal control procedures and significant training of employees and third-party resources. We continuously work on simplifying our information systems and applications through consolidation and standardization efforts. There can be no assurance that our business and operations will not experience any disruption in connection with this transition. Our information technology systems, and those of third-party information technology providers or business partners, may also be vulnerable to damage or disruption caused by circumstances beyond our control including catastrophic events, power anomalies or outages, natural disasters, viruses or malware, cyberattacks, insider threat attacks, unauthorized system or data modifications, data breaches and computer system or network failures, exposing us to significant cost, reputational harm and disruption or damage to our business.
In addition, as our IT environment continues to evolve, we are embracing new ways of communicating and sharing data internally and externally with customers and partners using methods such as mobility and the cloud that can promote business efficiency. However, these practices can also result in a more distributed IT environment, making it more difficult for us to maintain visibility and control over internal and external users, and meet scalability and administrative requirements. If our security controls cannot keep pace with the speed of these changes or if we are not able to meet regulatory and compliance requirements, our business would be materially adversely affected.
If our products are not compatible with some or all industry-standard software and hardware, we could be materially adversely affected.
Our products may not be fully compatible with some or all industry-standard software and hardware. Further, we may be unsuccessful in correcting any such compatibility problems in a timely manner. If our customers are unable to achieve compatibility with software or hardware, we could be materially adversely affected. In addition, the mere announcement of an incompatibility problem relating to our products could have a material adverse effect on our business.
Costs related to defective products could have a material adverse effect on us.
Products as complex as those we offer may contain defects or failures when first introduced or when new versions or enhancements to existing products are released. We cannot assure you that, despite our testing procedures, errors will not be found in new products or releases after commencement of commercial shipments in the future, which could result in loss of or delay in market acceptance of our products, material recall and replacement costs, loss of revenue, writing down the inventory of defective products, the diversion of the attention of our engineering personnel from product development efforts, defending against litigation related to defective products or related liabilities, including property damage, personal injury, damage to our reputation in the industry and loss of data or intangible property, and could adversely affect our relationships with our customers. In addition, we may have difficulty identifying the end customers of the defective products in the field. As a result, we could incur substantial costs to implement modifications to correct defects. Any of these problems could materially adversely affect our business.
We could be subject to potential product liability claims if one of our products causes, or merely appears to have caused, an injury, whether tangible or intangible. Claims may be made by consumers or others selling our products, and we may be subject to claims against us even if an alleged injury is due to the actions of others. A product liability claim, recall or other claim with respect to uninsured liabilities or for amounts in excess of insured liabilities could have a material adverse effect on our business.
28
If we fail to maintain the efficiency of our supply chain as we respond to changes in customer demand for our products, our business could be materially adversely affected.
Our ability to meet customer demand for our products depends, in part, on our ability to deliver the products our customers want on a timely basis. Accordingly, we rely on our supply chain for the manufacturing, distribution and fulfillment of our products. As we continue to grow our business, expand to high-growth adjacent markets, acquire new customers and strengthen relationships with existing customers, the efficiency of our supply chain will become increasingly important because many of our customers tend to have specific requirements for particular products, geographic requirements, and specific time-frames in which they require delivery of these products. If we are unable to consistently deliver the right products to our customers on a timely basis in the right locations, our customers may reduce the quantities they order from us, which could have a material adverse effect on our business.
We outsource to third parties certain supply-chain logistics functions, including portions of our product distribution, transportation management and information technology support services.
We rely on third-party providers to operate our regional product distribution centers and to manage the transportation of our work-in-process and finished products among our facilities, to our third-party manufacturers and to our customers. In addition, we rely on third parties to provide certain information technology services to us, including help desk support, desktop application services, business and software support applications, server and storage administration, data center operations, database administration and voice, video and remote access. We cannot guarantee that these providers will fulfill their respective responsibilities in a timely manner in accordance with the contract terms, in which case our internal operations and the distribution of our products to our customers could be materially adversely affected. Also, we cannot guarantee that our contracts with these third-party providers will be renewed, in which case we would have to transition these functions in-house or secure new providers, which could have a material adverse effect on our business if the transition is not executed appropriately.
Our inability to effectively control the sales of our products on the gray market could have a material adverse effect on us.
We market and sell our products through a global, multi-tier network of authorized distributors, resellers and OEMs. Despite programmatic controls, audits and contractual restrictions, our pricing programs may be misused, and unauthorized resellers or unauthorized resale can occur on the “gray market”. Gray market activities could result in customer satisfaction issues because any time products are purchased outside our authorized distribution channels there is a risk that our customers are buying counterfeit or substandard products, including products that may have been altered, mishandled or damaged, or are used products represented as new. These substandard gray market products may have higher-than-expected failure rates and as a result, we may face brand protection risks, reputational harm or unauthorized warranty claims. Gray market products result in shadow inventory that is not visible to us, making it difficult to forecast demand accurately. Also, when gray market products enter the market, we and our distribution channels compete with these heavily discounted gray market products, which adversely affects demand for our products and negatively impacts our margins. We also face risks of product diversion into restricted markets, including reexports or sales to prohibited end users/end uses. Products acquired on the gray market or through other unauthorized channels are at higher risk of being re-sold to prohibited end-users, misused, and deployed for uses that do not align with AMD’s ethics, values or compliance standards. Despite our compliance programs and procedures for mitigating these risks through customer and transaction screening, distributor audits, law enforcement and NGO cooperation and export control compliance (including licensing where required), we may not fully eliminate these risks.
29
Climate change may have an impact on our business.
Climate change may adversely affect our business, as well as that of our suppliers and customers. Increasing frequency and severity of natural disasters and climate-related events could impact the major regions where we have operations and could disrupt our business and that of our customers and suppliers. Our headquarters and some of our operations and facilities are located in areas that are susceptible to earthquakes and tsunamis, wildfires, extreme storms, flooding, extreme heat, drought, freezing, tropical cyclones and other natural disasters. Water and energy availability and reliability in the regions where we have facilities and where our suppliers and customers have operations is important to our business. Certain natural disasters could disrupt our operations and our suppliers’ or customers’ operations, including by disrupting, the availability of energy or water necessary for the operations of our business or those of our suppliers and customers. Such disruptions could interrupt our supply chain, delay manufacturing and product shipments, lead to a loss of business and higher costs to maintain or restore operations, any of which could adversely affect our business and operating results. Supply chain delays resulting from climate change related disruptions may lead to contractual disputes, litigation and increasing costs. Data centers depend on access to clean water and reliable energy. Customers’ ability to obtain sufficient energy capacity to meet demand is a complicated, multi-year process that involves regulatory and technical challenges. If customers cannot secure sufficient power or water, or experience outages or shortages of these resources, they may be unable to expand their data center capacity and may reduce or stop purchases from us.
Although we maintain property, casualty, and other insurance, coverage varies by type, availability and cost. Some of our policies have large deductibles and broad exclusions. Additionally, our insurance providers may be unable or unwilling to pay a claim. Losses not covered by insurance may be significant, which could materially harm our results of operations and financial condition.
Our business and the business of our suppliers and customers may also be subject to current and future climate-related regulations, contract terms and lawsuits. Increased regulations on carbon taxes, greenhouse gas emissions, fuel or energy taxes will likely result in greater costs, such as through carbon pricing impact on utilities or through requiring greater renewable energy purchases than otherwise planned.
Our supply chain manufacturing suppliers may incur increased costs of doing business should they be affected by new climate-related expectations such as those affecting abatement equipment, renewable energy, and/or alter production processes and materials selections. The additional compliance costs incurred by our suppliers may be passed on to us and result in greater indirect costs to us. These costs and restrictions could materially harm our business and results of operations by increasing our expenses, damaging our reputation for actual or perceived non-compliance, or requiring us to alter our operations and products. The long-term effects of climate change on the global economy and the technology industry are unclear but could be severe. Additionally, we are or expect to be subject to various new or proposed climate-related disclosure requirements and we expect to incur costs and resources in order to comply. Failure to comply with such reporting obligations may result in enforcement actions, litigation or reputational harm and could have a material adverse effect on us.
30
Legal and Regulatory Risks
Government actions and regulations such as export regulations, import tariffs, and trade protection measures may limit our ability to export our products to certain customers.
We are subject to U.S. laws and regulations, including the Export Administration Regulations (EAR) administered by the Bureau of Industry and Security (BIS) of the U.S. Department of Commerce, which restrict the export of certain products and technologies to certain countries, including China, Russia, and Belarus, among others. These restrictions may limit our ability to sell certain products or technologies in these markets or to certain customers.
Evolving U.S. government policy toward semiconductor exports, particularly in the context of national security and foreign policy priorities could adversely affect our business. In October 2023, the Bureau of Industry and Security (BIS) of the United States Department of Commerce issued requirements for the export of certain advanced computing items to a party headquartered in, or with an ultimate parent headquartered in, any of Country Groups D1, D4 or D5, including China (a D5 Country). These controls prevent us from shipping certain AMD Instinct™ integrated circuits and certain AMD Versal™ FPGAs to China, or to customers outside of the United States who are headquartered in—or whose ultimate parent is headquartered in—a D5 Country, without a license. BIS may not timely update performance-based licensing thresholds in the 2023 export requirements and/or may issue new licensing requirements and regulatory controls in the future. Accordingly, there is a risk that new products which exceed current licensing thresholds, or even those below current licensing thresholds, may not succeed because BIS could determine they are subject to licensing requirements. U.S. export restrictions on semiconductors and semiconductor technology to China and Chinese customers negatively impact our ability to sell to customers in China and make it easier for our China-based competitors to develop and sell their own solutions and reduce the need for our products. In April 2025, the U.S. government implemented a new license requirement for the export of certain semiconductor products to a D5 Country, and to companies headquartered in, or with an ultimate parent located in such D5 Country. This restriction impacts our AMD Instinct™ MI308 products. As a result of the restriction, we incurred approximately $800 million in inventory and related charges in the second quarter of 2025. We applied for and were granted some licenses by the U.S. government that allow us to ship our MI308 products to certain China-based customers. During the fourth quarter of fiscal year 2025, we began shipping products and reversed approximately $360 million of the charges recorded earlier in the year. Sales of our MI308 products into China depend on customer demand, China’s import control rules and our ability to obtain licenses. In August 2025, U.S. government officials expressed an expectation that the U.S. government will receive 15% of the revenue generated from licensed MI308 sales to China. However, to date, the U.S. government has not published a regulation establishing such requirement. Any request for a percentage of the revenue by the U.S. government could subject us to litigation, increase our costs and harm our competitive position and benefit competitors that are not subject to such arrangements.
Additional export restrictions imposed in the future may not only impact our ability to serve China but could also impact our ability to serve other markets. If any new export controls impact more of our products, we may be unable to sell our inventory of such products and we may further incur inventory and related charges since there is no assurance that the U.S. government will grant licenses at all or in a timely manner. Even if we are granted licenses, the licenses may be temporary or could impose onerous conditions for us or our customers. If we are not granted licenses, we may be unable to develop a competitive product for the China market that is not subject to licensing requirements. Limits on sales of our offerings in the China market due to export controls could impact our competitive position compared to domestic Chinese competitors and other companies or competitors not subject to the same restrictions. As such, we could lose market position and our business, operating results, and financial condition would be adversely impacted.
In January 2025, BIS issued a final rule, commonly referred to as the “AI Diffusion Rule,” that would have imposed new restrictions on the export, reexport and in-country transfer of certain advanced semiconductor devices and technology. In May 2025, BIS announced its intention to rescind the AI Diffusion Rule, publish a regulation formalizing the rescission, and issue replacement rules in the future. The replacement rules may limit our ability to engage in certain business transactions, require new export licenses, delay shipments, or necessitate changes in our compliance processes and product designs to ensure regulatory compliance. Additionally, BIS’s announced plans introduce uncertainty as we evaluate whether specific products, technologies, or software fall within the scope of any new restrictions, and whether BIS will grant licenses in a timely matter or at all. Compliance with the planned or existing rules could result in increased costs, disruption of key customer and supplier relationships, loss of competitive positioning in international markets or reputational harm.
31
The implementation or increase of any tariffs, trade protection measures or restrictions, or retaliatory actions from foreign governments could result in lost sales and adversely impact our reputation and business. The U.S. government has instituted or proposed changes in trade policies that include higher tariffs on imports into the U.S. and other government regulations affecting trade between the United States and other countries where we conduct our business. Such changes to U.S. trade policy have the potential to adversely impact the U.S. economy or sectors thereof and could significantly impact our business, in particular the import of products used in our business that are manufactured outside the U.S. Any retaliatory actions by affected countries and foreign governments could result in tariffs, trade protection measures or other restrictions imposed on our current and future products. Our customers’ costs of doing business may increase or their sales may be negatively affected. As such, customer demand for our products may decline, which could adversely impact our ability to generate revenue and result in inventory impairment changes. For instance, tariffs on hardware required for data centers could raise costs for our customers, potentially causing them to delay or cancel AI infrastructure investments. Further, to the extent that the United States, China or other countries seek to promote products that are produced domestically or reduce their dependence on products from another country, they may implement regulations or policies that may negatively affect our business.
The United States and other countries’ export control regulations continue to focus on targeting semiconductors associated with AI, including GPUs and associated products and services, by restricting or prohibiting their unlicensed sale or supply to U.S. embargoed or sanctioned countries, governments, persons and entities. The United States has imposed unilateral controls restricting GPUs and associated products, and is likely to further adopt other unilateral or multilateral controls. The scope and application of such controls have been and may continue to be broad, which may prohibit us from exporting or providing access to our products to customers in one or more markets, including but not limited to China, and could negatively impact our manufacturing, testing and warehousing locations, or could impose other conditions that limit our ability to meet demand abroad. If export controls targeting semiconductors associated with AI including GPUs and associated products and services are further tightened, or the classification of our products under those controls’ changes, our ability to export our technology, products or services could be further restricted. We may also be at a competitive disadvantage if our competitors are not subject to the same or similar restrictions or classifications. Such export controls have, and may in the future, subject downstream recipients of our products to additional restrictions on the use, resale, repair or transfer of our products and may have a material adverse effect on us. New export control restrictions may adversely impact the ability of our research and development teams located outside of the United States from executing our product roadmaps in a timely manner or at all. In addition, deemed export restrictions could further affect our ability to provide services or develop products in the United States. Continued changes to export control regulations that we are subject to, or changes to their interpretation and enforcement, could result in greater compliance costs and other compliance burdens on our business and our customers which could adversely impact our business. Export controls have and may continue to encourage customers in China and other markets subject to those controls to pursue alternatives to U.S. semiconductors for their product designs to limit compliance burdens and potential impact on their product roadmaps. From time to time, governments provide incentives or make other investments that could benefit and give a competitive advantage to our competitors. Government incentives may not be available to us on acceptable terms or at all. If our competitors can benefit from such government incentives and we cannot, it could strengthen our competitors’ relative position and have a material adverse effect on our business.
32
We have equity interests in two joint ventures (collectively, the THATIC JV) with Higon Information Technology Co., Ltd. (THATIC), a third-party Chinese entity. In June 2019, BIS added certain Chinese entities to the Entity List, including THATIC and the THATIC JV. Since that time, the United States administration has called for changes to domestic and foreign policy, including policies with respect to China and Russia. Specifically, United States-China trade relations remain uncertain as the United States continues to add more Chinese companies to the Entity List and introduce new regulations on advanced computing, semiconductor manufacturing, and AI, while China has imposed retaliatory tariffs. Moreover, as the U.S. government continues adding companies to the Entity List, our supply chain may be negatively impacted as we may be required to suspend purchasing from such suppliers or selling to such customers or otherwise unable to fulfill our contractual obligations to them. For example, in September 2025, BIS issued a new rule designating any entity that is at least 50% owned by one or more entities on the Entity List will be subject to Entity List restrictions and this rule similarly applies to entities at least 50% owned by listed “military end users” and certain sanctioned parties. In October 2025, the U.S. government announced that it planned to suspend enforcement of this new rule for one year. However, the restrictions can be reimposed at any time. These restrictive governmental actions and any similar measures that may be imposed on U.S. companies by other governments, especially in light of ongoing trade tensions with U.S. trading partners, will likely limit or prevent us from doing business with certain of our customers or suppliers and harm our ability to compete effectively or otherwise negatively affect our ability to sell our products. If we were ever found to have violated these laws or similar applicable non-U.S. laws, even if the violation occurred without our knowledge, we may be subject to penalties, which could adversely affect our reputation, business, operating results and financial condition.
We may, from time to time, receive technical data from third parties that is subject to the International Traffic and Arms Regulations (ITAR), which are administered by the U.S. Department of State. Export Administration Regulation (EAR) governs the export and re-export of certain AMD products, including FPGAs, as well as the transfer of related technologies or provision of services, whether in the U.S. or abroad. We are required to maintain an internal compliance program and security infrastructure to meet EAR and ITAR requirements. An inability to obtain the required export licenses, or to predict when or pursuant to which conditions they will be granted, increases the difficulties of forecasting shipments. When we file license applications or Notification Advanced Computing (NAC) exception notices we have no assurance that BIS will grant any exemptions or licenses or that the BIS will act on the filings in a timely manner. Even if BIS grants a requested license, the license may come with burdensome conditions that we cannot or decide not to fulfill. In addition, security or compliance program failures that could result in penalties or a loss of export privileges, as well as stringent licensing restrictions that may make our products less attractive to overseas customers, could have a material adverse effect on our business, financial condition and/or operating results.
If we cannot realize our deferred tax assets, our results of operations could be adversely affected.
Our deferred tax assets include tax credit carryforwards that can be used to offset taxable income and reduce income taxes payable in future periods. Each quarter, we consider both positive and negative evidence to determine whether all or a portion of the deferred tax assets are more likely than not to be realized. If we determine that some or all of our deferred tax assets are not realizable, it could result in a material expense in the period in which this determination is made which may have a material adverse effect on our financial condition and results of operations.
Our business is subject to potential tax liabilities, and exposure to greater-than-anticipated income tax liabilities as a result of changes in tax rules and regulations, changes in interpretation of tax rules and regulations, or unfavorable assessments from tax audits, could affect our effective tax rates, financial condition, and results of operations.
We are a U.S.-based multinational company subject to income tax, indirect tax or other tax claims in multiple U.S. and foreign tax jurisdictions in which we conduct business. Significant judgment is required in determining our worldwide provision for income taxes. Tax laws are dynamic and subject to change as new laws are passed and new interpretations of the law are issued or applied. Any changes to tax laws could have a material adverse effect on our tax obligations and effective tax rate. Our income tax obligations could be affected by many factors, including, but not limited to, changes to our corporate operating structure, intercompany arrangements, and tax planning strategies.
33
Our income tax expense is computed based on tax rates enacted at the time of the respective financial period. Our future effective tax rates, financial condition and results from operations could be unfavorably affected by changes in the tax rates in jurisdictions where our income is earned, by changes in the tax rules and regulations or the interpretation of tax rules and regulations in the jurisdictions in which we do business or by changes in the valuation of our deferred tax assets. Many countries have implemented legislation and other guidance to align their international tax rules with the Organization for Economic Co-operation and Development’s (OECD) Base Erosion and Profit Shifting recommendations and action plan that aim to standardize and modernize global corporate tax policy, including changes to cross-border tax, transfer pricing documentation rules, and nexus-based tax incentive practices. The OECD is also continuing discussions surrounding fundamental changes in allocation of profits among tax jurisdictions in which companies do business, as well as the implementation of a global minimum tax (namely “Pillar One” and “Pillar Two”). In January 2026, the OECD released a "side-by-side" package introducing new safe harbors and providing an exemption for U.S.-based multinational companies from parts of the global minimum tax framework. This guidance is intended to simplify compliance with a permanent simplified Effective Tax Rate safe harbor, a one-year extension of the transitional Country-by-Country Reporting safe harbor and reinforce the role of Qualified Domestic Minimum Top-up Taxes (QDMTT). While these rules are generally favorable to the Company, they need to be adopted by each country to be considered enacted for financial accounting purposes. As new guidance becomes available in each country, we will continue to evaluate the impact of the proposed and enacted legislative changes to our effective tax rate and cash flows.
In addition, we are subject to examinations of our income tax returns by domestic and foreign tax authorities. We regularly assess the likelihood of outcomes resulting from these examinations to determine the adequacy of our provision for income taxes and have reserved for potential adjustments that may result from the current examinations. There can be no assurance that the final determination of any of these examinations will not have an adverse effect on our effective tax rates, financial condition, and results of operations.
In the ordinary course of our business, there are many transactions and calculations where the ultimate income tax, indirect tax, or other tax determination is uncertain. Although we believe our tax estimates are reasonable, we cannot assure that the final determination of any tax audits or litigation will not be materially different from that which is reflected in historical tax provisions and accruals. Should additional taxes be assessed as a result of an audit, assessment or litigation, there could be a material adverse effect on our cash, tax provisions and results of operations in the period or periods for which that determination is made.
We are party to litigation and may become a party to other claims or litigation that could cause us to incur substantial costs or pay substantial damages or prohibit us from selling our products.
From time to time, we are a defendant or plaintiff in various legal actions, as described in Note 12 - Commitments and Contingencies of the Notes to our Consolidated Financial Statements. For example, we have been subject to certain claims concerning federal securities laws and corporate governance. Our products are purchased by and/or used by consumers, which could increase our exposure to consumer actions such as product liability claims and consumer class action claims. On occasion, we receive claims that individuals were allegedly exposed to substances used in our former semiconductor wafer manufacturing facilities and that this alleged exposure caused harm. Litigation can involve complex factual and legal questions, and its outcome is uncertain. It is possible that if a claim is successfully asserted against us, it could result in the payment of damages that could be material to our business.
34
With respect to intellectual property litigation, from time to time, we have been notified of, or third parties may bring or have brought, actions against us and/or against our customers based on allegations that we are infringing the intellectual property rights of others, contributing to or inducing the infringement of the intellectual property rights of others, improperly claiming ownership of intellectual property or otherwise improperly using the intellectual property of others. If any such claims are asserted, we may seek to obtain a license under the third parties’ intellectual property rights. We cannot assure you that we will be able to obtain all of the necessary licenses on satisfactory terms, if at all. These parties may file lawsuits against us or our customers seeking damages (potentially up to and including treble damages) or an injunction against the sale of products that incorporate allegedly infringed intellectual property or against the operation of our business as presently conducted, which could result in our having to stop the sale of some of our products or to increase the costs of selling some of our products or which could damage our reputation. The award of damages, including material royalty payments, or other types of damages, or the entry of an injunction against the manufacture and sale of some or all of our products could have a material adverse effect on us. We could decide, in the alternative, to redesign our products or to resort to litigation to challenge such claims. Such challenges could be extremely expensive and time-consuming regardless of their merit, could cause delays in product release or shipment and/or could have a material adverse effect on us. We cannot assure you that litigation related to our intellectual property rights or the intellectual property rights of others can always be avoided or successfully concluded.
Even if we were to prevail, any litigation could be costly and time-consuming and would divert the attention of our management and key personnel from our business operations, which could have a material adverse effect on us.
We are subject to environmental laws, conflict minerals regulations, as well as a variety of other laws or regulations that could result in additional costs and liabilities.
Our operations and properties are subject to various United States and foreign laws and regulations, including those relating to materials used in our products and the manufacturing processes of our products, discharge of pollutants into the environment, the treatment, transport, storage and disposal of solid and hazardous wastes and remediation of contamination. In addition, our operations and those of our suppliers are further governed by regulations prohibiting the use of forced labor (e.g., mining conflict materials), and restrictions on other materials, as well as laws or regulations governing the operation of our facilities, sale and distribution of our products, and real property. For the manufacturing of our products, these laws and regulations require our suppliers to obtain permits for operations, including the discharge of air pollutants and wastewater. Although our management systems are designed to oversee our suppliers’ compliance, we cannot assure you that our suppliers have been or will be in complete compliance with such laws, regulations and permits. If our suppliers violate or fail to comply with any of them, a range of consequences could result, including fines, suspension of production, alteration of manufacturing processes, import/export restrictions, sales limitations, criminal and civil liabilities or other sanctions. Such non-compliance from our manufacturing suppliers could result in disruptions in supply, higher sourcing costs, and/or reputational damage for us. We could also be held liable for any and all consequences arising out of exposure to hazardous materials used, stored, released, disposed of by us or located at, under or emanating from our current or former facilities or other environmental or natural resource damage. We have been named as a responsible party at three Superfund sites in Sunnyvale, California and we are subject to Final Site Clean-up Requirements Orders from the California Regional Water Quality Control Board relating to the three sites and we have entered into settlement agreements with other responsible parties on two of the orders. During the term of such agreements, other parties have agreed to assume most of the foreseeable costs as well as the primary role in conducting remediation activities under the orders. We remain responsible for additional costs beyond the scope of the agreements as well as all remaining costs in the event that the other parties do not fulfill their obligations under the settlement agreements. The progress of future remediation efforts cannot be predicted with certainty and these costs may change. Although we have not been, we could be named a potentially responsible party at other Superfund or contaminated sites in the future. In addition, contamination that has not been identified could exist at our other facilities.
Future environmental legal requirements may become more stringent or costly. As such, the costs of complying with current and future environmental and health and safety laws, and our liabilities arising from past and future releases of, or exposure to, hazardous substances may increase and could have a material adverse effect on us.
35
Environmental laws are complex, change frequently and tend to become more stringent over time. For example, the European Union (EU) and China are among a growing number of jurisdictions that have enacted restrictions on the use of lead and other materials in electronic products. These regulations affect semiconductor devices and packaging. As regulations restricting materials in electronic products continue to increase around the world, there is a risk that the cost, quality and manufacturing yields of products that are subject to these restrictions may be less favorable compared to products that are not subject to such restrictions, or that the transition to compliant products may not meet customer roadmaps, or produce sudden changes in demand, which may result in excess inventory. Jurisdictions including the EU, Australia, California and China are developing or have finalized market entry or public procurement regulations for computers and servers based on ENERGY STAR specifications, and the like, as well as additional energy consumption limits. Certain of our products may be excluded from some of these markets which could materially adversely affect us. We incur costs associated with complying with conflict minerals reporting requirements to our customers and the SEC. In addition to the SEC regulation, the EU, China and other jurisdictions are developing new policies focused on conflict minerals that may impact and increase the cost of our compliance program. Customers are increasingly seeking information about the source of minerals used in our supply chain beyond those addressed in laws and regulations. Given the complexity of mineral supply chains, we may be unable to sufficiently verify the origins of the subject minerals and thus our reputation may be harmed. Moreover, we are likely to encounter challenges to satisfy customers who require that all of the components of our products be certified as “conflict free.” If we cannot satisfy these customers, they may choose a competitor’s products. In addition, new or increased regulations limiting the use of such components, or regulation regarding greenhouse gas emissions and climate change-related risks, could increase our energy costs, for example as a result of carbon pricing impacts on electrical utilities and/or necessitating that we purchase more renewable energy than otherwise planned. Our supply chain manufacturing suppliers may be exposed to increased cost of doing business should they be affected by new climate-related regulations, for example, affecting abatement equipment, renewable energy, and/or alter production processes and materials selections.
In addition to our Company, customers, governments and authorities continue to focus on eliminating risks of forced labor in supply chains which may increase the cost of our compliance program. Several customers have also issued expectations to eliminate these occurrences, if any, that may impact us. While we have a Human Rights Policy and management systems to identify and avoid these practices in our supply chain, we cannot guarantee that our suppliers will always be in conformance with laws and expectations. Our failure to satisfy customer expectations on forced and trafficked labor policies may result in these customers choosing a competitor’s product or enforcement liability and reputational challenges.
In addition, many governments have enacted laws around PII, such as the GDPR and the CCPA, and the failure to comply could result in sanctions or other actions by the governments. The GDPR imposes significant requirements on how we collect, process and transfer personal data, as well as significant fines for non-compliance.
New emerging technology trends, such as AI, require us to keep pace with evolving regulations and industry standards. Given the complexity and rapid development of AI, there are various current and proposed regulatory frameworks relating to the use of AI in products and services. For example, the EU AI Act was adopted in 2024 and its implementation will be phased in over the next few years. In other jurisdictions, similar legislation is being considered. Such laws and regulations may impede our ability to offer certain products and services in certain jurisdictions if we are unable to comply with them. We expect that the legal and regulatory environment relating to emerging technologies such as AI will continue to develop and could increase costs and burdens to us and our customers, delay or halt deployment of new systems using our products, reduce the number for entrants and customers and create compliance risks and potential liability, all which may have a material adverse effect on our financial condition and results of operations. Governments are also considering the new issues in intellectual property law that AI creates, which could result in different intellectual property rights in technology we create with AI and development processes and procedures and could have a material adverse effect on our business.
36
Evolving expectations from governments, investors, customers and other stakeholders regarding corporate responsibility matters could result in additional costs, harm to our reputation and a loss of customers.
There are evolving expectations from governments, investors, customers and other stakeholders regarding corporate responsibility matters including those involving the environment and climate, energy and water consumption, diversity and inclusion, human rights, governance and cybersecurity. Additionally, we are and expect to continue to be subject to various new and proposed climate-related and sustainability laws and requirements that may impact how we and our suppliers and customers conduct and report on our business by requiring the disclosure and tracking of greenhouse gas emissions, climate change-related risks and other sustainability matters. As corporate responsibility reporting and disclosure requirements continue to evolve, we may incur additional compliance costs and indirect compliance costs that our customers and suppliers may pass on to us. Emerging legal and regulatory requirements in the various jurisdictions in which we operate, can be unpredictable, are subject to change, and may be difficult for us to comply with given the complexity of our supply chain and our outsourced manufacturing. As a result, we may be required to modify our business or supply chain in ways that are costly or less efficient. For example, the state of California has passed reporting requirements that will require corporations to report on climate data and risks, and these laws include data assurance requirements that entail third-party verifications. Our failure to comply, or the appearance of our failure to comply, with these legal and regulatory requirements can result in regulatory penalties, fines and legal liabilities, increase costs, and harm our reputation – any of which could materially adversely affect our business, financial condition and results of operation. While we have engaged, and may continue to engage, in voluntary initiatives (such as voluntary disclosures, certifications, goals, or targets, among others) or commitments to improve our corporate responsibility profile and/or products or to respond to stakeholder expectations, such initiatives or achievement of such commitments may be costly, may not have the desired effect or may impact our reputation with other stakeholders and have a material adverse effect on our business.
For example, we have publicly announced certain corporate responsibility goals spanning multiple topics informed by input from various of our stakeholders, including customers, investors and employees. These goals, which reflect our current plans and aspirations based on known conditions, may change in the future or may not be achieved, as they are subject to various challenges, risks and expectations such as standards, processes, and methodologies that continue to evolve or emerge, and many of these matters are outside our control. Our progress towards some goals receives third-party limited assurance and not reasonable assurance, or may rely on receipt of others’ information and data that may not be subject to either third-party limited or reasonable assurance. Any failure to achieve such goals, failure to achieve these goals within the set timeframe, or the perception by stakeholders of such failure to achieve these goals may result in reputational or financial harm.
Simultaneously, there are efforts by some stakeholders to reduce companies’ efforts on certain environmental, social and governance matters. Both advocates and opponents of environmental, social and governance matters are increasingly resorting to a range of activism forms, including media campaigns and litigation, to advance their perspectives. To the extent we are subject to such activism or litigation, it may require us to incur costs or otherwise adversely impact our business. Stakeholder groups may find our stated goals to be insufficiently responsive to the implications of issues, and any failure to meet stakeholder expectations may result in loss of customers or in investors selling their shares, which could harm our reputation and could have a material adverse effect on our business.
37
Issues related to the responsible use of AI may result in reputational, competitive and financial harm and liability.
We offer products that include capabilities to support AI deployment and we expect this part of our business to grow. As with many new emerging technologies, AI presents risks and challenges and increasing legal, social and ethical concerns relating to its responsible use that could affect the adoption of AI, and thus our business. Third-party misuse of AI applications, models, or solutions, or ineffective or inadequate AI development or deployment practices by us or our customers, could cause harm to individuals or society and impair the public’s acceptance of AI. Moreover, we may be subject to competitive harm, regulatory action and legal liability as a result of new and proposed legislation regulating AI, as well as new applications of existing data protection, privacy and intellectual property and other laws. Such regulations and changes thereto could cause us to incur greater compliance costs, could impact our ability to sell or the ability of our customers and users worldwide to acquire, deploy and use systems that include our AI-related products and services and reduce the number of customers, which could negatively impact our business and financial results. As there continues to be an increasing focus on risks related to AI technologies, there may be an increasing focus on regulatory restrictions that target products and services that enable or facilitate AI and that may negatively impact some of our AI-related products and services. If the AI-related products that we offer have unintended consequences, infringe intellectual property rights or rights of publicity, or are misused by our customers or are otherwise controversial due to their perceived or actual impact on human rights, privacy, cybersecurity, employment or other social, economic or political issues the public’s acceptance of AI may be impaired and this may also result in reputational, competitive and financial harm and liability to our business.
The agreements governing our notes, our guarantee of the Assumed Xilinx Notes and the Revolving Credit Agreement impose restrictions on us that may adversely affect our ability to operate our business.
The indentures governing our 3.924% Senior Notes due 2032, 4.393% Senior Notes due 2052, 4.212% Senior Notes due 2026 and 4.319% Senior Notes due 2028 contain various covenants that limit our ability to, among other things: create liens on certain assets to secure debt, enter into certain sale and leaseback transactions; and consolidate with, merge into or sell, convey or lease all or substantially all of our assets to any other person.
We unconditionally guarantee, on a senior unsecured basis, Xilinx’s obligations under the Xilinx’s 2.375% Notes due 2030 (the Assumed Xilinx Notes). The supplemental indenture governing the Assumed Xilinx Notes also contain various covenants which limit our ability to, among other things, create certain liens on principal property or the capital stock of certain subsidiaries, enter into certain sale and leaseback transactions with respect to principal property, and consolidate or merge with, or convey, transfer or lease all or substantially all our assets, taken as a whole, to another person.
We also have an unsecured revolving credit facility in the aggregate principal amount of $3.0 billion (Revolving Credit Agreement). Our Revolving Credit Agreement contains various covenants which limit our ability to, among other things, incur liens; and consolidate or merge or sell our assets as an entirety or substantially as an entirety (in each case, except for certain customary exceptions). In addition, our Revolving Credit Agreement requires us to maintain a minimum consolidated interest coverage ratio at the end of each fiscal quarter. The agreement governing our convertible notes and our Revolving Credit Agreement contains provisions whereby a payment default or acceleration under certain agreements with respect to other material indebtedness would result in cross defaults under our convertible indenture or the Revolving Credit Agreement and allow note holders or the lenders under our Revolving Credit Agreement to declare all amounts outstanding under certain of our indentures or the Revolving Credit Agreement to be immediately due and payable. If the lenders under our Revolving Credit Agreement accelerate the repayment of borrowings, we cannot assure you that we will have sufficient assets to repay those borrowings. Also, we enter into sale and factoring arrangements from time to time with respect to certain accounts receivables, which arrangements are non-recourse to us in the event that an account debtor fails to pay for credit-related reasons and are not included in our indebtedness.
We may be required to satisfy financial obligations under guarantees and other commercial commitments.
From time to time, we enter into commercial arrangements such as long-term capacity purchase agreements, financial guarantees and leases to support customers’ or commercial partners’ infrastructure development. These arrangements may increase our exposure to counterparty risk, such as their inability to secure the necessary capital or financing, delays in project execution and downturns in their business, including insolvency. If we are required to satisfy our financial obligations under these commercial arrangements, our business, operating results, financial and condition may be adversely affected.
38
Merger, Acquisition, Divestiture, and Integration Risks
Acquisitions, joint ventures, and/or investments, and the failure to integrate acquired businesses, may fail to materialize their anticipated benefits and could disrupt our business, which could adversely affect our results of operation and financial condition.
We have acquired and invested in businesses, and may continue to do so, that offer products, services and technologies that we believe will help expand our product offerings and services and grow our business in response to changing technologies, customer demands and competitive pressures. Acquisitions and joint ventures include numerous risks including, but not limited to: our inability to identify suitable opportunities in a timely manner or on terms acceptable to us; failure to complete a transaction in a timely manner, or at all; inability to obtain, or delay in obtaining, regulatory approvals or IP disputes or other litigation; difficulty in obtaining financing on terms acceptable to us or at all; and failure of a transaction to advance our business strategy or other unforeseen factors. For example, in March 2025, we completed our acquisition of ZT Systems. While we believe that our acquisitions will result in certain benefits, including certain operational synergies, accretion and cost efficiencies, and drive product innovations, achieving these anticipated benefits depends on our ability to successfully integrate the acquired businesses into our business. We cannot be certain that our acquisitions can be successfully integrated with our business in a timely manner or at all, for a variety of reasons, including, but not limited to: difficulty in integrating the technology, systems, products, policies, processes or operations and integrating and retaining the employees including key personnel of the acquired business; diversion of capital and other resources, including management’s attention from our existing business; unanticipated costs or liabilities, such as increased interest expense and compliance with debt covenants or other obligations; coordinating and integrating in countries in which we have not previously operated; the potential impact of the acquisitions on our relationships with employees, vendors, suppliers and customers; our inability to effectively retain suppliers, vendors and customers of the acquired businesses; entry into geographic or business markets in which we have little or no experience; adverse changes in general economic conditions in regions in which we and the acquired companies operate; potential litigation associated with the acquisitions; difficulties in the assimilation of employees and culture; difficulties in managing the expanded operations of a larger and more complex company; and difficulties with integrating and upgrading our and the acquired companies’ financial reporting systems. If we cannot successfully integrate or are delayed in integrating newly acquired businesses, it could result in increased costs, decreases in expected revenues, diversion of management’s time and attention, negatively impact our ability to develop or sell new products and impair our ability to grow our business, which could materially adversely affect our financial conditions and operating results. Even if the businesses we acquire are successfully integrated, the benefits of such transactions may not be realized within the anticipated time frame or at all. To complete an acquisition, we may issue equity securities, which would dilute our stockholders’ ownership and could adversely affect the price of our common stock, and/or incur debt, assume contingent liabilities or have amortization expenses and write-downs of acquired assets, which could adversely affect our results of operations. From time to time, we may also seek to divest or wind down portions of our business, either acquired or otherwise. Such dispositions involve risks and uncertainties, including our ability to sell such businesses on terms acceptable to us, or at all; litigation; disruption of our ongoing business and distraction of management; failure to effectively transfer liabilities, contracts, facilities and employees to buyer; continued financial obligations and unanticipated liabilities; and closing delays. For example, purchase price consideration received from divestitures can be subject to customary post-closing adjustments, and if such adjustments are material, we may be exposed to losses, which could have a material impact on our financial position and results of operations.
Moreover, we may not adequately assess the risks of new business initiatives and subsequent events may arise that alter the risks that were initially considered. Acquisitions, joint ventures and other investments involve significant challenges and risks and could impair our ability to grow our business, develop new products or sell our products, which could have a negative impact on our results of operations. Acquisitions or joint ventures may also reduce our cash available for operation and other uses which could harm our business. For example, the majority of our ATMP services are provided by the ATMP JVs, and there is no guarantee that the JVs will be able to fulfill our long-term ATMP requirements. If we are unable to meet customer demand due to fluctuating or late supply from the ATMP JVs, it could result in lost sales and have a material adverse effect on our business. We may not realize the expected benefits from the THATIC JV’s expected future performance, including the receipt of any royalties from certain licensed intellectual property. In June 2019, the BIS added certain Chinese entities to the Entity List, including THATIC and the THATIC JV. We are complying with U.S. law pertaining to the Entity List designation.
39
We invest in both public and private companies to further our strategic objectives and to support certain key business initiatives. We invest in early-stage companies that may still be in the process of developing a strategic direction and may not yet generate revenue. Many of the equity and debt instruments that we invest in are non-marketable and illiquid at the time of our initial investment, and we are not always able to achieve a return. Our ability to realize a return on our investments in private companies typically depends on the company completing a liquidity event, such as a public offering or acquisition. Market conditions and events, particularly in periods with economic uncertainty, inflation, volatile public equity markets or unsettled global market conditions, could cause our investments in public companies to expose us to volatility in our results due to changes in market prices and/or impairments. To the extent any of the companies in which we invest in are not successful, we could recognize an impairment and/or lose all or part of our investment. Our investment portfolio is concentrated in specific sectors and adverse developments in one or any of these sectors due to regulatory changes, technology disruptions or market downturns could negatively impact the performance of our investment portfolio.
Any impairment of our tangible, definite-lived intangible or indefinite-lived intangible assets, including goodwill, may adversely impact our financial position and results of operations.
We account for certain acquisitions using the acquisition method of accounting under the provisions of ASC 805, Business Combinations, with AMD as the accounting acquirer. We record assets acquired, including identifiable intangible assets, and liabilities assumed, at their respective fair values at the acquisition date. Any excess of the purchase price over the net fair value of such assets and liabilities will be recorded as goodwill. These acquisitions resulted in recognition of significant goodwill and other intangible assets on our Consolidated Balance Sheets. Goodwill and indefinite-lived intangible assets are tested for impairment at least annually. All tangible and intangible assets including goodwill, are subject to impairment testing when events or changes in circumstances suggest that their carrying amounts may not be recoverable. Impairment testing particularly for goodwill requires significant judgment and assumptions in determining fair value. We monitor for any events or changes in circumstances that may be indicators of impairment, including but not limited to: significant adverse changes in business climate or operating results; changes in management’s business strategy; an inability to successfully introduce new products in the marketplace; an inability to successfully achieve internal forecasts; significant declines in our stock price; significant negative industry; or macroeconomic trends. A deterioration in the long-term economic outlook or expected future cash flows of our business could result in impairment charges, which may have a material adverse impact on our financial position and results of operations.
40
General Risks
Our worldwide operations are subject to political, legal and economic risks and natural disasters, which could have a material adverse effect on us.
We maintain operations around the world, including in the United States, Canada, Europe, Australia, Latin America and Asia. We rely on third-party wafer foundries in the United States, Europe and Asia. Nearly all product assembly and final testing of our products is performed at third-party operated manufacturing facilities, in China, Malaysia and Taiwan. Our shipping services are provided by third-party subcontractors. We also have international sales operations. International sales, as a percent of net revenue, were 67% for the year ended December 27, 2025. We expect that international sales will continue to be a significant portion of total sales in the foreseeable future. The political, legal and economic risks associated with our worldwide operations include, without limitation: expropriation; changes in a specific country’s or region’s political or economic conditions; changes in tax laws, trade protection measures and import or export licensing requirements and restrictions; imposition of new and increased tariffs; worsening trade relationship between the United States and China (or other countries); volatile global economic conditions, including downturns or recessions in which some competitors may become more aggressive in their pricing practices; difficulties in protecting our intellectual property; difficulties in managing staffing and exposure to different employment practices and labor laws; changes in immigration law and regulations; changes in foreign currency exchange rates; restrictions on transfers of funds and other assets of our subsidiaries between jurisdictions; changes in freight rates; changes to macroeconomic conditions, including interest rates, inflation and recession; transportation restrictions or disruptions; loss or modification of exemptions for taxes and tariffs; and compliance with U.S. laws and regulations related to international operations, including export control and economic sanctions laws and regulations and the Foreign Corrupt Practices Act. Changes in the public perception of the U.S. government in the regions where we operate or plan to operate could also negatively impact our business and results of operations. Geopolitical tensions, such as the Ukraine-Russia, Israel-Hamas and Venezuela conflicts, could escalate and expand, which in turn could have negative impacts on the global economy and financial markets. Also, in addition to restrictions imposed by the United States or China on exports or imports from one another, geopolitical changes between China and Taiwan could disrupt the operations of our Taiwan-based third-party wafer foundries, manufacturing facilities and subcontractors, and materially adversely affect delivery of products and our business, financial condition and/or operating results.
In addition, our worldwide operations (or those of our business partners) could be subject to natural disasters and climate change such as earthquakes, tsunamis, flooding, tropical cyclones, droughts, fires, sea-level rise, extreme heat and volcanic eruptions that disrupt our operations, or those of our manufacturers, vendors or customers. For example, our California operations are located near major earthquake fault lines. In April 2024, Taiwan experienced an earthquake where our third-party wafer foundries are located. We also have operations and employees in regions that have experienced extreme weather such as prolonged heat waves, wildfires and freezing. Extreme weather events and natural disasters can also disrupt the ability of our suppliers to deliver expected manufacturing parts and/or services for periods of time. In addition, certain natural disasters, including drought, wildfires, storms, sea-level rise and flooding, could disrupt the availability of water necessary for the operations of our business or the business of our suppliers or customers. Global climate change also may result in chronic changes that result in certain natural disasters occurring more frequently or with greater intensity, which could disrupt our operations, or the operations of our third parties. There may be conflict or uncertainty in the countries in which we, our customers and suppliers operate, including public health issues, epidemics and pandemics, safety issues, natural disasters, fire, disruptions of service from utilities, nuclear power plant accidents or general economic or political factors. Global health outbreaks, such as COVID-19, have and may adversely affect our employees and disrupt our business operations, as well as those of our customers and suppliers. Public health measures by government authorities may cause us to incur additional costs, limit our operations, modify our business practices, diminish employee productivity or disrupt our supply chain, which may have a material adverse effect on our business.
The U.S. has been and may continue to be involved in armed conflicts that could have a further impact on our sales and our supply chain. The consequences of armed conflict, political instability or civil or military unrest are unpredictable, and we may not be able to foresee events that could have a material adverse effect on us. Terrorist attacks or other hostile acts may negatively affect our operations, or adversely affect demand for our products, and such attacks or related armed conflicts may impact our physical facilities or those of our suppliers or customers. Furthermore, these attacks or hostile acts may make travel and the transportation of our products more difficult and more expensive, which could materially adversely affect us. Any of these events could cause consumer spending to decrease or result in increased volatility in the U.S. economy and worldwide financial markets.
41
Any of the above risks, should they occur, could result in increased costs, shipment delays, general business interruptions, the inability to obtain, or delays in obtaining export licenses for certain technology, penalties or a loss of export privileges. Additionally, stringent licensing restrictions may make our products less attractive to international customers, tariffs and other barriers and restrictions, longer payment cycles, increased taxes, restrictions on the repatriation of funds and the burdens of complying with a variety of foreign laws are all factors that could have a material adverse effect on our business.
We may incur future impairments of our technology license purchases.
We license certain third-party technologies and tools for the design and production of our products. We report the value of those licenses as other non-current assets on our Consolidated Balance Sheets and we periodically evaluate the carrying value of those licenses based on their future economic benefit to us. Factors such as the life of the assets, changes in competing technologies, and changes to the business strategy may represent an indicator of impairment. The occurrence of any of these events may require us to record future technology license impairment charges.
Our inability to continue to attract and retain key employees may hinder our business.
Our success depends upon the continued service of numerous qualified engineering, marketing, sales and executive employees. The market for qualified and skilled executives and employees in the technology industry, especially in the areas of AI and machine learning, is highly competitive. Our competitors have targeted individuals in our organization that have desired skills and experience. If we are unable to continue to attract, develop and retain our leadership team and our qualified employees necessary for our business, the progress of our product development programs could be hindered, and we could be materially adversely affected. We use share-based incentive awards to help attract, retain and motivate our executives and qualified employees. If the value of such stock awards does not appreciate as measured by the performance of the price of our common stock, or if our share-based compensation otherwise ceases to be viewed as a valuable benefit, our ability to attract, retain and motivate our executives and employees could be affected, which could harm our results of operations. If the value of our stock awards increases substantially, this could potentially create great personal wealth for our executives and key talent and affect our ability to retain our employees. Our ability to attract and retain qualified employees could also be impacted by changes in immigration law and regulations, or interpretation of new or existing laws. United States immigration controls could affect the employment status of key technical and professional employees, as well as our ability to hire talent globally. Any future restructuring plans may also adversely impact our ability to attract and retain key employees.
Our stock price is subject to volatility.
Our stock price has experienced price and volume fluctuations and could be subject to wide fluctuations in the future. The trading price of our stock may fluctuate widely due to various factors including: actual or anticipated fluctuations in our financial conditions and operating results; failure to meet expectations related to future growth; changes in financial estimates by us or financial estimates and ratings by securities analysts; changes in our capital structure, including issuance of additional debt or equity to the public; competitive landscape; news regarding our products or products of our competitors or other actions taken by competitors; broad market industry and competitor-related fluctuations; and general economic, political and market conditions, including imposition of new or increased tariffs and other trade restrictions, interest rate changes and inflation. Stock price fluctuations could impact the value of our equity compensation, which could affect our ability to recruit and retain employees. In addition, volatility in our stock price could adversely affect our business and financing opportunities.
We have an approved stock repurchase program that authorizes repurchases of up to $14 billion of our common stock (Repurchase Program). As of December 27, 2025, $9.4 billion remained available for future stock repurchases under the Repurchase Program. The Repurchase Program does not obligate us to acquire any common stock, has no termination date and may be suspended or discontinued at any time. Our stock repurchases could affect the trading price of our stock, the volatility of our stock price, reduce our cash reserves, and may be suspended or discontinued at any time, which may result in a decrease in our stock price.
ITEM 1B. UNRESOLVED STAFF COMMENTS
None.
42
ITEM 1C. CYBERSECURITY
Cybersecurity Risk Management and Strategy
We have developed and implemented a cybersecurity risk management program intended to protect the confidentiality, integrity, and availability of our critical systems and information.
We design and assess our program based on the National Institute of Standards and Technology Cybersecurity Framework (NIST CSF), AI Risk Management Framework (AI RMF) and other industry practices and standards. This does not mean that we meet any particular technical standards, specifications, or requirements, but only that we use the NIST CSF, AI RMF, and other industry practices and standards as guides to help us identify, assess, and manage cybersecurity risks relevant to our business.
Information about cybersecurity risks and our risk management processes is collected, analyzed and considered as part of our overall enterprise risk management program.
Key components of our cybersecurity risk management program include:
•periodic risk assessments designed to help identify cybersecurity risks to our critical systems, information, services, and our broader enterprise IT environment;
•a security team principally responsible for managing our cybersecurity risk assessment processes, our security controls, and our detection and response to cybersecurity incidents;
•the use of external service providers, where appropriate, to assess, evaluate, test or otherwise assist with aspects of our security controls and processes;
•active testing including penetration tests, attack simulations and tabletop exercises;
•cybersecurity awareness training of our employees, incident response personnel and senior management;
•a cybersecurity incident response plan that includes procedures for responding to cybersecurity incidents; and
•a third-party cyber risk management process for vendors including, among other things, a security assessment and contracting program for vendors based on their risk profile.
At this time, we have not identified risks from known cybersecurity threats, including as a result of any prior cybersecurity incidents, that have materially affected us, including our operations, business strategy, results of operations, or financial condition. We face certain ongoing risks from cybersecurity threats that, if realized, are reasonably likely to materially affect us, including our operations, business strategy, results of operations, or financial condition. See “Risk Factors - IT outages, data loss, data breaches and cyberattacks could disrupt operations and compromise our intellectual property or other sensitive information, be costly to remediate or cause significant damage to our business, reputation, financial condition and results of operations.”
Cybersecurity Governance
Our Board considers cybersecurity risk as part of its risk oversight function and has delegated to the Audit and Finance Committee (Committee) oversight of cybersecurity and other information technology risks. The Committee oversees management’s implementation of our cybersecurity risk management program.
The Committee receives quarterly reports from management on our cybersecurity risks. In addition, management updates the Committee, as necessary, regarding any significant cybersecurity incidents.
The Committee reports to the full Board regarding its activities, including those related to cybersecurity. The full Board also receives a briefing from management on our cyber risk management program at least annually. Board members receive presentations on cybersecurity matters from our Chief Information Security Officer (CISO), information security team or external experts as part of the Board’s continuing education on topics that impact public companies. The CISO reports to the Chief Information Officer (CIO).
Our CISO has primary responsibility for our overall cybersecurity risk management program, and directly supervises both our internal cybersecurity personnel and any retained external cybersecurity consultants. Our CISO has over 20 years of experience in cybersecurity including security operations, security architecture, identity and access management, cloud security, vulnerability management, and application/product security, policy, and compliance.
43
ITEM 2. PROPERTIES
As of December 27, 2025, we have approximately 6.8 million square feet of space for research and development, engineering, administrative and warehouse use throughout the world. These facilities include approximately 5.4 million square feet of leased space and approximately 1.4 million square feet of owned space. Our headquarters are located in Santa Clara, California, and we have significant operations in Austin, Texas; San Jose, California; Shanghai, China; Markham, Ontario, Canada; Longmont, Colorado; Dublin, Ireland; Singapore; and Bengaluru and Hyderabad, India. We also have a number of regional sales offices located in commercial centers near customers, principally in the United States, Europe, Asia and Latin America.
We currently do not anticipate difficulty in either retaining occupancy of any of our facilities through lease renewals prior to expiration or through month-to-month occupancy or replacing them with equivalent facilities. We believe that our existing facilities are suitable and adequate for our present purposes and that the productive capacity of such facilities is substantially being utilized or we have plans to utilize such capacity.
ITEM 3. LEGAL PROCEEDINGS
For a discussion of our legal proceedings, refer to Note 12 – Commitments and Contingencies of the Notes to Consolidated Financial Statements (Part II, Item 8 of this Form 10-K).
ITEM 4. MINE SAFETY DISCLOSURES
Not Applicable.
44
PART II
ITEM 5. MARKET FOR REGISTRANT’S COMMON EQUITY, RELATED STOCKHOLDER MATTERS AND ISSUER PURCHASES OF EQUITY SECURITIES
Our common stock is listed on The NASDAQ Global Select Market (NASDAQ) under the symbol “AMD”. On January 30, 2026, there were 5,094 registered holders of our common stock, and the closing price of our common stock was $236.73 per share as reported on NASDAQ.
Issuer Purchases of Equity Securities
We have an approved stock repurchase program authorizing repurchases of up to $14 billion of our common stock (Repurchase Program). We expect to fund repurchases through cash generated from operations. Our Repurchase Program does not obligate us to acquire any common stock, has no termination date and may be suspended or discontinued at any time. No shares were repurchased during the three months ended December 27, 2025. As of December 27, 2025, $9.4 billion remained available for future stock repurchases under the Repurchase Program.
Equity Award Share Withholding
Shares of common stock withheld as payment of withholding taxes in connection with the vesting or exercise of equity awards are also treated as common stock repurchases. Those withheld shares of common stock are not considered common stock repurchases under an authorized common stock repurchase plan. During fiscal year 2025, we withheld approximately 3.8 million shares at an average price of $164.86 per share as payment of withholding taxes in connection with the vesting and exercise of equity awards.
For information about our equity compensation plans, see Part III, Item 11, below.
45
Performance Graph
Comparison of Five-Year Cumulative Total Returns
Advanced Micro Devices, S&P 500 Index and S&P 500 Semiconductors Index
The following graph shows a five-year comparison of cumulative total return on our common stock, the S&P 500 Index and the S&P 500 Semiconductors Index from December 26, 2020 through December 27, 2025, assuming reinvestment of dividends. The past performance of our common stock is no indication of future performance.
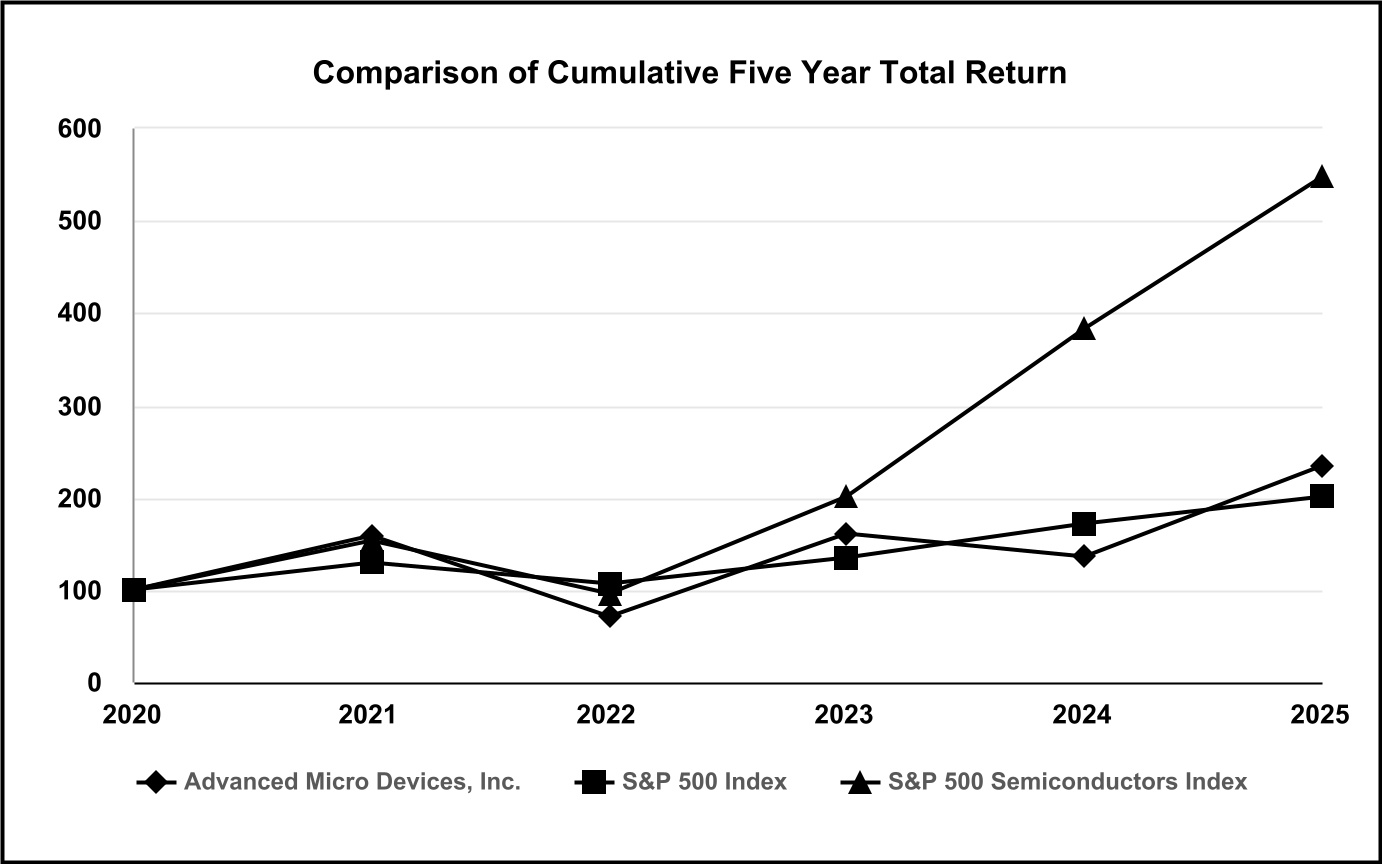
| Base Period | Years Ended | |||||||||||||||||||
| Company / Index | 12/26/2020 | 12/25/2021 | 12/31/2022 | 12/30/2023 | 12/28/2024 | 12/27/2025 | ||||||||||||||
| Advanced Micro Devices, Inc. | $100 | $ | 159 | $ | 71 | $ | 161 | $ | 136 | $ | 234 | |||||||||
| S&P 500 Index | $100 | $ | 129 | $ | 107 | $ | 135 | $ | 171 | $ | 201 | |||||||||
| S&P 500 Semiconductors Index | $100 | $ | 153 | $ | 96 | $ | 201 | $ | 383 | $ | 547 | |||||||||
ITEM 6. [RESERVED]
46
ITEM 7. MANAGEMENT’S DISCUSSION AND ANALYSIS OF FINANCIAL CONDITION AND RESULTS OF OPERATIONS
The following discussion should be read in conjunction with the Consolidated Financial Statements as of December 27, 2025 and December 28, 2024 and for each of the three years in the period ended December 27, 2025 and related notes, which are included in this Annual Report on Form 10-K as well as with the other sections of this Annual Report on Form 10-K, “Part II, Item 8: Financial Statements and Supplementary Data.”
Introduction
In this section, we will describe the general financial condition and the results of operations of Advanced Micro Devices, Inc. and its wholly-owned subsidiaries (collectively, “us,” “our” or “AMD”), including a discussion of our results of operations for 2025 compared to 2024, an analysis of changes in our financial condition and a discussion of our off-balance sheet arrangements. Discussions of 2023 items and year-to-year comparisons between 2024 and 2023 that are not included in this Form 10-K can be found in “Management’s Discussion and Analysis of Financial Condition and Results of Operations” in Part II, Item 7 of our Annual Report on Form 10-K for the fiscal year ended December 28, 2024.
Beginning in the first quarter of fiscal year 2025, we combined the Client and Gaming segments into one reportable segment to align with how we manage our business. All prior period segment data were retrospectively adjusted.
Overview
In 2025, we delivered strong annual revenue growth with net revenue increasing 34% to $34.6 billion, compared to $25.8 billion in 2024. This growth was driven by the performance of our Data Center and Client and Gaming segments. Data Center net revenue of $16.6 billion increased by 32% compared to $12.6 billion in 2024, primarily driven by strong demand for our 5th generation AMD EPYC™ processors and AMD Instinct™ MI350 Series GPUs. Client and Gaming segment net revenue of $14.6 billion in 2025 increased by 51% compared to $9.6 billion in 2024, primarily driven by strong demand for our AMD Ryzen™ processors, semi-custom game consoles SoCs and Radeon™ gaming GPUs. The increase in annual net revenue was partially offset by a decrease in net revenue in our Embedded segment. Embedded net revenue of $3.5 billion decreased by 3% compared to net revenue of $3.6 billion in 2024, as certain end market demand remained mixed.
Gross margin of 50% increased by 1% compared to 49% in 2024, primarily due to product mix partially offset by approximately $440 million of net inventory and related charges associated with the U.S. government export control on AMD Instinct™ MI308 Data Center GPU products.
Cash, cash equivalents and short-term investments as of December 27, 2025 were $10.6 billion, compared to $5.1 billion at the end of 2024. Our aggregate principal amount of total debt as of December 27, 2025 was $3.3 billion, compared to $1.8 billion as of December 28, 2024.
In 2025, we returned a total of $1.3 billion to shareholders through the repurchase of 12.4 million shares of common stock under our stock repurchase program. As of December 27, 2025, $9.4 billion remained available for future stock repurchases under this program. The stock repurchase program does not obligate us to acquire any common stock, has no termination date and may be suspended or discontinued at any time.
During 2025, we launched multiple leadership products and made significant progress executing our AI strategy. A priority in 2025 was accelerating growth in the Data Center segment. Demand for our data center AI GPU products was strong as large hyperscale customers, OEMs and ODMs deployed our AMD Instinct MI350X Series GPUs. We advanced our AMD AI GPU roadmap to deliver an annual cadence of leadership for AMD Instinct solutions, beginning with the AMD Instinct MI350 Series GPUs in 2025. Beyond GPUs, we launched the 5th Gen AMD EPYC family of server processors in 2025, which deliver leadership performance and capabilities for a wide range of data center workloads, including AI. We also expanded the data center portfolio with new networking solutions, including the AMD Pensando™ “Pollara” 400 AI NICs and “Vulcano” AI NICs, which deliver high-speed connectivity across GPU clusters providing high-performance, AI-ready, flexible solutions for scale-out networking. In addition, we previewed our Helios AI rack-scale platform solution that incorporates all of our data center products (CPUs, GPUs and Networking) to address the growing AI compute requirements.
47
Across Client and Gaming, we continued to strengthen our leadership with expanding enterprise adoption and a growing portfolio of AMD Ryzen processors. For gamers, creators and developers, we brought to market AMD Radeon 9000 Series GPUs and Radeon AI PRO 9700 GPUs based on the AMD RDNA 4 graphics architecture to market along new high-performance Ryzen Threadripper™ 9000 Series processors. Our x86 Embedded portfolio continued to expand in 2025 with the introduction of three new AMD EPYC embedded processor series: AMD EPYC Embedded 9005 Series, EPYC Embedded 4005 Series and EPYC Embedded 2005 Series.
We also made strategic investments through acquisitions to further advance our software capabilities including compiler and AI expertise in machine learning, inference and performance optimization, and enable highly optimized solutions across the stack; to scale our ability to support and develop a variety of photonics and co-packaged optics solutions across next-gen AI systems; and to bring deep expertise in high-speed inference and reasoning-based AI technologies for large-scale deployments, reinforcing our enterprise AI software stack.
To execute our AI strategy, we brought in multiple AI teams across AMD to drive development of a comprehensive software ecosystem spanning our full product portfolio. We delivered key optimizations and expanded framework and library support in the latest version of AMD ROCm™ software, improving performance for generative AI workloads and simplifying the developer experience across training and inference.
In March 2025, we completed the acquisition of ZT Systems for $3.2 billion in cash and 8.3 million shares of our common stock. We retained select intellectual property and employees associated with the design operations (ZT Design Business), and in October 2025, we sold the ZT data center infrastructure manufacturing business (ZT Manufacturing Business) to Sanmina Corporation (Sanmina) for $2.4 billion in cash, subject to certain purchase price adjustments, and 1.2 million shares of Sanmina common stock. We are eligible to receive additional contingent cash consideration of up to $450 million from Sanmina to the extent certain conditions are met. Sanmina will also be our preferred partner for manufacturing capabilities in building complex AI solutions. Following the close of the sale of the ZT Manufacturing Business to Sanmina, we retained certain intellectual property and former employees of ZT Systems (ZT Design Business) and settled the contingent consideration liability with the former ZT shareholders and warrant holders.
In October 2025, we entered into a product purchase agreement with OpenAI OpCo, LLC, (OpenAI) to deploy 6 gigawatts of AMD GPUs, with the deployment of the first gigawatt of capacity powered by our AMD Instinct MI450 series products. Concurrent with the agreement, we issued to OpenAI a warrant to purchase up to an aggregate of 160 million shares of AMD’s common stock at an exercise price of $0.01 per share. The warrant shares will vest in tranches based on certain AMD Instinct GPU purchase milestones by OpenAI, or its affiliates, or indirectly through third parties, and achievement of specified AMD stock price targets and stock performance. Each vested tranche is further subject to the fulfillment of certain other technical and commercial conditions prior to exercise. Subject to certain conditions, the warrant is exercisable through October 5, 2030. None of the warrant shares met the vesting or exercise conditions and the warrant had no impact to our financial statements for the year ended December 27, 2025.
During the second quarter of fiscal year 2025, the Company recorded approximately $800 million of inventory and related charges on AMD Instinct MI308 Data Center GPU products due to new U.S. export restrictions on certain semiconductors to China. We applied for and were granted some licenses by the U.S. government that allow us to ship MI308 products to certain China-based customers. During the fourth quarter of fiscal year 2025, we began shipping products and reversed approximately $360 million of the inventory and related charges recorded earlier in the year. U.S. government officials have expressed an expectation that the U.S. government will receive 15% of the revenue generated from licensed MI308 sales to China; however, to date, the U.S. government has not published a regulation establishing such requirement.
We intend the discussion of our financial condition and results of operations that follows to provide information that will assist in understanding our financial statements, the changes in certain key items in those financial statements from period to period, the primary factors that resulted in those changes, and how certain accounting principles, policies and estimates affect our financial statements.
48
Critical Accounting Estimates
Our discussion and analysis of our financial condition and results of operations are based upon our Consolidated Financial Statements, which have been prepared in accordance with U.S. generally accepted accounting principles (U.S. GAAP). The preparation of our financial statements requires us to make estimates and judgments that affect the reported amounts in our Consolidated Financial Statements. We evaluate our estimates on an on-going basis, including those related to our revenue, inventories, business combinations, goodwill, long-lived and intangible assets, and income taxes. We base our estimates on historical experience and on various other assumptions that we believe to be reasonable under the circumstances, the results of which form the basis for making judgments about the carrying values of assets and liabilities. Although actual results have historically been reasonably consistent with management’s expectations, the actual results may differ from these estimates or our estimates may be affected by different assumptions or conditions.
Management believes the following critical accounting estimates are the most significant to the presentation of our financial statements and require the most difficult, subjective and complex judgments.
Revenue Allowances. Revenue contracts with our customers include variable amounts which we evaluate under ASC 606-10-32-8 through 14 in order to determine the net amount of consideration to which we are entitled and which we recognize as revenue. We determine the net amount of consideration to which we are entitled by estimating the most likely amount of consideration we expect to receive from the customer after adjustments to the contract price for rights of return and rebates to our original equipment manufacturer (OEM) and original design manufacturer (ODM) customers and rights of return, rebates and price protection on unsold merchandise to our distributor customers.
We base our determination of necessary adjustments to the contract price by reference to actual historical activity and experience, including actual historical returns, rebates and credits issued to OEM and distributor customers adjusted, as applicable, to include adjustments, if any, for known events or current economic conditions, or both.
Our estimates of necessary adjustments for distributor price incentives and price protection on unsold products held by distributors are based on actual historical incentives provided to distributor customers and known future price movements based on our internal and external market data analysis.
Our estimates of necessary adjustments for OEM price incentives utilize, in addition to known pricing agreements, actual historical rebate attainment rates and estimates of future OEM rebate program attainment based on internal and external market data analysis.
We offer incentive programs through cooperative advertising and marketing promotions. Where funds provided for such programs can be estimated, we recognize a reduction to revenue at the time the related revenue is recognized; otherwise, we recognize such reduction to revenue at the later of when: i) the related revenue transaction occurs; or ii) the program is offered. For transactions where we reimburse a customer for a portion of the customer’s cost to perform specific product advertising or marketing and promotional activities, such amounts are recognized as a reduction to revenue unless they qualify for expense recognition.
We also provide limited product return rights to certain OEMs and to most distribution customers. These return rights are generally limited to a contractual percentage of the customer’s prior quarter shipments, although, from time to time we may approve additional product returns beyond the contractual arrangements based on the applicable facts and circumstances. In order to estimate adjustments to revenue to account for these returns, including product restocking rights provided to distributor and OEM customers, we utilize relevant, trended actual historical product return rate information gathered, adjusted for actual known information or events, as applicable.
Overall, our estimates of adjustments to contract price due to variable consideration under our contracts with OEM and distributor customers, based on our assumptions and include adjustments, if any, for known events, have been materially consistent with actual results; however, these estimates are subject to management’s judgment and actual provisions could be different from our estimates and current provisions, resulting in future adjustments to our revenue and operating results.
49
Inventory Valuation. We value inventory at standard cost, adjusted to approximate the lower of actual cost or estimated net realizable value using assumptions about future demand and market conditions. Material assumptions we use to estimate necessary inventory carrying value adjustments can be unique to each product and are based on specific facts and circumstances. In determining excess or obsolescence reserves for products, we consider assumptions such as changes in business and economic conditions, other-than-temporary decreases in demand for our products, and changes in technology or customer requirements. In determining the lower of cost or net realizable value reserves, we consider assumptions such as recent historical sales activity and selling prices, as well as estimates of future selling prices. If in any period we anticipate a change in assumptions such as future demand or market conditions to be less favorable than our previous estimates, additional inventory write-downs may be required and would be reflected in cost of sales, resulting in a negative impact to our gross margin in that period. If in any period we are able to sell inventories that had been written down to a level below the ultimate realized selling price in a previous period, related revenue would be recorded with a lower or no offsetting charge to cost of sales resulting in a net benefit to our gross margin in that period.
Business Combinations. We allocate the fair value of purchase consideration for acquisitions meeting the requirement of business combinations to the tangible and intangible assets acquired and liabilities assumed based on their estimated fair values. Such valuations require management to make significant estimates and assumptions, especially with respect to assets and liabilities held for sale, intangible assets and contingent consideration. Significant estimates and inputs used in valuing acquired assets and liabilities held for sale, developed technology, and other identifiable intangible assets include, but are not limited to, expected future revenue, future changes in technology, useful lives, risk-adjusted discount rates and time and costs to recreate certain assets. Management's estimates of fair value are based upon assumptions believed to be reasonable, but which are inherently uncertain and unpredictable and, as a result, actual results may differ from estimates. Allocation of purchase consideration to identifiable assets and liabilities affects our amortization expense, as acquired finite-lived intangible assets are amortized over their useful life, whereas any indefinite-lived intangible assets, including goodwill, are not amortized.
Goodwill. Goodwill is the excess of the aggregate of the consideration transferred over the identifiable assets acquired and liabilities assumed in connection with business combinations. Our reporting units are at the operating segment level. Our goodwill is contained within three reporting units: Data Center, Client and Gaming, and Embedded. We perform our goodwill impairment analysis as of the first day of the fourth quarter of each year and, if certain events or circumstances indicate that an impairment loss may have been incurred, on a more frequent basis. The analysis may include both qualitative and quantitative factors to assess the likelihood of an impairment, which occurs when the carrying value of a reporting unit exceeds its fair value. Significant judgment is required in estimating the fair value of our reporting units to determine if the fair values of those units exceed their carrying values. We may obtain the assistance of third-party valuation specialists to help in determining the fair value of our reporting units. Changes in operating plans or adverse changes in the business or in the macroeconomic environment in the future could reduce the underlying cash flows used to estimate fair values and could result in a decline in fair value that would trigger future impairment charges of our reporting units’ goodwill. Based on our annual qualitative impairment test, we concluded that it is not more likely than not that the carrying value of each reporting unit exceeded its fair value.
Long-Lived and Intangible Assets. Long-lived and intangible assets to be held and used are reviewed for impairment if indicators of potential impairment exist and at least annually for indefinite-lived intangible assets. Impairment indicators are reviewed on a quarterly basis. Assets are grouped and evaluated for impairment at the lowest level of identifiable cash flows. When indicators of impairment exist and assets are held for use, we estimate future undiscounted cash flows attributable to the related asset groups. In the event such cash flows are not expected to be sufficient to recover the recorded value of the assets, the assets are written down to their estimated fair values based on the expected discounted future cash flows attributable to the asset group or based on appraisals.
50
Income Taxes. In determining taxable income for financial statement reporting purposes, we must make certain estimates and judgments. These estimates and judgments are applied in the calculation of certain tax liabilities and in the determination of the recoverability of deferred tax assets which arise from temporary differences between the recognition of assets and liabilities for tax and financial statement reporting purposes. We regularly assess the likelihood that we will be able to recover our deferred tax assets. Unless recovery is considered more-likely-than-not (a probability level of more than 50%), we will record a charge to income tax expense in the form of a valuation allowance for the deferred tax assets that we estimate will not ultimately be recoverable or maintain the valuation allowance recorded in prior periods. When considering all available evidence, if we determine it is more-likely-than-not we will realize our deferred tax assets, we will reverse some or all of the existing valuation allowance, which would result in a credit to income tax expense and the establishment of an asset in the period of reversal.
In determining the need to establish or maintain a valuation allowance, we consider the four sources of jurisdictional taxable income: (i) carryback of net operating losses to prior years; (ii) future reversals of existing taxable temporary differences; (iii) viable and prudent tax planning strategies; and (iv) future taxable income exclusive of reversing temporary differences and carryforwards.
Certain state and foreign valuation allowances are maintained due to a lack of sufficient sources of future taxable income.
In addition, the calculation of our tax liabilities involves addressing uncertainties in the application of complex, multi-jurisdictional tax rules and the potential for future adjustment of our uncertain tax positions by the Internal Revenue Service or other taxing authorities.
Results of Operations
Additional information on our reportable segments is contained in Note 4 – Segment Reporting of the Notes to Financial Statements (Part II, Item 8 of this Form 10-K).
Our operating results tend to vary seasonally. Historically, our net revenue has been generally higher in the second half of the year than in the first half of the year, although market conditions and product transitions could impact these trends.
51
The following table provides a summary of net revenue, cost of sales and operating expenses, and operating income (loss) by segment for 2025 and 2024:
| Year Ended | |||||||||||
| December 27, 2025 | December 28, 2024 | ||||||||||
| (In millions) | |||||||||||
| Net revenue: | |||||||||||
| Data Center | $ | 16,635 | $ | 12,579 | |||||||
Client and Gaming | |||||||||||
| Client | 10,640 | 7,054 | |||||||||
| Gaming | 3,910 | 2,595 | |||||||||
Total Client and Gaming | 14,550 | 9,649 | |||||||||
| Embedded | 3,454 | 3,557 | |||||||||
| Total net revenue | $ | 34,639 | $ | 25,785 | |||||||
Cost of sales and operating expenses: | |||||||||||
Data Center | $ | 13,032 | $ | 9,097 | |||||||
Client and Gaming | 11,695 | 8,462 | |||||||||
Embedded | 2,211 | 2,136 | |||||||||
All other | 4,007 | 4,190 | |||||||||
Total cost of sales and operating expenses | $ | 30,945 | $ | 23,885 | |||||||
| Operating income (loss): | |||||||||||
| Data Center | $ | 3,603 | $ | 3,482 | |||||||
| Client and Gaming | 2,855 | 1,187 | |||||||||
| Embedded | 1,243 | 1,421 | |||||||||
All other | (4,007) | (4,190) | |||||||||
Total operating income | $ | 3,694 | $ | 1,900 | |||||||
Data Center
Data Center net revenue of $16.6 billion in 2025 increased by 32%, compared to net revenue of $12.6 billion in 2024. The increase was primarily driven by strong demand for our AMD EPYC™ processors and AMD Instinct™ GPU accelerators.
Data Center operating income was $3.6 billion in 2025, compared to operating income of $3.5 billion in 2024. The increase in operating income was primarily due to higher revenue, partially offset by higher cost of sales, approximately $440 million of net inventory and related charges associated with the U.S. government export control on AMD Instinct™ MI308 Data Center GPU products and higher operating expenses.
Client and Gaming
Client and Gaming net revenue of $14.6 billion in 2025 increased by 51%, compared to net revenue of $9.6 billion in 2024.
Client net revenue of $10.6 billion in 2025 increased by 51%, compared to net revenue of $7.1 billion in 2024, primarily driven by a 31% increase in unit shipments of processors and a 15% increase in average selling price of processors, reflecting strong demand for AMD desktop and mobile Ryzen processors.
Gaming net revenue of $3.9 billion in 2025 increased by 51%, compared to net revenue of $2.6 billion in 2024. The increase was primarily driven by higher semi-custom revenue and strong demand of our Radeon™ gaming GPUs.
Client and Gaming operating income was $2.9 billion in 2025, compared to operating income of $1.2 billion in 2024. The increase in operating income was primarily driven by higher revenue, partially offset by higher cost of sales and operating expenses.
52
Embedded
Embedded net revenue of $3.5 billion in 2025 decreased by 3%, compared to net revenue of $3.6 billion in 2024. Net revenue decreased as certain end market demand remained mixed.
Embedded operating income was $1.2 billion in 2025, compared to operating income of $1.4 billion in 2024. The decrease in operating income was primarily driven by lower revenue.
All Other
All Other operating loss of $4.0 billion in 2025 primarily consisted of $2.3 billion of amortization of acquisition-related intangibles and $1.6 billion of stock-based compensation expense. All Other operating loss of $4.2 billion in 2024 primarily consisted of $2.4 billion of amortization of acquisition-related intangibles and $1.4 billion of stock-based compensation expense.
International Sales
International sales as a percentage of net revenue were 67% in 2025 and 66% in 2024. We expect that international sales will continue to be a significant portion of total sales in the foreseeable future. Substantially all of our sales transactions are denominated in U.S. dollars.
Comparison of Gross Margin, Expenses, Interest Expense, Other Income (expense) and Income Taxes
The following is a summary of certain Consolidated Statement of Operations data for 2025 and 2024:
| December 27, 2025 | December 28, 2024 | ||||||||||||||||
| (In millions, except for percentages) | |||||||||||||||||
| Net revenue | $ | 34,639 | $ | 25,785 | |||||||||||||
| Cost of sales | 16,456 | 12,114 | |||||||||||||||
| Amortization of acquisition-related intangibles | 1,031 | 946 | |||||||||||||||
| Gross profit | 17,152 | 12,725 | |||||||||||||||
| Gross margin | 50 | % | 49 | % | |||||||||||||
| Research and development | 8,091 | 6,456 | |||||||||||||||
| Marketing, general and administrative | 4,144 | 2,735 | |||||||||||||||
| Amortization of acquisition-related intangibles | 1,223 | 1,448 | |||||||||||||||
| Interest expense | (131) | (92) | |||||||||||||||
| Other income (expense), net | 577 | 181 | |||||||||||||||
Income tax provision (benefit) | (103) | 381 | |||||||||||||||
Income from discontinued operations, net of tax | 66 | — | |||||||||||||||
Gross Margin
Gross margin of 50% increased by 1% compared to 49% in 2024, primarily due to product mix, partially offset by approximately $440 million of net inventory and related charges associated with the U.S. government export control on AMD Instinct™ MI308 Data Center GPU products.
Expenses
Research and Development Expenses
Research and development expenses of $8.1 billion in 2025 increased by $1.6 billion, or 25%, compared to $6.5 billion in 2024. The increase was primarily due to higher employee-related costs from an increase in headcount in support of our continued focus on our AI strategy.
Marketing, General and Administrative Expenses
Marketing, general and administrative expenses of $4.1 billion in 2025 increased by $1.4 billion, or 52%, compared to $2.7 billion in 2024. The increase was primarily due to an increase in go-to-market activities to support our revenue growth.
53
Amortization of Acquisition-Related Intangibles
Amortization of acquisition-related intangibles of $2.3 billion for 2025 decreased by $140 million, or 6%, compared to $2.4 billion in 2024, primarily due to a lower balance of amortizable acquisition-related intangibles compared to the prior year.
Interest Expense
Interest expense of $131 million in 2025 increased by $39 million compared to $92 million in 2024, primarily due to the issuance of $1.5 billion in aggregate principal amount of 4.212% Notes and 4.319% Notes in March 2025.
Other Income (expense), net
Other income (expense), net is primarily comprised of interest income from short-term investments, changes in valuation of long-term investments and foreign currency transaction gains and losses.
Other income (expense), net of $577 million in 2025 increased by $396 million compared to $181 million in 2024, primarily due to higher unrealized gains from long-term investments compared to the prior year.
Income Tax Provision (Benefit)
We recorded an income tax benefit of $103 million and an income tax provision of $381 million in 2025 and 2024, respectively, representing effective tax rates of (2.5%) and 19%, respectively. The decrease in income tax provision in 2025 was primarily driven by an $853 million benefit related to the release of uncertain tax positions pertaining to the reasonable cause relief for dual consolidated losses approved by the Internal Revenue Service (IRS) in April 2025, whereas the income tax provision in 2024 included $373 million tax effect from an intercompany integration transaction.
In July 2025, the One Big Beautiful Bill Act (OBBBA) was enacted into law. For fiscal year 2025, the primary impact of the OBBBA to our tax provision was the accelerated expensing of domestic R&D activities which decreased our income eligible for FDII, reduced our deferred tax assets, and reduced our current income tax liability. Other OBBBA changes did not have a material impact on the financial statements.
Global Minimum Tax
The OECD is continuing discussions surrounding fundamental changes in allocation of profits among tax jurisdictions in which companies do business, as well as the implementation of a global minimum tax (namely the “Pillar One” and “Pillar Two” proposals). The Council of the European Union has adopted the global corporate 15% minimum tax as provided for in Pillar Two and has directed EU member states to implement legislation enacting Pillar Two. Many countries, including non-EU member states, have implemented laws based on Pillar Two proposals, with effective dates that started in 2024. Although many countries have already introduced Pillar Two legislation applicable to us effective in 2024, certain jurisdictions in which we operate have not adopted corresponding legislation to date. For 2024 and 2025, the impact to us associated with Pillar Two was immaterial.
In January 2026, the OECD released a "side-by-side" package introducing new safe harbors and providing an exemption for U.S.-based multinational companies from parts of the global minimum tax framework. We continue to evaluate the impact of proposed and enacted legislative changes to our effective tax rate and cash flows as new guidance becomes available in each country.
Discontinued Operations
Net income from discontinued operations for 2025 was $66 million, net of tax expense of $54 million. This includes the results of operations of the ZT Manufacturing Business and the change in fair value of contingent consideration liability of $121 million.
FINANCIAL CONDITION
Liquidity and Capital Resources
As of December 27, 2025, our cash, cash equivalents and short-term investments were $10.6 billion compared to $5.1 billion as of December 28, 2024.
54
Our operating, investing and financing cash flow activities for 2025 and 2024 were as follows:
| December 27, 2025 | December 28, 2024 | ||||||||||
| (In millions) | |||||||||||
| Net cash provided by (used in): | |||||||||||
| Net cash provided by operating activities of continuing operations | $ | 6,493 | $ | 3,041 | |||||||
| Net cash provided by operating activities of discontinued operations | 1,216 | — | |||||||||
| Operating activities | 7,709 | 3,041 | |||||||||
| Net cash (used in) provided by investing activities of continuing operations | (6,851) | (1,101) | |||||||||
| Net cash provided by investing activities of discontinued operations | 1,318 | — | |||||||||
| Investing activities | (5,533) | (1,101) | |||||||||
| Financing activities | (431) | (2,062) | |||||||||
Net increase (decrease) in cash, cash equivalents and restricted cash | $ | 1,745 | $ | (122) | |||||||
In March and October 2025, we paid a total of $2.0 billion in cash, net of cash acquired, and issued 9.1 million shares of our common stock in the acquisition of ZT Systems.
In October 2025, upon completion of the sale of the ZT Manufacturing Business to Sanmina Corporation (Sanmina), we received a total of $1.4 billion in cash, net of cash divested, and 1.2 million shares of Sanmina common stock valued at $154 million. We are eligible to receive additional cash consideration of up to $450 million to the extent certain conditions are met following the close of the sale through 2028 (Sanmina Earn-out).
As of December 27, 2025, our aggregate principal debt was $3.3 billion, with short-term and long-term debt obligations of $874 million and $2.3 billion, respectively.
We have $3.0 billion available under an unsecured revolving credit facility that expires on April 29, 2027. No funds were drawn from this credit facility during the year ended December 27, 2025.
We also have a commercial paper program to issue unsecured commercial paper notes up to a maximum principal amount outstanding, at any time, of $3.0 billion, with a maturity of up to 397 days from the date of issue. We had no commercial paper outstanding as of December 27, 2025.
As of December 27, 2025, we had unconditional commitments of approximately $12.2 billion, of which $8.5 billion are in fiscal year 2026. Our contractual obligations and purchase commitments relate primarily to our obligations to purchase wafers and substrates from third parties and future payments related to multi-year cloud service provider arrangements, and certain software and technology licenses. We work continually with our suppliers on the timing of payments and deliveries of purchase commitments, taking into account business conditions. We also have commitments for leases that have commenced for approximately $940 million and leases that have not yet commenced for $1.3 billion. See Note 12 – Commitments and Contingencies for contractual obligations and purchase commitments and Note 10 - Leases for lease obligations.
We believe our cash, cash equivalents, short-term investments and cash flows from operations along with our revolving credit facility and commercial paper program will be sufficient to fund operations, including capital expenditures, purchase and lease commitments, and strategic activities over the next 12 months and beyond. We believe we will be able to access the capital markets should we require additional funds. However, we cannot assure that such funds will be available on favorable terms, or at all.
Operating Activities
Our working capital cash inflows and outflows from operations consist primarily of cash collections from our customers, payments for inventory purchases and payments for employee-related expenditures.
Net cash provided by operating activities of continuing operations was $6.5 billion in 2025, primarily due to our net income of $4.3 billion in 2025, adjusted for non-cash adjustments of $4.6 billion and net cash outflows of $2.4 billion from changes in our operating assets and liabilities. The primary drivers of the changes in operating assets and liabilities included a $2.2 billion increase in inventory primarily to support the continued ramp of Data Center products in advanced process technology nodes. Net cash provided by operating activities of the ZT Manufacturing Business, classified as discontinued operations, was $1.2 billion.
55
Net cash provided by operating activities was $3.0 billion in 2024, primarily due to our net income of $1.6 billion in 2024, adjusted for non-cash adjustments of $3.5 billion and net cash outflows of $2.1 billion from changes in our operating assets and liabilities. The primary drivers of the changes in operating assets and liabilities included a $1.9 billion increase in accounts receivable driven primarily by higher revenue in the last month of 2024 compared to the last month of 2023, and a $1.5 billion increase in inventories driven primarily by a build of inventory to support the ramp of new products in advanced process nodes.
Investing Activities
Net cash used in investing activities of continuing operations was $6.9 billion in 2025, which primarily consisted of $5.5 billion of cash used for purchases of short-term investments, $1.8 billion of cash used in acquisitions, net of cash acquired and $1.0 billion for purchases of property and equipment, partially offset by $1.8 billion proceeds from maturities of short-term investments. Net cash provided by investing activities of discontinued operations in 2025 was $1.3 billion, primarily from the sale of the ZT Manufacturing Business.
Net cash used in investing activities was $1.1 billion in 2024, which primarily consisted of cash used for purchases of short-term investments of $1.5 billion, purchases of property and equipment of $636 million, and cash used in acquisitions, net of cash acquired of $548 million, partially offset by proceeds from maturities of short-term investments of $1.4 billion and sale of short-term investments of $616 million.
Financing Activities
Net cash used in financing activities of continuing operations was $431 million in 2025, which primarily consisted of $1.3 billion of common stock repurchases under the Repurchase Program and $607 million of stock repurchases for tax withholding on employee equity plans, partially offset by $1.5 billion of net cash received from issuance of debt, net of repayments, and $285 million of proceeds from the issuance of common stock under our employee equity plans. There was no net cash provided by financing activities of discontinued operations for the year ended December 27, 2025.
Net cash used in financing activities was $2.1 billion in 2024, which primarily consisted of common stock repurchases of $862 million under the Repurchase Program, repurchases to cover tax withholding on employee equity plans of $728 million, and repayment of the 2.95% Notes of $750 million, partially offset by proceeds from the issuance of common stock under our employee equity plans of $279 million.
Off-Balance Sheet Arrangements
As of December 27, 2025, we did not have any off-balance sheet arrangements that have had, or are reasonably likely to have a material current or future effect on our financial condition, results of operations, liquidity, capital expenditures, or capital resources.
56
ITEM 7A. QUANTITATIVE AND QUALITATIVE DISCLOSURE ABOUT MARKET RISK
Interest Rate Risk. Our exposure to market risk for changes in interest rates relates primarily to our investment portfolio and long-term debt. We usually invest our cash in investments with short maturities or with frequent interest reset terms. Accordingly, our interest income fluctuates with short-term market conditions. As of December 27, 2025, our investment portfolio consisted of fixed income instruments, time deposits and commercial paper. Our primary aim with our investment portfolio is to invest available cash while preserving principal and meeting liquidity needs. In accordance with our investment policy, we place investments with high credit quality issuers and limit the amount of credit exposure to any one issuer based upon the issuer's credit rating. These securities are subject to interest rate risk and will decrease in value if market interest rates increase. A hypothetical 50 basis-point (half percentage point) increase or decrease in interest rates compared to rates on December 27, 2025 would have affected the fair value of our cash equivalent and investment portfolio by approximately $25 million.
As of December 27, 2025, all of our outstanding long-term debt had fixed interest rates. Consequently, our exposure to market risk for changes in interest rates on reported interest expense and corresponding cash flows is minimal.
We will continue to monitor our exposure to interest rate risk.
Default Risk. We mitigate default risk in our investment portfolio by investing in only high credit quality securities and by constantly positioning our portfolio to respond to a significant reduction in a credit rating of any investment issuer or guarantor. Our portfolio includes investments in marketable debt securities with active secondary or resale markets to ensure portfolio liquidity. We are averse to principal loss and strive to preserve our invested funds by limiting default risk and market risk.
We actively monitor market conditions and developments specific to the securities and security classes in which we invest. We believe that we take a conservative approach to investing our funds in that we invest only in highly-rated debt securities with relatively short maturities and do not invest in securities which we believe involve a higher degree of risk. As of December 27, 2025, all of our investments in debt securities were A-rated by at least one of the rating agencies. While we believe we take prudent measures to mitigate investment-related risks, such risks cannot be fully eliminated as there are circumstances outside of our control.
Long-term Investment Risk. Our long-term investments are held in both marketable and non-marketable equity securities and other instruments. Marketable equity securities include investments in publicly traded companies. Non-marketable equity securities and other instruments include investments in privately held companies, which are often in a start-up or early development stage and are inherently risky. The technologies of these privately held companies are under research or development, typically in the early stages and may never materialize, and may result in a loss of our investment in these companies. As of December 27, 2025 and December 31, 2024, the carrying value of our investments in publicly traded companies was $198 million and $0, respectively, and the carrying value of our non-marketable equity securities and other instruments was $1.3 billion and $468 million, respectively. These securities are subject to a wide variety of market-related risks that could substantially reduce or increase the fair value of our holdings. We regularly review our non-marketable equity securities and other instruments for potential impairment.
Foreign Exchange Risk. As a result of our foreign operations, we incur costs and we carry assets and liabilities that are denominated in foreign currencies, while sales of products are primarily denominated in U.S. dollars. We maintain a foreign currency hedging strategy which uses derivative financial instruments to mitigate the risks associated with changes in foreign currency exchange rates. This strategy takes into consideration all of our exposures. We do not use derivative financial instruments for trading or speculative purposes.
As of December 27, 2025 and December 28, 2024, our portfolio of foreign currency forward contracts had an aggregate notional amount of $3.4 billion and $2.8 billion, respectively. All forward contracts mature within 24 months. Our foreign currency forward contracts cover a range of currencies tied to our global operations, including but not limited to the Indian Rupee, Canadian Dollar and Chinese Renminbi. As of December 27, 2025 and December 28, 2024, the estimated net fair‑value position of these forwards was a $12 million gain and $66 million loss, respectively.
57
ITEM 8. FINANCIAL STATEMENTS AND SUPPLEMENTARY DATA
Advanced Micro Devices, Inc.
Consolidated Statements of Operations
| Year Ended | |||||||||||||||||
| December 27, 2025 | December 28, 2024 | December 30, 2023 | |||||||||||||||
| (In millions, except per share amounts) | |||||||||||||||||
| Net revenue | $ | $ | $ | ||||||||||||||
| Cost of sales | |||||||||||||||||
| Amortization of acquisition-related intangibles | |||||||||||||||||
| Total cost of sales | |||||||||||||||||
| Gross profit | |||||||||||||||||
| Research and development | |||||||||||||||||
| Marketing, general and administrative | |||||||||||||||||
| Amortization of acquisition-related intangibles | |||||||||||||||||
| Restructuring charges | |||||||||||||||||
| Total operating expenses | |||||||||||||||||
| Operating income | |||||||||||||||||
| Interest expense | ( | ( | ( | ||||||||||||||
| Other income (expense), net | |||||||||||||||||
| Income from continuing operations before income taxes and equity income | |||||||||||||||||
| Income tax provision (benefit) | ( | ( | |||||||||||||||
| Equity income in investee | |||||||||||||||||
| Income from continuing operations, net of tax | |||||||||||||||||
| Income from discontinued operations, net of tax | |||||||||||||||||
| Net income | $ | $ | $ | ||||||||||||||
| Earnings per share | |||||||||||||||||
| Earnings from continuing operations - basic | $ | $ | $ | ||||||||||||||
| Earnings from discontinued operations - basic | |||||||||||||||||
| Basic earnings per share | $ | $ | $ | ||||||||||||||
| Earnings from continuing operations - diluted | $ | $ | $ | ||||||||||||||
| Earnings from discontinued operations - diluted | |||||||||||||||||
| Diluted earnings per share | $ | $ | $ | ||||||||||||||
| Shares used in per share calculation | |||||||||||||||||
| Basic | |||||||||||||||||
| Diluted | |||||||||||||||||
See accompanying notes to the Consolidated Financial Statements.
58
Advanced Micro Devices, Inc.
Consolidated Statements of Comprehensive Income
| Year Ended | |||||||||||||||||
| December 27, 2025 | December 28, 2024 | December 30, 2023 | |||||||||||||||
| (In millions) | |||||||||||||||||
| Net income | $ | $ | $ | ||||||||||||||
Other comprehensive income (loss), net of tax | |||||||||||||||||
| Net change in unrealized gains (losses) on cash flow hedges | ( | ||||||||||||||||
| Total comprehensive income | $ | $ | $ | ||||||||||||||
See accompanying notes to the Consolidated Financial Statements.
59
Advanced Micro Devices, Inc.
Consolidated Balance Sheets
| December 27, 2025 | December 28, 2024 | ||||||||||
| (In millions, except par value amounts) | |||||||||||
| ASSETS | |||||||||||
| Current assets: | |||||||||||
| Cash and cash equivalents | $ | $ | |||||||||
| Short-term investments | |||||||||||
| Accounts receivable, net | |||||||||||
| Inventories | |||||||||||
| Prepaid expenses and other current assets | |||||||||||
| Total current assets | |||||||||||
| Property and equipment, net | |||||||||||
| Goodwill | |||||||||||
| Acquisition-related intangibles, net | |||||||||||
| Deferred tax assets, net | |||||||||||
| Other non-current assets | |||||||||||
| Total assets | $ | $ | |||||||||
| LIABILITIES AND STOCKHOLDERS’ EQUITY | |||||||||||
| Current liabilities: | |||||||||||
| Accounts payable | $ | $ | |||||||||
| Accrued liabilities | |||||||||||
| Current portion of long-term debt, net | |||||||||||
| Other current liabilities | |||||||||||
| Total current liabilities | |||||||||||
| Long-term debt, net of current portion | |||||||||||
| Long-term operating lease liabilities | |||||||||||
| Deferred tax liabilities | |||||||||||
| Other long-term liabilities | |||||||||||
Commitments and contingencies (see Note 12) | |||||||||||
| Stockholders’ equity: | |||||||||||
| Capital stock: | |||||||||||
Common stock, par value $ | |||||||||||
| Additional paid-in capital | |||||||||||
Treasury stock, at cost (shares held: | ( | ( | |||||||||
| Retained earnings | |||||||||||
| Accumulated other comprehensive loss | ( | ( | |||||||||
| Total stockholders’ equity | |||||||||||
| Total liabilities and stockholders’ equity | $ | $ | |||||||||
See accompanying notes to the Consolidated Financial Statements.
60
Advanced Micro Devices, Inc.
Consolidated Statements of Stockholders’ Equity
| Year Ended | |||||||||||||||||
| December 27, 2025 | December 28, 2024 | December 30, 2023 | |||||||||||||||
| (In millions) | |||||||||||||||||
| Capital stock | |||||||||||||||||
| Common stock | |||||||||||||||||
| Balance, beginning of period | $ | $ | $ | ||||||||||||||
| Common stock issued under employee equity plans | |||||||||||||||||
| Balance, end of period | $ | $ | $ | ||||||||||||||
| Additional paid-in capital | |||||||||||||||||
| Balance, beginning of period | $ | $ | $ | ||||||||||||||
| Common stock issued under employee equity plans | |||||||||||||||||
| Stock-based compensation | |||||||||||||||||
| Issuance of common stock to settle convertible debt | |||||||||||||||||
| Reissuance of treasury stock | |||||||||||||||||
| Issuance of common stock warrants | |||||||||||||||||
| Balance, end of period | $ | $ | $ | ||||||||||||||
| Treasury stock | |||||||||||||||||
| Balance, beginning of period | $ | ( | $ | ( | $ | ( | |||||||||||
| Repurchases of common stock | ( | ( | ( | ||||||||||||||
Reissuance of treasury stock | |||||||||||||||||
| Common stock repurchases for tax withholding on employee equity plans | ( | ( | ( | ||||||||||||||
| Balance, end of period | $ | ( | $ | ( | $ | ( | |||||||||||
| Retained earnings (accumulated deficit) | |||||||||||||||||
| Balance, beginning of period | $ | $ | $ | ( | |||||||||||||
| Net income | |||||||||||||||||
| Balance, end of period | $ | $ | $ | ||||||||||||||
| Accumulated other comprehensive loss | |||||||||||||||||
| Balance, beginning of period | $ | ( | $ | ( | $ | ( | |||||||||||
| Other comprehensive income (loss) | ( | ||||||||||||||||
| Balance, end of period | $ | ( | $ | ( | $ | ( | |||||||||||
| Total stockholders' equity | $ | $ | $ | ||||||||||||||
See accompanying notes to the Consolidated Financial Statements.
61
Advanced Micro Devices, Inc.
Consolidated Statements of Cash Flows
| Year Ended | |||||||||||||||||
| December 27, 2025 | December 28, 2024 | December 30, 2023 | |||||||||||||||
| (In millions) | |||||||||||||||||
| Cash flows from operating activities: | |||||||||||||||||
| Net income | $ | $ | $ | ||||||||||||||
Income from discontinued operations, net of tax | ( | ||||||||||||||||
| Adjustments to reconcile net income to net cash provided by operating activities: | |||||||||||||||||
| Depreciation and amortization | |||||||||||||||||
| Amortization of acquisition-related intangibles | |||||||||||||||||
| Stock-based compensation | |||||||||||||||||
(Gains) losses on long-term investments, net | ( | ( | |||||||||||||||
| Deferred income taxes | ( | ( | |||||||||||||||
| Inventory loss at (recovery from) contract manufacturer | ( | ||||||||||||||||
| Other | |||||||||||||||||
| Changes in operating assets and liabilities: | |||||||||||||||||
| Accounts receivable, net | ( | ( | ( | ||||||||||||||
| Inventories | ( | ( | ( | ||||||||||||||
| Prepaid expenses and other assets | ( | ( | |||||||||||||||
| Accounts payable | ( | ||||||||||||||||
| Accrued and other liabilities | ( | ( | |||||||||||||||
Net cash provided by operating activities of continuing operations | |||||||||||||||||
| Net cash provided by operating activities of discontinued operations | |||||||||||||||||
| Net cash provided by operating activities | |||||||||||||||||
| Cash flows from investing activities: | |||||||||||||||||
| Purchases of property and equipment | ( | ( | ( | ||||||||||||||
| Purchases of short-term investments | ( | ( | ( | ||||||||||||||
| Proceeds from maturity of short-term investments | |||||||||||||||||
| Proceeds from sale of short-term investments | |||||||||||||||||
| Acquisitions, net of cash acquired | ( | ( | ( | ||||||||||||||
| Related party loan and equity method investment | ( | ||||||||||||||||
Purchases of long-term investments | ( | ( | ( | ||||||||||||||
| Other | |||||||||||||||||
Net cash used in investing activities of continuing operations | ( | ( | ( | ||||||||||||||
Proceeds from divestiture, net of cash divested | |||||||||||||||||
Purchases of property and equipment | ( | ||||||||||||||||
Net cash provided by investing activities of discontinued operations | |||||||||||||||||
| Net cash used in investing activities | ( | ( | ( | ||||||||||||||
| Cash flows from financing activities: | |||||||||||||||||
| Proceeds from debt and commercial paper issuance, net of issuance costs | |||||||||||||||||
| Repayment of debt and commercial paper | ( | ( | |||||||||||||||
| Proceeds from sales of common stock through employee equity plans | |||||||||||||||||
| Repurchases of common stock | ( | ( | ( | ||||||||||||||
| Stock repurchases for tax withholding on employee equity plans | ( | ( | ( | ||||||||||||||
Settlement of contingent consideration liability | ( | ||||||||||||||||
| Other | ( | ( | |||||||||||||||
| Net cash used in financing activities | ( | ( | ( | ||||||||||||||
| Net increase (decrease) in cash, cash equivalents and restricted cash | ( | ( | |||||||||||||||
| Cash, cash equivalents and restricted cash at beginning of year | |||||||||||||||||
| Cash, cash equivalents and restricted cash at end of year | $ | $ | $ | ||||||||||||||
62
Advanced Micro Devices, Inc. Consolidated Statements of Cash Flows | |||||||||||||||||
| Year Ended | |||||||||||||||||
| December 27, 2025 | December 28, 2024 | December 30, 2023 | |||||||||||||||
| (In millions) | |||||||||||||||||
| Supplemental cash flow information: | |||||||||||||||||
| Cash paid during the year for: | |||||||||||||||||
| Interest | $ | $ | $ | ||||||||||||||
| Income taxes, net of refund | $ | $ | $ | ||||||||||||||
| Non-cash investing and financing activities: | |||||||||||||||||
| Purchases of property and equipment, accrued but not paid | $ | $ | $ | ||||||||||||||
Reissuance of treasury stock for acquisition | $ | $ | — | $ | — | ||||||||||||
Reissuance of treasury stock to settle contingent consideration liability from acquisition | $ | $ | — | $ | — | ||||||||||||
Non-cash consideration and earn-out receivable from divestiture | $ | $ | — | $ | — | ||||||||||||
| Non-cash activities for leases: | |||||||||||||||||
| Operating lease right-of-use assets acquired by assuming related liabilities | $ | $ | $ | ||||||||||||||
| Reconciliation of cash, cash equivalents, and restricted cash | |||||||||||||||||
| Cash and cash equivalents | $ | $ | $ | ||||||||||||||
| Restricted cash included in Prepaid expenses and other current assets | |||||||||||||||||
| Total cash, cash equivalents, and restricted cash | $ | $ | $ | ||||||||||||||
See accompanying notes to the Consolidated Financial Statements.
63
Advanced Micro Devices, Inc.
Notes to Consolidated Financial Statements
NOTE 1 – The Company
NOTE 2 – Basis of Presentation and Significant Accounting Policies
Fiscal Year. The Company uses a 52- or 53-week fiscal year ending on the last Saturday in December. Fiscal years 2025, 2024 and 2023 ended on December 27, 2025, December 28, 2024 and December 30, 2023, respectively. Fiscal years 2025, 2024 and 2023 each consisted of 52 weeks.
Use of Estimates. The preparation of Consolidated Financial Statements in conformity with U.S. generally accepted accounting principles (U.S. GAAP) requires management to make estimates and assumptions that affect the reported amounts of assets and liabilities and disclosure of commitments and contingencies at the date of the financial statements and the reported amounts of revenues and expenses during the reporting periods. Actual results are likely to differ from those estimates, and such differences may be material to the financial statements. Areas where management uses subjective judgment include, but are not limited to, revenue allowances, inventory valuation, valuation of goodwill and long-lived and intangible assets, business combination accounting, and income taxes.
Revenue Recognition
Revenue is recognized when a customer obtains control of promised goods or services and is recognized in an amount that reflects the consideration which the Company expects to receive in exchange for those goods or services. Sales, value-added, and other taxes collected concurrently with the provision of goods or services are excluded from revenue. Shipping and handling costs associated with product sales are included in cost of sales. Substantially all of the Company’s revenue is derived from product sales.
Customers are generally required to pay for products and services within the Company’s standard contractual terms, which are typically net 30 to 60 days. The Company has determined that it does not have significant financing components in its contracts with customers.
Non-custom products
The Company transfers control and recognizes revenue when non-custom products are shipped to customers, which includes original equipment manufacturers (OEM) and distributors, in accordance with the shipping terms of the sale. Certain OEMs may be entitled to rights of return and rebates under OEM agreements. The Company also sells to distributors under terms allowing the majority of distributors certain rights of return and price protection on unsold merchandise held by them. The Company estimates the amount of variable consideration under OEM and distributor arrangements and, accordingly, records a provision for product returns, allowances for price protection and rebates based on actual historical experience and any known events.
64
The Company offers incentive programs to certain customers, including cooperative advertising, marketing promotions, volume-based incentives and special pricing arrangements. Where funds provided for such programs can be estimated, the Company recognizes a reduction to revenue at the time the related revenue is recognized; otherwise, the Company recognizes such reduction to revenue at the later of when: i) the related revenue transaction occurs; or ii) the program is offered. For transactions where the Company reimburses a customer for a portion of the customer’s cost to perform specific product advertising or marketing and promotional activities, such amounts are recognized as a reduction to revenue unless they qualify for expense recognition.
Constraints of variable consideration have not been material.
Custom products
Custom products, which are primarily associated with the Company’s Client and Gaming segment, are sold under non-cancellable purchases orders, for which the Company has an enforceable right to payment, and which have no alternative use to the Company at contract inception, are recognized as revenue, over the time of production of the products by the Company. The Company utilizes a cost-based input method, calculated as cost incurred plus estimated margin, to determine the amount of revenue to recognize for in-process or completed customer orders at a reporting date. The Company believes that a cost-based input method is the most appropriate manner to measure how the Company satisfies its performance obligations to customers because the effort and costs incurred best depict the Company’s satisfaction of its performance obligation.
Sales of custom products are not subject to a right of return and arrangements generally involve a single performance obligation. Generally, there are no variable consideration estimates associated with custom products.
Development and intellectual property licensing agreements
From time to time, the Company may enter into arrangements with customers that combine the provision of development services and a license to the right to use the Company’s IP. These arrangements are deemed to be single or multiple performance obligations based upon the nature of the arrangements. Revenue is recognized upon the transfer of control, over time or at a point in time, depending on the nature of the arrangements. The Company evaluates whether the licensing component is distinct. A licensing component is distinct if it is both (i) capable of being distinct and (ii) distinct in the context of the arrangement. If the license is not distinct, it is combined with the development services as a single performance obligation and recognized over time. If the license is distinct, revenue is recognized at a point in time when the customer has the ability to benefit from the license.
From time to time, the Company may enter into arrangements with customers that solely involve the sale or licensing of its patents or IP. Generally, there are no performance obligations beyond transferring the designated license to the Company’s patents or IP. Accordingly, revenue is recognized at a point in time when the customer has the ability to benefit from the license.
There are no variable consideration estimates associated with either combined development and IP arrangements or for standalone arrangements involving either the sale or licensing of IP.
Inventories
The Company values inventory at standard cost, adjusted to approximate the lower of actual cost or estimated net realizable value using assumptions about future demand and market conditions. In determining excess or obsolescence reserves for its products, the Company considers assumptions such as changes in business and economic conditions, other-than-temporary decreases in demand for its products, and changes in technology or customer requirements. In determining the lower of cost or net realizable value reserves, the Company considers assumptions such as recent historical sales activity and selling prices, as well as estimates of future selling prices. The Company fully reserves for inventories and non-cancellable purchase orders for inventory deemed obsolete. The Company performs periodic reviews of inventory items to identify excess inventories on hand by comparing on-hand balances and non-cancellable purchase orders to anticipated usage using recent historical activity as well as anticipated or forecasted demand. If estimates of customer demand diminish further or market conditions become less favorable than those projected by the Company, additional inventory carrying value adjustments may be required.
65
Business Combinations
The Company uses the acquisition method of accounting for business combinations which allocates the purchase consideration to the assets acquired and liabilities assumed from the acquiree based on their respective fair values as of the acquisition date. The excess of the fair value of purchase consideration over the fair value of these assets acquired and liabilities assumed is recorded as goodwill. When determining the fair values of assets acquired and liabilities assumed, management makes significant estimates and assumptions, especially with respect to intangible assets. Significant estimates and inputs used in valuing acquired assets and liabilities held for sale, developed technology, and other identifiable intangible assets include, but are not limited to, expected future revenue, future changes in technology, useful lives, risk-adjusted discount rates, and time and costs to recreate certain assets. Fair value estimates are based on the assumptions that management believes a market participant would use in pricing the asset or liability. These estimates are inherently uncertain and, therefore, actual results may differ from the estimates made.
Goodwill
The Company performs its goodwill impairment analysis as of the first day of the fourth quarter of each year and, if certain events or circumstances indicate that an impairment loss may have been incurred, on a more frequent basis. The analysis may include both qualitative and quantitative factors to assess the likelihood of an impairment.
Long-Lived and Intangible Assets
The Company reviews its long-lived and intangible assets for impairment if indicators of potential impairment are identified, at least quarterly. Indefinite-lived intangible assets are reviewed for impairment at least annually. Assets are grouped and evaluated for impairment at the lowest level of identifiable cash flows.
Cash Equivalents
Accounts Receivable
Accounts receivable are primarily comprised of trade receivables presented net of rebates, price protection and an allowance for credit loss. The Company manages its exposure to customer credit risk through credit limits, credit lines, ongoing monitoring procedures and credit approvals. While the Company maintains an allowance for customer credit losses, its accounts receivable write-offs have historically not been significant.
Unbilled Receivables
Unbilled receivables are recorded within Prepaid expenses and other current assets on the Company’s Consolidated Balance Sheets. Unbilled receivables primarily represent work completed on development services and on custom products under non-cancellable purchase orders that have no alternative use to the Company at contract inception, recognized as revenue but not yet invoiced to customers.
Investments
Available-for-Sale Debt Securities. Investments in marketable debt securities are available for use in current operations, including those with maturity dates beyond one year, and are classified within current assets on the Consolidated Balance Sheets. Available-for-sale debt securities are recorded at fair value, with the change in unrealized gains and losses, net of tax, reported in the Consolidated Statements of Comprehensive Income until realized. Fair value is determined based on quoted market rates when observable or utilizing data points that are observable. Securities with an amortized cost basis in excess of estimated fair value are assessed to determine what amount of the excess, if any, is caused by expected credit losses. The Company uses the first-in, first-out method as basis of the cost of securities sold.
66
Fair Value Measurements
The Company’s financial instruments are measured and recorded at fair value on a recurring basis, except for non-marketable equity investments in privately-held companies, which are generally accounted for under the measurement alternative.
Fair Value Hierarchy
The fair value framework requires the categorization of assets and liabilities into three levels based upon the assumptions (inputs) used to price the assets or liabilities. The guidance for fair value measurements requires that assets and liabilities carried at fair value be classified and disclosed in one of the following categories:
Level 1 — Quoted (unadjusted) prices in active markets for identical assets or liabilities.
Level 2 — Observable inputs other than quoted prices included in Level 1, such as quoted prices for similar assets or liabilities in active markets; quoted prices for identical or similar assets or liabilities in markets that are not active; or other inputs that are observable or can be corroborated by observable market data for substantially the full term of the asset or liability.
Property and Equipment
Property and equipment are stated at cost. Depreciation and amortization are provided on a straight-line basis over the estimated useful lives of 2 to 7 years for equipment, up to 44 years for buildings, and leasehold improvements are measured by the shorter of the remaining terms of the leases or the estimated useful economic lives of the improvements.
Leases
The Company records operating and finance leases as right-of-use (ROU) assets and lease liabilities on the Company’s Consolidated Balance Sheets. ROU assets represent the Company’s right to use an underlying asset for the lease term and lease liabilities represent the Company’s obligation to make lease payments arising from the lease. Operating and finance lease ROU assets and liabilities are initially recognized based on the present value of lease payments over the lease term. In determining the present value of lease payments, the Company uses the implicit interest rate if readily determinable. When the implicit interest rate is not readily determinable, the Company uses its incremental borrowing rate, which is based on its collateralized borrowing capabilities over a similar term of the lease payments. When using the incremental borrowing rate, the Company utilizes the consolidated group incremental borrowing rate. Lease expense for operating lease payments is recognized on a straight-line basis over the lease term. The Company has elected the accounting policy to not recognize ROU assets and lease liabilities that arise from short-term (12 months or less) leases for any class of underlying asset. Operating leases are included in other non-current assets, other current liabilities, and long-term operating lease liabilities on the Company’s Consolidated Balance Sheets. The Company’s finance leases are immaterial.
67
Foreign Currency Translation/Transactions
Marketing and Advertising Expenses
Stock-Based Compensation
The Company estimates stock-based compensation cost for stock options at the grant date based on the option’s fair value as calculated by the Black-Scholes model. For time-based restricted stock units (RSUs), fair value is based on the closing price of the Company’s common stock on the grant date. The Company estimates the grant-date fair value of RSUs that involve a market condition using the Monte Carlo simulation model. The Company estimates the grant-date fair value of stock to be issued under the Company’s Employee Stock Purchase plan (ESPP) using the Black-Scholes model. Compensation expense is recognized over the vesting period of the applicable award using the straight-line method, except for the compensation expense related to RSUs with performance or market conditions (PRSUs), which are recognized ratably for each vesting tranche from the service inception date to the end of the requisite service period. Forfeiture rates are estimated at the time of grant and revised, if necessary, in subsequent periods if actual forfeitures differ from those estimates.
Contingencies
From time to time the Company may be a defendant or plaintiff in various legal actions that arise in the normal course of business. The Company is also subject to income tax, indirect tax or other tax claims by tax agencies in jurisdictions in which it conducts business. In addition, the Company is a party to environmental matters including local, regional, state and federal government clean-up activities at or near locations where the Company currently or has in the past conducted business. The Company is required to assess the likelihood of any adverse judgments or outcomes to these matters as well as potential ranges of reasonably possible losses. A determination of the amount of reserves required for these commitments and contingencies that would be charged to earnings, if any, includes assessing the probability of adverse outcomes and estimating the amount of potential losses. The required reserves, if any, may change due to new developments in each matter or changes in circumstances such as a change in settlement strategy.
Income Taxes
The Company computes the provision for income taxes using the liability method and recognizes deferred tax assets and liabilities for temporary differences between financial statement and income tax bases of assets and liabilities, as well as for operating loss and tax credit carryforwards. The Company measures deferred tax assets and liabilities using tax rates applicable to taxable income in effect for the years in which those tax assets are expected to be realized or settled and provides a valuation allowance against deferred tax assets when it cannot conclude that it is more likely than not that some or all deferred tax assets will be realized. The assessment requires significant judgment and is performed in each of the applicable taxing jurisdictions. In addition, the Company recognizes tax benefits from uncertain tax positions only if it is more likely than not that they will be sustained, based on the technical merits of the positions, on examination by the jurisdictional tax authority. Interest and penalties related to uncertain tax positions are recorded within the Income tax provision (benefit) line in the Company’s Consolidated Statements of Operations. The Company is subject to the Global Intangible Low Taxed Income (GILTI) tax in the U.S. and recognizes deferred taxes for temporary basis differences that are expected to reverse as GILTI tax in future years.
68
Earnings Per Share
Basic Earnings Per Share (EPS) is calculated using the weighted-average number of shares outstanding during the period. Diluted EPS is calculated using the weighted-average number of shares outstanding plus the effect of potentially dilutive shares outstanding which is determined using the treasury stock method. Potentially dilutive shares are excluded from the computation of diluted EPS in periods in which their effect is anti-dilutive.
Recently Issued Accounting Standard Updates Adopted
In December 2023, the Financial Accounting Standards Board (FASB) issued Accounting Standard Update (ASU) Income Taxes - Improvement to Income Tax Disclosures (ASU 2023-09) that requires disclosure of disaggregated income taxes paid, prescribes standard categories for the components of the effective tax rate reconciliation, and modifies other income tax-related disclosures. The Company adopted ASU 2023-09 in the fourth quarter of 2025, with prospective application. See Note 17 - Income Taxes for further information.
Recently Issued Accounting Standard Updates Not Yet Adopted
In November 2024, the FASB issued ASU 2024-03 Disaggregation - Income Statement Expenses (DISE) that expanded the annual and interim disclosure of certain costs and expense categories into specified categories in the notes to the financial statements. The ASU will be effective for the Company beginning with the fiscal year 2027 and interim periods thereafter, and could be applied either prospectively or retrospectively, with early adoption permitted. The Company is currently evaluating the impact of this ASU on its financial statements.
NOTE 3 – Supplemental Financial Statement Information
Inventories | December 27, 2025 | December 28, 2024 | |||||||||
| (In millions) | |||||||||||
| Raw materials | $ | $ | |||||||||
| Work in process | |||||||||||
| Finished goods | |||||||||||
| Total inventories | $ | $ | |||||||||
Property and Equipment, net | December 27, 2025 | December 28, 2024 | |||||||||
| (In millions) | |||||||||||
Land, building and leasehold improvements | $ | $ | |||||||||
| Equipment | |||||||||||
| Construction in progress | |||||||||||
| Property and equipment, gross | |||||||||||
| Accumulated depreciation | ( | ( | |||||||||
| Total property and equipment, net | $ | $ | |||||||||
Depreciation expense for 2025, 2024 and 2023 was $521 million, $454 million and $441 million, respectively.
Accrued Liabilities | December 27, 2025 | December 28, 2024 | |||||||||
| (In millions) | |||||||||||
| Accrued marketing programs | $ | $ | |||||||||
| Accrued compensation and benefits | |||||||||||
| Customer-related liabilities | |||||||||||
| Other accrued expenses and liabilities | |||||||||||
| Total accrued liabilities | $ | $ | |||||||||
69
Revenue
Revenue allocated to remaining performance obligations that are unsatisfied or partially unsatisfied include amounts received from customers and amounts that will be invoiced and recognized as revenue in future periods for product revenue, development services, and IP licensing. As of December 27, 2025, the aggregate transaction price allocated to remaining performance obligations under contracts with an original expected duration of more than one year was $315 million, of which $201 million is expected to be recognized in the next 12 months. The revenue allocated to remaining performance obligations does not include amounts which have an original expected duration of one year or less.
Revenue recognized over time associated with custom products and development services accounted for approximately 9 %, 8 % and 25 % of the Company’s revenue in 2025, 2024 and 2023, respectively.
Cost of Sales
NOTE 4 – Segment Reporting
Management, including the Chief Operating Decision Maker (CODM), who is the Company’s Chief Executive Officer, reviews and assesses operating performance using segment net revenue, consolidated cost of sales and operating expenses and operating income (loss). These performance measures include the allocation of expenses to the reportable segments based on management’s judgment. The CODM is regularly provided segment operating income to assess relative segment performance. In the first quarter of fiscal year 2025, the Company changed its segment structure, combining the Client and Gaming segments into one reportable segment to align with how the Company manages its business. All prior period segment data were retrospectively adjusted.
The Company’s three reportable segments are:
•the Data Center segment, which primarily includes Artificial Intelligence (AI) accelerators, microprocessors (CPUs) for servers, graphics processing units (GPUs), accelerated processing units (APUs), data processing units (DPUs), AI Network Interface Cards (AI NICs), Field Programmable Gate Arrays (FPGAs) and adaptive System-on-Chip (SoC) products for data centers;
•the Client and Gaming segment, which primarily includes CPUs, APUs, chipsets for desktops and notebooks, discrete GPUs, and semi-custom SoC products and development services; and
•the Embedded segment, which primarily includes embedded CPUs, APUs, FPGAs, System on Modules (SOMs), and adaptive SoC products.
From time to time, the Company may also sell or license portions of its IP portfolio.
In addition to these reportable segments, the Company has an All Other category, which is not a reportable segment. This category primarily includes certain expenses and credits that are not allocated to any of the reportable segments because the CODM does not consider these expenses and credits in evaluating the performance of the reportable segments. This category primarily includes amortization of acquisition-related intangibles, employee stock-based compensation, acquisition-related and other costs, restructuring charges, inventory loss at (recovery from) contract manufacturer and licensing gain. Acquisition-related and other costs primarily include transaction costs, certain compensation charges, contract termination costs and workforce rebalancing charges.
The following table provides a summary of net revenue, cost of sales and operating expenses, and operating income (loss) by segment. Segment cost of sales and operating expenses primarily include materials, external manufacturing, labor and marketing and advertising costs, and exclude expenses and credits that are recorded within the All Other category. Each of the Client and Gaming businesses do not qualify as a reportable operating segment, however, the Company continues to separately disclose revenue for each business.
70
| Year Ended | |||||||||||||||||
| December 27, 2025 | December 28, 2024 | December 30, 2023 | |||||||||||||||
| (In millions) | |||||||||||||||||
| Net revenue: | |||||||||||||||||
| Data Center | $ | $ | $ | ||||||||||||||
| Client and Gaming | |||||||||||||||||
| Client | |||||||||||||||||
| Gaming | |||||||||||||||||
| Total Client and Gaming | |||||||||||||||||
| Embedded | |||||||||||||||||
| Total net revenue | $ | $ | $ | ||||||||||||||
Cost of sales and operating expenses: | |||||||||||||||||
Data Center | $ | $ | $ | ||||||||||||||
Client and Gaming | |||||||||||||||||
Embedded | |||||||||||||||||
All Other | |||||||||||||||||
Total cost of sales and operating expenses | $ | $ | $ | ||||||||||||||
| Operating income (loss): | |||||||||||||||||
| Data Center | $ | $ | $ | ||||||||||||||
Client and Gaming | |||||||||||||||||
| Embedded | |||||||||||||||||
All Other | ( | ( | ( | ||||||||||||||
Total operating income | $ | $ | $ | ||||||||||||||
The following table provides items included in All Other category:
| Year Ended | |||||||||||||||||
| December 27, 2025 | December 28, 2024 | December 30, 2023 | |||||||||||||||
| (In millions) | |||||||||||||||||
| Operating loss: | |||||||||||||||||
| Amortization of acquisition-related intangibles | $ | $ | $ | ||||||||||||||
| Stock-based compensation expense | |||||||||||||||||
| Acquisition-related and other costs | |||||||||||||||||
| Restructuring charges | |||||||||||||||||
| Inventory loss at (recovery from) contract manufacturer | ( | ||||||||||||||||
| Licensing gain | ( | ( | ( | ||||||||||||||
Other expense | |||||||||||||||||
| Total operating loss | $ | $ | $ | ||||||||||||||
The Company does not discretely allocate assets to its operating segments, nor does management evaluate operating segments using discrete asset information.
71
The following table summarizes sales to external customers by geographic regions based on billing location of the customer:
| Year Ended | |||||||||||||||||
| December 27, 2025 | December 28, 2024 | December 30, 2023 | |||||||||||||||
| (In millions) | |||||||||||||||||
| United States | $ | $ | $ | ||||||||||||||
| China (including Hong Kong) | |||||||||||||||||
| Taiwan | |||||||||||||||||
| Singapore | |||||||||||||||||
| Other regions | |||||||||||||||||
| Total sales to external customers | $ | $ | $ | ||||||||||||||
No customer accounted for at least 10% of the Company’s consolidated net revenue in fiscal years 2025 and 2024. One Client and Gaming segment customer accounted for 18 % of consolidated net revenue in fiscal year 2023.
The following table summarizes property and equipment, net by geographic areas:
| December 27, 2025 | December 28, 2024 | ||||||||||
| (In millions) | |||||||||||
| United States | $ | $ | |||||||||
| Singapore | |||||||||||
| Canada | |||||||||||
| Other countries | |||||||||||
| Total property and equipment, net | $ | $ | |||||||||
NOTE 5 – Acquisitions and Divestitures
Fiscal Year 2025 Acquisitions
ZT Systems Acquisition and ZT Manufacturing Business Divestiture
On March 31, 2025 (the Acquisition Date), the Company completed the acquisition of all issued and outstanding shares of ZT Systems, a provider of AI and general-purpose compute infrastructure for hyperscale computing companies, for a total purchase consideration of $4.4 billion. The acquisition is expected to enable the Company to deliver end-to-end AI solutions and accelerate the design and deployment of AMD-powered AI infrastructure at scale optimized for the cloud.
The purchase consideration was comprised of the following (in millions):
Cash paid on Acquisition Date | $ | |||||||
Fair value of | ||||||||
Fair value of contingent consideration(2) on Acquisition Date | ||||||||
Total purchase consideration | $ | |||||||
(1) Represented the fair value based on the closing price of AMD common stock on March 28, 2025 of $103.22 per share, as the transaction closed prior to the opening of markets on March 31, 2025.
(2) Represented the estimated fair value of additional consideration of up to 740,961 shares of AMD common stock to be issued and up to $300 million of cash to be paid to former ZT Systems stockholders and warrant holders when the contingencies are fully met.
72
The purchase consideration was preliminarily allocated as follows (in millions):
| Cash and cash equivalents | $ | ||||||||||
Assets held for sale | |||||||||||
Other assets | |||||||||||
Total assets acquired | |||||||||||
Liabilities held for sale | |||||||||||
Other liabilities | |||||||||||
Total liabilities assumed | |||||||||||
| Fair value of net assets acquired | |||||||||||
| Goodwill | |||||||||||
| Total purchase consideration | $ | ||||||||||
The Company preliminarily allocated the purchase price to identifiable tangible and intangible assets acquired and liabilities assumed based on estimates of their fair values, which were determined using generally accepted valuation techniques based on estimates and assumptions made by management. The assets and liabilities related to the data center infrastructure manufacturing business (ZT Manufacturing Business), which was divested on October 27, 2025, were classified as held for sale. Fair values of assets and liabilities classified as held for sale were determined using the income and cost valuation approaches, which incorporate significant unobservable inputs. Goodwill was assigned to the Company’s Data Center reporting unit, primarily attributed to the assembled workforce and is not expected to be deductible for income tax purposes. The Company retained select intellectual property and employees associated with the design operations (ZT Design Business).
The purchase consideration allocation, including the fair value allocation between ZT Systems’ Manufacturing and Design Businesses, is preliminary and subject to revision as additional information about the fair value of assets acquired and liabilities assumed becomes available. The Company may continue to evaluate and further revise the preliminary purchase consideration allocation during the remainder of the measurement period, which will not exceed 12 months from the Acquisition Date.
The results of operations of the ZT Design Business are included in the Company’s continuing operations within the Data Center segment and are not material. The results of operations of the ZT Manufacturing Business are presented as discontinued operations in the Company’s Consolidated Financial Statements.
In 2025, acquisition-related transaction costs of $47 million were recorded within Marketing, general and administrative expenses.
The following table presents a reconciliation of the contingent consideration liability (in millions):
Initial valuation of contingent consideration liability on Acquisition Date | $ | |||||||||||||
| Change in fair value | ||||||||||||||
Settlement in October 2025 | ( | |||||||||||||
Contingent consideration liability, December 27, 2025 | $ | |||||||||||||
The contingent consideration liability, which was measured at fair value on Acquisition Date and was remeasured to fair value until the contingencies were resolved, was settled in October 2025 with the former ZT shareholders and warrant holders as the contingencies were fully met. The change in fair value was recorded within Income from discontinued operations of the Company’s Consolidated Statements of Operations.
On October 27, 2025, the Company completed the sale of the ZT Manufacturing Business to Sanmina Corporation (Sanmina) for $2.4 billion in cash, subject to certain purchase price adjustments and 1,151,052 shares of Sanmina common stock. Upon close of the sale, the Company received cash of $1.4 billion, net of cash divested and purchase price adjustments, and shares of Sanmina common stock valued at $154 million. The purchase consideration received from the sale of the ZT Manufacturing Business is subject to customary post-closing adjustments.
73
The Company is eligible to receive additional cash consideration of up to $450 million to the extent certain conditions are met following the close of the sale through 2028 (Sanmina Earn-out). The Company applied the loss recovery approach, under which the difference between the fair value of the consideration received, excluding the Sanmina Earn-out, and the carrying amount of the net assets disposed, is recognized as an Earn-out receivable, to the extent it is probable of being received. Upon close of the sale, the Company recorded a Sanmina Earn-out receivable of $332 million within Other non-current assets in the Company’s Consolidated Balance Sheets. The Earn-out receivable will be subject to impairment assessment at the end of each reporting period prior to receipt of payment. The Company also entered into a Manufacturing Services Agreement with Sanmina with an initial term of five years.
Other Acquisitions
In 2025, the Company completed other business acquisitions for a total consideration of $90 million that resulted in the recognition of $79 million of goodwill. The financial results of these acquired businesses, which were not material, were included in the Company's Consolidated Statements of Operations from their respective dates of acquisition within the Data Center segment.
Pro Forma Information
Since the ZT Manufacturing Business, which represented the majority of ZT Systems’ operations, was classified as held for sale upon acquisition and subsequently sold in October 2025, pro forma information presenting the combined results of operations of ZT Systems and other acquired entities were deemed neither material nor meaningful to the Company’s consolidated income from continuing operations and were omitted.
Fiscal Year 2024 Acquisitions
Silo AI Acquisition
On August 9, 2024, the Company completed the acquisition of Silo AI Oy (Silo AI), an AI lab based in Finland, for $665 million in cash. The recorded purchase consideration of $553 million, net of closing adjustments, transaction costs and deferred cash compensation, was allocated to $19 million of identifiable intangible assets, $43 million of net liabilities assumed, and $577 million to goodwill. Goodwill was attributed to Silo AI’s workforce to accelerate the deployment and development of AI solutions on AMD hardware. Silo AI financial results, which were not material, were included in the Company's Statement of Operations since the date of acquisition, primarily within the Data Center segment.
Fiscal Year 2023 Acquisitions
During the year ended December 30, 2023, the Company completed business acquisitions for a total consideration of $134 million, recognizing $49 million of identifiable net assets and $85 million of goodwill. The financial results of these acquired businesses, which were not material, were included in the Company's Consolidated Statements of Operations from their respective dates of acquisition under the Data Center, Client and Gaming, and Embedded segments.
NOTE 6 – Goodwill and Acquisition-related Intangibles, net
Goodwill
In the first quarter of fiscal year 2025, the Company assigned goodwill to its updated reporting units to reflect the change in its segment reporting structure and determined no impairment immediately prior to and after the change.
74
The following table summarizes Goodwill:
Before segment change | After segment change | ||||||||||||||||||||||||||||||||||
(in millions) | Data Center | Embedded | Client | Gaming | Client and Gaming | Total | |||||||||||||||||||||||||||||
December 28, 2024 | $ | $ | $ | $ | $ | — | $ | ||||||||||||||||||||||||||||
Reassignment due to segment change | — | — | |||||||||||||||||||||||||||||||||
Acquisitions | — | — | — | — | |||||||||||||||||||||||||||||||
| December 27, 2025 | $ | $ | $ | $ | $ | $ | |||||||||||||||||||||||||||||
During the fourth quarter of fiscal years 2025 and 2024, the Company conducted its annual qualitative impairment tests of goodwill and concluded that there was no goodwill impairment with respect to its reporting units.
Acquisition-related Intangible Assets
The following table summarizes Acquisition-related Intangible Assets:
| December 27, 2025 | December 28, 2024 | |||||||||||||||||||||||||||||||||||||
| Gross Carrying Amount | Accumulated Amortization | Net Carrying Amount | Gross Carrying Amount | Accumulated Amortization | Net Carrying Amount | |||||||||||||||||||||||||||||||||
| (In millions) | (In millions) | |||||||||||||||||||||||||||||||||||||
| Developed technology | $ | $ | ( | $ | $ | $ | ( | $ | ||||||||||||||||||||||||||||||
| Customer relationships | ( | ( | ||||||||||||||||||||||||||||||||||||
| Product trademarks | ( | ( | ||||||||||||||||||||||||||||||||||||
| Acquisition-related intangible assets subject to amortization | ( | ( | ||||||||||||||||||||||||||||||||||||
| In-process research and development (IPR&D) not subject to amortization | — | — | ||||||||||||||||||||||||||||||||||||
| Total acquisition-related intangible assets, net | $ | $ | ( | $ | $ | $ | ( | $ | ||||||||||||||||||||||||||||||
In April 2025, $162 million of IPR&D intangible asset reached technological feasibility, was placed in service as developed technology and started amortization over its estimated useful life of 5 years.
Acquisition-related intangible amortization expense was $2.3 billion, $2.4 billion and $2.8 billion in fiscal year 2025, 2024 and 2023, respectively.
Based on the carrying value of acquisition-related intangibles recorded as of December 27, 2025, and assuming no subsequent impairment of the underlying assets, the estimated future annual amortization expense for acquisition-related intangibles is as follows:
Fiscal Year | 2026 | 2027 | 2028 | 2029 | 2030 | 2031 and thereafter | Total | ||||||||||||||||||||||||||||||||||
(In millions) | |||||||||||||||||||||||||||||||||||||||||
Future annual amortization | $ | $ | $ | $ | $ | $ | $ | ||||||||||||||||||||||||||||||||||
75
NOTE 7 – Related Parties—Equity Joint Ventures
ATMP Joint Ventures
The Company holds a 15 % equity interest in two joint ventures (collectively, the ATMP JV) with affiliates of Tongfu Microelectronics Co., Ltd, a Chinese joint stock company. The Company has no obligation to fund the ATMP JV. The Company accounts for its equity interests in the ATMP JV under the equity method of accounting due to its significant influence over the ATMP JV. The carrying value of the investment was $176 million and $149 million as of December 27, 2025 and December 28, 2024, respectively, and are recorded within Other non-current assets on the Company’s Consolidated Balance Sheets.
The ATMP JV provides assembly, test, mark and packaging (ATMP) services to the Company. The Company’s purchases from the ATMP JV were $2.0 billion and $1.7 billion in 2025 and 2024, respectively. The amounts payable to the ATMP JV were $408 million and $476 million as of December 27, 2025 and December 28, 2024, respectively, and are recorded within Accounts payable on the Company’s Consolidated Balance Sheets.
In 2024, the Company provided a $100 million term loan to one of the ATMP JVs for general corporate purposes, with interest at the three months term Secured Overnight Financing Rate (SOFR) plus 50 basis points, payable quarterly. The loan matures on October 16, 2026. The loan and related interest receivable are recorded within Prepaid expenses and other current assets on the Company’s Consolidated Balance Sheets.
During 2025, 2024 and 2023, the Company recorded income related to the ATMP JV of $26 million, $33 million and $16 million in Equity income in investee on its Consolidated Statement of Operations, respectively.
NOTE 8 – Financial Instruments
Financial Instruments Recorded at Fair Value on a Recurring Basis
| December 27, 2025 | December 28, 2024 | ||||||||||||||||||||||||||||||||||||||||||||||
| (In millions) | Level 1 | Level 2 | Level 3 | Total | Level 1 | Level 2 | Level 3 | Total | |||||||||||||||||||||||||||||||||||||||
| Cash equivalents | |||||||||||||||||||||||||||||||||||||||||||||||
| Money market funds | $ | $ | $ | $ | $ | $ | $ | $ | |||||||||||||||||||||||||||||||||||||||
| Corporate debt securities | |||||||||||||||||||||||||||||||||||||||||||||||
| U.S. government and agency securities | |||||||||||||||||||||||||||||||||||||||||||||||
| Non-U.S. government and agency securities | |||||||||||||||||||||||||||||||||||||||||||||||
| Time deposits and certificates of deposits | |||||||||||||||||||||||||||||||||||||||||||||||
| Short-term investments | |||||||||||||||||||||||||||||||||||||||||||||||
| Corporate debt securities | |||||||||||||||||||||||||||||||||||||||||||||||
| U.S. government and agency securities | |||||||||||||||||||||||||||||||||||||||||||||||
| Non-U.S. government and agency securities | |||||||||||||||||||||||||||||||||||||||||||||||
| Time deposits and certificates of deposits | |||||||||||||||||||||||||||||||||||||||||||||||
| Asset-backed and mortgage-backed securities | |||||||||||||||||||||||||||||||||||||||||||||||
| Other non-current assets | |||||||||||||||||||||||||||||||||||||||||||||||
| Long-term investments | |||||||||||||||||||||||||||||||||||||||||||||||
| Deferred compensation plan investments | |||||||||||||||||||||||||||||||||||||||||||||||
| Total assets measured at fair value | $ | $ | $ | $ | $ | $ | $ | $ | |||||||||||||||||||||||||||||||||||||||
Deferred compensation plan investments are primarily mutual fund investments held in a Rabbi trust established to maintain the Company’s executive deferred compensation plan.
76
The following is a summary of cash equivalents and short-term investments:
| December 27, 2025 | December 28, 2024 | ||||||||||||||||||||||||||||||||||||||||||||||
| Cost/ Amortized Cost | Gross Unrealized Gains | Gross Unrealized Losses | Estimated Fair Value | Cost/ Amortized Cost | Gross Unrealized Gains | Gross Unrealized Losses | Estimated Fair Value | ||||||||||||||||||||||||||||||||||||||||
| (in millions) | (in millions) | ||||||||||||||||||||||||||||||||||||||||||||||
| Money market funds | $ | $ | $ | $ | $ | $ | $ | $ | |||||||||||||||||||||||||||||||||||||||
| Corporate debt securities | ( | ||||||||||||||||||||||||||||||||||||||||||||||
| U.S. government and agency securities | |||||||||||||||||||||||||||||||||||||||||||||||
| Non-U.S. government and agency securities | |||||||||||||||||||||||||||||||||||||||||||||||
| Time deposits and certificates of deposits | |||||||||||||||||||||||||||||||||||||||||||||||
| Asset-backed and mortgage-backed securities | ( | ( | |||||||||||||||||||||||||||||||||||||||||||||
| $ | $ | $ | ( | $ | $ | $ | $ | ( | $ | ||||||||||||||||||||||||||||||||||||||
As of December 27, 2025 and December 28, 2024, the Company did not have material available-for-sale debt securities which had been in a continuous unrealized loss position of more than twelve months.
The contractual maturities of investments classified as available-for-sale are as follows:
| December 27, 2025 | December 28, 2024 | ||||||||||||||||||||||
| Amortized Cost | Fair Value | Amortized Cost | Fair Value | ||||||||||||||||||||
| (In millions) | (In millions) | ||||||||||||||||||||||
| Due within 1 year | $ | $ | $ | $ | |||||||||||||||||||
| Due in 1 year through 5 years | |||||||||||||||||||||||
| Due in 5 years and later | |||||||||||||||||||||||
| $ | $ | $ | $ | ||||||||||||||||||||
Financial Instruments Measured at Fair Value on a Non-Recurring Basis
As of December 27, 2025 and December 28, 2024, the Company had long-term investments in non-marketable equity securities of $1.1 billion and $468 million, respectively, which are recorded at estimated fair value based on observable events or adjustments from impairments.
As of December 27, 2025, non-marketable equity investments had cumulative gross unrealized gains of $291 million and cumulative gross unrealized losses and impairments of $51 million. During the year ended December 27, 2025, the Company recognized gross unrealized gains of $289 million and gross unrealized losses and impairments of $53 million. As of December 28, 2024, cumulative and annual gross unrealized gains, losses and impairments were not material.
77
Financial Instruments Not Recorded at Fair Value
The carrying amounts and estimated fair values of the Company’s long-term debt are as follows:
| December 27, 2025 | December 28, 2024 | ||||||||||||||||||||||
| Carrying Amount | Estimated Fair Value | Carrying Amount | Estimated Fair Value | ||||||||||||||||||||
| (In millions) | (In millions) | ||||||||||||||||||||||
| Current portion of long-term debt, net | $ | $ | $ | $ | |||||||||||||||||||
| Long-term debt, net of current portion | $ | $ | $ | $ | |||||||||||||||||||
The estimated fair value of the Company’s long-term debt is based on Level 2 inputs of quoted prices for the Company’s debt and comparable instruments in inactive markets.
The fair value of the Company’s accounts receivable, accounts payable and other short-term obligations approximate their carrying value based on existing terms.
Hedging Transactions and Derivative Financial Instruments
Foreign Currency Forward Contracts Designated as Accounting Hedges
The Company enters into foreign currency forward contracts to hedge its exposure to foreign currency exchange rate risk related to future forecasted transactions denominated in currencies other than the U.S. Dollar. These contracts generally mature within 24 months and are designated as accounting hedges. As of December 27, 2025 and December 28, 2024, the notional value of the Company’s outstanding foreign currency forward contracts designated as cash flow hedges was $2.3 billion and $2.2 billion, respectively. The fair value of these contracts as of December 27, 2025 and December 28, 2024 was not material.
Foreign Currency Forward Contracts Not Designated as Accounting Hedges
The Company also enters into foreign currency forward contracts to reduce the short-term effects of foreign currency fluctuations on certain receivables or payables denominated in currencies other than the U.S. Dollar. These forward contracts generally mature within 3 months and are not designated as accounting hedges. As of December 27, 2025 and December 28, 2024, the notional value of these outstanding contracts was $1.1 billion and $642 million, respectively. The fair value of these contracts as of December 27, 2025 and December 28, 2024 was not material.
The cash flows associated with derivative instruments as cash flow hedging instruments are classified in the same category within the Consolidated Statement of Cash Flows as the cash flows of the related items.
78
NOTE 9 – Debt, Revolving Credit Facility and Commercial Paper Program
Debt
The Company’s total debt as of December 27, 2025 and December 28, 2024 consisted of:
| December 27, 2025 | December 28, 2024 | ||||||||||
| (In millions) | |||||||||||
| 4.212% Senior Notes Due 2026 (4.212% Notes) | $ | $ | |||||||||
| 4.319% Senior Notes Due 2028 (4.319% Notes) | |||||||||||
| 2.375% Senior Notes Due 2030 (2.375% Notes) | |||||||||||
| 3.924% Senior Notes Due 2032 (3.924% Notes) | |||||||||||
| 4.393% Senior Notes Due 2052 (4.393% Notes) | |||||||||||
| Total debt (principal amount) | |||||||||||
| Unamortized debt discount and issuance costs | ( | ( | |||||||||
| Total debt (net) | |||||||||||
| Less: current portion of long-term debt and related unamortized debt issuance costs | ( | ||||||||||
| Total long-term debt | $ | $ | |||||||||
4.212% Senior Notes Due 2026 and 4.319% Senior Notes Due 2028
On March 24, 2025, the Company issued 4.212% Notes and 4.319% Notes in aggregate principal amount of $1.5 billion, which are general unsecured senior obligations of the Company. The interest is payable semi-annually on March 24 and September 24 of each year, commencing on September 24, 2025.
The Company may redeem some or all of the 4.212% Notes prior to September 24, 2026 and the 4.319% Notes prior to February 24, 2028 at a price equal to the greater of the present value of the principal amount and future interest through the maturity of the debt or 100% of the principal amount plus accrued and unpaid interest. On or after February 24, 2028, the Company may also redeem some or all of the 4.319% Notes at 100% of the principal amount plus accrued and unpaid interest.
Holders of the 4.212% Notes and the 4.319% Notes have the right to require the Company to repurchase all or a portion of their notes at 101% of the principal amount plus accrued and unpaid interest if the Company undergoes a change of control. An event of default may also accelerate the maturity of the 4.212% Notes and 4.319% Notes.
2.375% Senior Notes Due 2030, 3.924% Senior Notes Due 2032 and 4.393% Senior Notes Due 2052
The 2.375% Notes, 3.924% Notes and 4.393% Notes are general unsecured senior obligations of the Company with semi-annual fixed interest payments due on June 1 and December 1.
The Company may redeem some or all of the 3.924% Notes and 4.393% Notes prior to March 1, 2032 and December 1, 2051, respectively, at a price equal to the greater of the present value of the principal amount and future interest through the maturity of the 3.924% Notes or 4.393% Notes or 100% of the principal amount plus accrued and unpaid interest. Holders have the right to require the Company to repurchase all or a portion of the 3.924% Notes or 4.393% Notes in the event that the Company undergoes a change of control as defined in the indenture, at a repurchase price of 101% of the principal amount plus accrued and unpaid interest. Additionally, an event of default may result in the acceleration of the maturity of the 3.924% Notes and 4.393% Notes.
As of December 27, 2025, the Company was in compliance with the covenants associated with all of its debt.
Future Payments on Total Debt
As of December 27, 2025, the Company’s future debt payment obligations are as follows:
Fiscal Year | 2026 | 2027 | 2028 | 2029 | 2030 | 2031 and thereafter | Total | ||||||||||||||||||||||||||||||||||
(In millions) | |||||||||||||||||||||||||||||||||||||||||
Term Debt (Principal only) | $ | $ | — | $ | $ | $ | $ | $ | |||||||||||||||||||||||||||||||||
79
Revolving Credit Facility
The Company has $3 billion available under an unsecured revolving credit facility that expires on April 29, 2027. During 2025, the Company did not draw funds from the revolving credit facility. As of December 27, 2025, the Company was in compliance with the covenants under the revolving credit facility.
Commercial Paper
NOTE 10 – Leases
Operating Leases
The Company has entered into operating and finance leases for its corporate offices, data centers, research and development facilities and certain equipment. The leases expire at various dates through 2038, some of which include options to extend the lease for up to ten years.
For 2025, 2024 and 2023, the Company recorded $196 million, $147 million and $127 million, respectively, of operating lease expense, including short-term lease expense. For 2025, 2024, and 2023, the Company recorded $100 million, $83 million, and $46 million respectively, of variable lease expense, which primarily included operating expenses and property taxes associated with the usage of facilities under the operating leases. For 2025, 2024, and 2023 cash paid for operating leases included in operating cash flows was $176 million, $155 million, and $147 million respectively. Certain operating leases contain provisions for escalating lease payments subject to changes in the consumer price index. The Company’s finance and short-term leases are immaterial to the Company’s Consolidated Financial Statements.
Supplemental information as of and for the year December 27, 2025 related to leases is as follows:
| December 27, 2025 | December 28, 2024 | ||||||||||
| Weighted-average remaining lease term in years – operating leases | |||||||||||
| Weighted-average discount rate – operating leases | % | % | |||||||||
Future minimum lease payments under non-cancellable operating lease liabilities as of December 27, 2025 are as follows:
Fiscal Year | 2026 | 2027 | 2028 | 2029 | 2031 | 2031 and thereafter | Total | ||||||||||||||||||||||||||||||||||
(In millions) | |||||||||||||||||||||||||||||||||||||||||
Minimum lease payments | $ | $ | $ | $ | $ | $ | $ | ||||||||||||||||||||||||||||||||||
Less: interest | ( | ||||||||||||||||||||||||||||||||||||||||
Present value of net minimum lease payments | |||||||||||||||||||||||||||||||||||||||||
Less: current portion | |||||||||||||||||||||||||||||||||||||||||
Total long-term operating lease liabilities | $ | ||||||||||||||||||||||||||||||||||||||||
As of December 27, 2025, the Company has data center and other real estate leases that have not yet commenced with future lease payments of $1.3 billion. These leases are expected to commence in 2026 with lease terms of 1 year to 10 years.
NOTE 11 – Concentrations of Credit Risk
Financial instruments that potentially subject the Company to concentrations of credit risk consist primarily of investments in time deposits, available-for-sale debt securities, equity investments and trade receivables.
80
The Company places its investments with high credit quality financial institutions. At the time an investment is made, investments in commercial paper of industrial firms and financial institutions are rated A1, P1, F1 or better. The Company invests in bonds that are rated A, A2 or better and repurchase agreements, each of which have securities of the type and quality listed above as collateral.
The Company believes that concentrations of credit risk with respect to trade receivables are limited because a large number of geographically diverse customers make up the Company’s customer base, thus diluting the trade credit risk. One customer accounted for approximately 11 % and another customer accounted for 24 % of the total consolidated accounts receivable balance as of December 27, 2025 and December 28, 2024, respectively. However, the Company does not believe the receivable balance from these customers represents a significant credit risk based on past collection experience and review of their current credit quality.
NOTE 12 – Commitments and Contingencies
Commitments
The Company’s commitments primarily include the Company’s obligations to purchase wafers and substrates from third parties, and future payments related to multi-year cloud service provider (CSP), software, and technology license agreements. Some cloud service capacity may be reduced, terminated or sold to others by the CSPs, in which case the Company’s commitments will be reduced. The Company expects to utilize the cloud service capacity in its operations or assign the capacity to third parties. These commitments were made under noncancellable purchase orders and contractual obligations requiring minimum commitments for which cancellation would lead to significant penalties.
Total future unconditional commitments as of December 27, 2025 are as follows:
Fiscal Year | 2026 | 2027 | 2028 | 2029 | 2030 | 2031 and thereafter | Total | ||||||||||||||||||||||||||||||||||
(In millions) | |||||||||||||||||||||||||||||||||||||||||
Unconditional commitments | $ | $ | $ | $ | $ | $ | $ | ||||||||||||||||||||||||||||||||||
The Company continually works with suppliers and partners on the timing of payments and deliveries of purchase commitments, taking into account business conditions.
Warranties and Indemnities
The Company generally warrants that its products sold to its customers will conform to its approved specifications and be free from defects in material and workmanship under normal use and conditions for one year. The Company may also offer, in general, one to three-year limited warranties based on product type and negotiated warranty terms with certain customers. The Company accrues warranty costs to Cost of sales at the time of sale of warranted products.
Changes in the Company’s estimated liability for product warranty during 2025 and 2024 are as follows:
| December 27, 2025 | December 28, 2024 | ||||||||||
| (In millions) | |||||||||||
| Beginning balance | $ | $ | |||||||||
| Provisions during the period | |||||||||||
| Settlements during the period | ( | ( | |||||||||
| Ending balance | $ | $ | |||||||||
81
In addition to product warranties, the Company from time to time in its normal course of business indemnifies other parties with whom it enters into contractual relationships, including customers, lessors and parties to other transactions with the Company, with respect to certain matters. In these limited matters, the Company has agreed to hold certain third parties harmless against specific types of claims or losses such as those arising from a breach of representations or covenants, third-party claims that the Company’s products when used for their intended purpose(s) and under specific conditions infringe the intellectual property rights of a third party, or other specified claims made against the indemnified party. It is not possible to determine the maximum potential amount of liability under these indemnification obligations due to the unique facts and circumstances that are likely to be involved in each particular claim and indemnification provision. Historically, payments made by the Company under these obligations have not been material. In addition, the impact from changes in estimates for pre-existing warranties has been immaterial.
Litigation and Other Legal Matters
As of December 27, 2025, there were no material legal proceedings.
The Company is a defendant or plaintiff in various actions that arose in the normal course of business. With respect to these matters, based on management’s current knowledge, the Company believes that the amount or range of reasonably possible loss, if any, will not, either individually or in the aggregate, have a material adverse effect on the Company’s financial condition, results of operations, or cash flows.
NOTE 13 – Earnings Per Share
The following table sets forth the components of basic and diluted earnings per share:
| Year Ended | |||||||||||||||||
| December 27, 2025 | December 28, 2024 | December 30, 2023 | |||||||||||||||
| (In millions, except per share amounts) | |||||||||||||||||
| Numerator | |||||||||||||||||
| Income from continuing operations | $ | $ | $ | ||||||||||||||
| Income from discontinued operations | |||||||||||||||||
| Net income | $ | $ | $ | ||||||||||||||
| Denominator | |||||||||||||||||
| Basic weighted average shares | |||||||||||||||||
| Potentially dilutive shares from employee equity plans | |||||||||||||||||
| Diluted weighted average shares | |||||||||||||||||
| Earnings per share: | |||||||||||||||||
| Earnings per share from continuing operations - basic | $ | $ | $ | ||||||||||||||
| Earnings per share from discontinued operations - basic | |||||||||||||||||
| Basic earnings per share | $ | $ | $ | ||||||||||||||
| Earnings per share from continuing operations - diluted | $ | $ | $ | ||||||||||||||
| Earnings per share from discontinued operations - diluted | |||||||||||||||||
| Diluted earnings per share | $ | $ | $ | ||||||||||||||
Potential shares from employee equity plans totaling 9 million, 1 million and 6 million weighted-average shares for 2025, 2024 and 2023, respectively, were not included in the earnings per share calculation because their inclusion would have been anti-dilutive.
82
NOTE 14– Common Stock and Stock-Based Compensation
Common Stock
Shares of common stock outstanding were as follows:
| Year Ended | |||||||||||||||||
| December 27, 2025 | December 28, 2024 | December 30, 2023 | |||||||||||||||
| (In millions) | |||||||||||||||||
| Balance, beginning of period | |||||||||||||||||
Common stock issued in the acquisition of ZT Systems | |||||||||||||||||
| Common stock issued under employee equity plans | |||||||||||||||||
| Repurchases of common stock | ( | ( | ( | ||||||||||||||
| Common stock repurchases for tax withholding on equity awards | ( | ( | ( | ||||||||||||||
| Issuance of common stock upon warrant exercise | |||||||||||||||||
| Balance, end of period | |||||||||||||||||
Stock Repurchase Program
On May 13, 2025, the Company’s board of directors approved a new $6 billion share repurchase program. The authorization is in addition to the Company’s existing share repurchase program (collectively, the Repurchase Program), increasing the total repurchase authority to $14 billion. During 2025, the Company repurchased 12 million shares of its common stock under the Repurchase Program for $1.3 billion. The repurchased amounts do not include the 1% excise tax on stock repurchases enacted by the Inflation Reduction Act of 2022. As of December 27, 2025, $9.4 billion remained available for future stock repurchases under the Repurchase Program. The Repurchase Program does not obligate the Company to acquire any common stock, has no termination date and may be suspended or discontinued at any time.
Warrant
In October 2025, the Company issued to OpenAI OpCo, LLC (the Warrantholder) a warrant to purchase up to an aggregate of 160 million shares of the Company’s common stock at an exercise price of $0.01 per share. The warrant shares will vest in tranches based on AMD Instinct GPU purchase milestones by the Warrantholder, or its affiliates, or indirectly through third parties, and achievement of specified Company stock price targets and stock performance. Each vested tranche is further subject to the fulfillment of certain other technical and commercial conditions prior to exercise. Subject to certain terms and conditions, the warrant is exercisable through October 5, 2030. None of the warrant shares had met the vesting or exercise conditions as of December 27, 2025 and the issuance of the warrant had no impact to the Company's financial statements for the year ended December 27, 2025. The Company will account for the warrant shares as a liability until certain conditions for equity classification are satisfied.
Stock-Based Compensation
The Company’s employee equity programs are intended to attract, retain and motivate highly qualified employees. On May 18, 2023, the Company’s stockholders approved the AMD 2023 Equity Incentive Plan (the 2023 Plan). Under the 2023 Plan, 87,645,874 shares of the Company’s common stock are reserved and available for delivery pursuant to awards granted under the 2023 Plan. Generally, stock options granted under the 2023 Plan vest and become exercisable over a four-year period from the date of grant and expire within seven years after the grant date. Unvested shares from the 2023 Plan that are reacquired by the Company from forfeited outstanding equity awards become available for grant and may be reissued as new awards. Under the 2023 Plan, the Company can grant (i) stock options, and (ii) RSUs, including time-based RSUs and PRSUs.
Stock Options. Nonstatutory and incentive stock options may be granted to certain of the Company’s senior executives. The exercise price of the shares subject to each nonstatutory stock option and incentive stock option cannot be less than 100 % of the fair market value of the Company’s common stock on the date of the grant. The exercise price of each option granted under the 2023 Plan must be paid in full at the time of the exercise.
83
Time-based RSUs. Time-based RSUs are awards that can be granted to any employee, director or consultant and that obligate the Company to issue a specific number of shares of the Company’s common stock in the future if the vesting terms and conditions are satisfied.
PRSUs. PRSUs can be granted to certain of the Company’s senior executives. The performance metrics can be financial performance, non-financial performance and/or market conditions. Each PRSU award reflects a target number of shares (Target Shares) that may be issued to an award recipient before adjusting based on the Company’s financial performance, non-financial performance and/or market conditions. The actual number of shares that a grant recipient receives at the end of the period may range from 0 % to 250 % of the Target Shares granted, depending upon the degree of achievement of the performance target designated by each individual award.
ESPP. Under the 2017 Plan, eligible employees who participate in an offering period may have up to 15 % of their eligible earnings withheld, up to certain limitations, to purchase shares of common stock at 85 % of the lower of the fair market value on the first or the last business day of the six-month offering period. The offering periods commence in May and November each year.
As of December 27, 2025, the Company had 47 million shares of common stock that were available for future grants and 36 million shares reserved for issuance upon the exercise of outstanding stock options or the vesting of unvested RSUs, including PRSUs.
Valuation and Expense
Stock-based compensation expense was allocated in the Company’s Consolidated Statements of Operations as follows:
| Year Ended | |||||||||||||||||
| December 27, 2025 | December 28, 2024 | December 30, 2023 | |||||||||||||||
| (In millions) | |||||||||||||||||
| Cost of sales | $ | $ | $ | ||||||||||||||
| Research and development | |||||||||||||||||
| Marketing, general, and administrative | |||||||||||||||||
| Total stock-based compensation expense before income taxes | |||||||||||||||||
| Income tax benefit | ( | ( | ( | ||||||||||||||
| Total stock-based compensation expense, net of income taxes | $ | $ | $ | ||||||||||||||
Stock Options. The weighted-average estimated fair value of employee stock options granted during 2025, 2024 and 2023 was $89.01 , $68.38 and $53.72 per share, respectively, using the following assumptions:
| December 27, 2025 | December 28, 2024 | December 30, 2023 | |||||||||||||||
| Expected volatility | % | % | |||||||||||||||
| Risk-free interest rate | % | % | |||||||||||||||
| Expected dividends | % | % | % | ||||||||||||||
| Expected life (in years) | |||||||||||||||||
The Company uses a combination of the historical volatility of its common stock and the implied volatility for publicly traded options on the Company’s common stock as the expected volatility assumption. The risk-free interest rate is based on the rate for a U.S. Treasury zero-coupon yield curve with a term that approximates the expected life of the option grant at the date closest to the option grant date. The expected dividend yield is zero as the Company does not expect to pay dividends in the near future. The expected term of employee stock options represents the weighted-average period the stock options are expected to remain outstanding.
84
The following table summarizes stock option activity and related information:
| Outstanding Number of Shares | Weighted- Average Exercise Price | Aggregate Intrinsic Value | Weighted-Average Remaining Contractual Life (in years) | ||||||||||||||||||||
| (In millions, except share price) | |||||||||||||||||||||||
| Balance as of December 28, 2024 | $ | ||||||||||||||||||||||
| Granted | $ | ||||||||||||||||||||||
| Forfeited | $ | ||||||||||||||||||||||
| Exercised | $ | ||||||||||||||||||||||
| Balance as of December 27, 2025 | $ | $ | |||||||||||||||||||||
| Exercisable December 27, 2025 | $ | $ | |||||||||||||||||||||
The total intrinsic value of stock options exercised for 2025, 2024 and 2023 was $65 million, $86 million and $173 million, respectively. As of December 27, 2025, the Company had $51 million of total unrecognized compensation expense related to stock options, which will be recognized over the weighted-average period of 2.55 years.
Time-based RSUs. The weighted-average grant date fair values of time-based RSUs granted during 2025, 2024 and 2023 were $158.26 , $141.95 and $106.28 per share, respectively.
The following table summarizes time-based RSU activity and related information:
| Number of Shares | Weighted- Average Grant Date Fair Value | ||||||||||
(In millions) | |||||||||||
| Unvested shares as of December 28, 2024 | $ | ||||||||||
| Granted | $ | ||||||||||
| Forfeited | ( | $ | |||||||||
| Vested | ( | $ | |||||||||
| Unvested shares as of December 27, 2025 | $ | ||||||||||
The total fair value of time-based RSUs vested during 2025, 2024 and 2023 was $1.8 billion, $2.0 billion and $1.1 billion, respectively. As of December 27, 2025, the Company had $3.5 billion of total unrecognized compensation expense related to time-based RSUs, which will be recognized over the weighted-average period of 2.64 years.
PRSUs. The weighted-average grant date fair values of PRSUs granted during 2025, 2024 and 2023 were $263.71 , $118.98 and $134.87 , respectively, using the following assumptions:
| December 27, 2025 | December 28, 2024 | December 30, 2023 | |||||||||||||||
| Expected volatility | |||||||||||||||||
| Risk-free interest rate | |||||||||||||||||
| Expected dividends | % | % | % | ||||||||||||||
| Expected term (in years) | |||||||||||||||||
The Company uses the historical volatility of its common stock and risk-free interest rate based on the rate for a U.S. Treasury zero-coupon yield curve with a term that approximates the expected life of the PRSUs grant at the date closest to the grant date. The expected dividend yield is zero as the Company does not expect to pay dividends in the near future. The expected term of PRSUs represents the requisite service periods of these PRSUs.
85
The following table summarizes PRSU activity and related information:
| Number of Shares | Weighted-Average Grant Date Fair Value | ||||||||||
(In millions) | |||||||||||
| Unvested shares as of December 28, 2024 | $ | ||||||||||
| Granted | $ | ||||||||||
| Forfeited | $ | ||||||||||
| Vested | ( | $ | |||||||||
| Unvested shares as of December 27, 2025 | $ | ||||||||||
The total fair value of PRSUs vested during 2025, 2024 and 2023 was $78 million, $226 million and $100 million, respectively. As of December 27, 2025, the Company had $232 million of total unrecognized compensation expense related to PRSUs, which will be recognized over the weighted-average period of 1.42 years.
ESPP. The weighted-average grant date fair value for the ESPP during 2025, 2024 and 2023 was $48.39 , $43.8 0 and $31.11 per share, respectively, using the following assumptions:
| December 27, 2025 | December 28, 2024 | December 30, 2023 | |||||||||||||||
| Expected volatility | |||||||||||||||||
| Risk-free interest rate | |||||||||||||||||
| Expected dividends | % | % | % | ||||||||||||||
| Expected term (in years) | |||||||||||||||||
The Company uses the historical volatility of its common stock and the risk-free interest rate based on the rate for a U.S. Treasury zero-coupon yield curve with a term that approximates the expected life of the ESPP grant at the date closest to the ESPP grant date. The expected dividend yield is zero as the Company does not expect to pay dividends in the near future. The expected term of the ESPP represents the six-month offering period.
During 2025, 3 million shares of common stock were purchased under the ESPP at an average purchase price of $89.22 resulting in aggregate cash proceeds of $263 million. As of December 27, 2025, the Company had $52 million of total unrecognized compensation expense related to the ESPP, which will be recognized over the weighted-average period of 0.37 years.
NOTE 15 – Retirement Benefit Plans
The Company provides retirement benefit plans in the United States and certain foreign countries. The Company has a 401(k) retirement plan that allows participating employees in the United States to contribute as defined by the plan and subject to Internal Revenue Service limitations. The Company matches 75 % of employees’ contributions up to 6 % of their eligible compensation. The Company’s contributions to the 401(k) plan for 2025, 2024 and 2023 were approximately $84 million, $78 million and $70 million, respectively.
NOTE 16 – Restructuring Charges
In the fourth quarter of 2024, the Company implemented a restructuring plan (the 2024 Restructuring Plan) which reduced the global workforce by approximately 4% of headcount. Actions associated with the 2024 Restructuring Plan were substantially completed in the first quarter of fiscal year 2025. The 2024 Restructuring Plan charges to date were $186 million, of which $113 million was related to employee severance and benefits and $73 million was related to asset impairment. For 2025 and 2024, the Company made $79 million and $24 million of severance payments, respectively. In 2025, there were no charges or adjustments to period expenses under the 2024 Restructuring Plan. As of December 27, 2025 and December 28, 2024, restructuring plan liabilities of $10 million and $89 million, respectively, were recorded within Accrued liabilities in the Company’s Consolidated Balance Sheets.
86
NOTE 17 – Income Taxes
Continuing Operations
In 2025, the Company adopted ASU 2023-09 with prospective application. ASU 2023-09 updates disclosure requirements for the reconciliation of tax expense from continuing operations, income taxes paid and modifies other income tax-related disclosures.
Income before income taxes consists of the following:
| Year Ended | |||||||||||||||||
| December 27, 2025 | December 28, 2024 | December 30, 2023 | |||||||||||||||
| (In millions) | |||||||||||||||||
| U.S. | $ | $ | $ | ||||||||||||||
| Non-U.S. | ( | ( | |||||||||||||||
| Total pre-tax income including equity income in investee | $ | $ | $ | ||||||||||||||
The income tax provision (benefit) consists of:
| Year Ended | |||||||||||||||||
| December 27, 2025 | December 28, 2024 | December 30, 2023 | |||||||||||||||
| (In millions) | |||||||||||||||||
| Current: | |||||||||||||||||
| U.S. federal | $ | ( | $ | $ | |||||||||||||
| U.S. state and local | |||||||||||||||||
| Non-U.S. | |||||||||||||||||
| Total | ( | ||||||||||||||||
| Deferred: | |||||||||||||||||
| U.S. federal | ( | ( | |||||||||||||||
| U.S. state and local | ( | ( | |||||||||||||||
| Non-U.S. | ( | ( | ( | ||||||||||||||
| Total | ( | ( | |||||||||||||||
| Income tax provision (benefit) | $ | ( | $ | $ | ( | ||||||||||||
87
Year Ended | |||||||||||
| December 27, 2025 | |||||||||||
| Amount | Percentage | ||||||||||
| (In millions) | |||||||||||
| Statutory federal income tax expense at 21% | $ | % | |||||||||
| State taxes, net of federal benefit* | % | ||||||||||
Foreign tax effects | |||||||||||
| Canada | |||||||||||
Scientific Research and Experimental Development investment tax credits | ( | ( | % | ||||||||
Valuation allowance | % | ||||||||||
| Other | % | ||||||||||
| Singapore | |||||||||||
Development and expansion incentive | % | ||||||||||
| Other | % | ||||||||||
Other foreign jurisdictions | % | ||||||||||
Effect of changes in tax laws or rates enacted in the current period | ( | ( | % | ||||||||
Effect of cross-border tax laws | |||||||||||
| Global Intangible Low-Taxed Income (GILTI) | % | ||||||||||
| Foreign-Derived Intangible Income (FDII) deduction | ( | ( | % | ||||||||
| Other | ( | ( | % | ||||||||
Tax credits | |||||||||||
Research credits | ( | ( | % | ||||||||
Other tax credits | ( | ( | % | ||||||||
Nontaxable or nondeductible items | |||||||||||
| Stock-based and non-deductible employee compensation | ( | ( | % | ||||||||
Tax effect from post-acquisition transaction | % | ||||||||||
| Other | % | ||||||||||
Changes in unrecognized tax benefits (including interest and penalties) | ( | ( | % | ||||||||
| Income tax (benefit) | $ | ( | ( | % | |||||||
*State tax expense in Illinois and Arizona made up the majority (greater than 50%) of the tax effect in this category
The following table presents required disclosures prior to the adoption of ASU 2023-09 and displays the reconciliation between statutory federal income taxes and the total income tax provision (benefit).
| December 28, 2024 | December 30, 2023 | ||||||||||
(in millions) | |||||||||||
| Statutory federal income tax expense at 21% | $ | $ | |||||||||
| Tax effect from intercompany integration transaction | |||||||||||
| Foreign rate detriment (benefit) | ( | ||||||||||
| Interest and penalty | |||||||||||
| State income taxes, net of federal benefit | ( | ||||||||||
| Foreign-Derived Intangible Income (FDII) deduction | ( | ( | |||||||||
| Research credits | ( | ( | |||||||||
| GILTI and other foreign inclusion | ( | ( | |||||||||
| Stock-based and non-deductible compensation | ( | ( | |||||||||
| Other | |||||||||||
| Income tax provision (benefit) | $ | $ | ( | ||||||||
88
The Company recorded an income tax benefit of $103 million and an income tax provision of $381 million in 2025 and 2024, respectively, representing effective tax rates of (2.5%) and 19 %, respectively. The decrease in income tax provision in 2025 was primarily driven by an $853 million benefit related to the release of uncertain tax positions pertaining to the reasonable cause relief for dual consolidated losses approved by the IRS in April 2025 whereas the income tax provision in 2024 included $373 million tax effect from an intercompany integration transaction.
In July 2025, the OBBBA was enacted into law. For fiscal year 2025, the primary impact of the OBBBA to the Company’s tax provision was the accelerated expensing of domestic R&D activities which decreased the Company’s income eligible for FDII, reduced the Company’s deferred tax assets, and reduced the Company’s current income tax liability. To the extent OBBBA changes impacted the Company’s effective tax rate reconciliation, the impacts are presented in the respective line items in the effective tax rate reconciliation table above. The OBBBA also resulted in a remeasurement of GILTI deferred tax balances as presented on the line “Effect of changes in tax laws or rates enacted in the current period” in the effective tax rate reconciliation table above. Other OBBBA changes did not have a material impact on the Company’s financial statements.
As part of the Xilinx acquisition and as a result of certain employment and operational commitments the Company has made in Singapore, the Company has been granted a Development and Expansion Incentive (DEI) that is effective through 2031. The DEI reduces the local tax on Singapore income from a statutory rate of 17% to 5% through 2031. The tax expense reflected in the Company’s effective tax rate reconciliation is primarily due to the difference in tax rates applied to the current year pre-tax loss. Due to the current year pre-tax loss in Singapore, the Company did not receive any income tax or earnings per share benefit.
Deferred income taxes reflect the net tax effects of tax carryovers and temporary differences between the carrying amounts of assets and liabilities for financial reporting purposes and the balances for income tax purposes. Significant components of the Company’s deferred tax assets and liabilities as of December 27, 2025 and December 28, 2024 were as follows:
| December 27, 2025 | December 28, 2024 | ||||||||||
| (In millions) | |||||||||||
| Deferred tax assets: | |||||||||||
| Capitalized R&D | $ | $ | |||||||||
| Net operating loss carryovers | |||||||||||
| Accruals and reserves not currently deductible | |||||||||||
| Federal and state tax credit carryovers | |||||||||||
| Foreign R&D and investment tax credits | |||||||||||
| Employee benefits not currently deductible | |||||||||||
| Lease liability | |||||||||||
Foreign tax credits | |||||||||||
| Other | |||||||||||
| Total deferred tax assets | |||||||||||
| Less: valuation allowance | ( | ( | |||||||||
| Total deferred tax assets, net of valuation allowance | |||||||||||
| Deferred tax liabilities: | |||||||||||
| Acquired intangibles | ( | ( | |||||||||
| GILTI | ( | ( | |||||||||
| Right-of-use assets | ( | ( | |||||||||
| Depreciation | ( | ( | |||||||||
| Other | ( | ( | |||||||||
| Total deferred tax liabilities | ( | ( | |||||||||
| Net deferred tax assets | $ | $ | |||||||||
89
The reduction in the Company’s Net operating loss carryovers and the valuation allowance items followed the receipt of the reasonable cause relief for dual consolidated losses approved by the IRS in April 2025. Other reductions in the Company’s net deferred tax assets during 2025 were primarily driven by the impact of OBBBA.
The movement in the deferred tax valuation allowance was as follows:
| December 27, 2025 | December 28, 2024 | December 30, 2023 | |||||||||||||||
| (In millions) | |||||||||||||||||
| Balance at beginning of year | $ | $ | $ | ||||||||||||||
Charges to income tax expense and other accounts | ( | ||||||||||||||||
| Acquisition-related | |||||||||||||||||
| Balance at end of year | $ | $ | $ | ||||||||||||||
Through the end of fiscal year 2025, the Company continued to maintain a valuation allowance of approximately $1.3 billion for certain state, and foreign tax attributes due to lack of sufficient sources of future taxable income.
The Company’s U.S. federal and state net operating losses (NOLs) carryforwards as of December 27, 2025, were $94 million and $367 million, respectively. $20 million of U.S. federal NOLs will expire between 2027 and 2036, and $74 million of federal NOLs have no expiration date. State NOLs will expire at various dates through 2045. The federal tax credits of $6 million will expire at various dates between 2040 and 2042. The state tax return credits of $848 million will expire at various dates between 2026 and 2040, except for the California R&D credit, which does not expire. The Company also has $678 million of credit carryforward in Canada that will expire between 2028 and 2045.
A reconciliation of the Company's gross unrecognized tax benefits was as follows:
| December 27, 2025 | December 28, 2024 | December 30, 2023 | |||||||||||||||
| (In millions) | |||||||||||||||||
| Balance at beginning of year | $ | $ | $ | ||||||||||||||
| Increases for tax positions taken in the current year | |||||||||||||||||
| Increases for tax positions taken in prior years | |||||||||||||||||
| Decreases for tax positions taken in prior years | ( | ( | ( | ||||||||||||||
Decreases for settlements with taxing authorities | ( | ||||||||||||||||
Decreases for lapses in statutes of limitation | ( | ( | |||||||||||||||
| Balance at end of year | $ | $ | $ | ||||||||||||||
The amount of unrecognized tax benefits that would impact the effective tax rate if recognized was $571 million, $1.3 billion and $1.3 billion as of December 27, 2025, December 28, 2024 and December 30, 2023, respectively. The Company had $190 million, $298 million and $142 million of accrued penalties and interest related to unrecognized tax benefits as of December 27, 2025, December 28, 2024 and December 30, 2023, respectively. As of December 27, 2025 and December 28, 2024, the Company had long-term income tax liabilities related to unrecognized tax benefits, which include interest and penalties, of $806 million and $1.5 billion, respectively, recorded under Other long-term liabilities in the Company’s Consolidated Balance Sheets. The reduction in long-term income tax liabilities was primarily due to the release of $853 million of uncertain tax positions (including interest and penalties) following receipt of reasonable cause relief for dual consolidated losses approved by the IRS in April 2025.
The Company is subject to taxation in the U.S. and foreign jurisdictions. Earnings from non-U.S. activities are subject to local country income tax. The material jurisdiction in which the Company is subject to potential examination by the taxing authority is the United States, where tax years from 2007 are open for audit. Pre-acquisition Xilinx U.S. tax returns for fiscal years 2018 and 2019 are currently under audit by the IRS.
Under current U.S. tax law, the impact of future distributions of earnings from foreign subsidiaries are anticipated to be subject to withholding taxes from local jurisdictions and non-conforming U.S. state jurisdictions. The deferred tax liability on these undistributed earnings is not material.
90
The table below provides the updated requirements of ASU 2023-09 for cash paid for income taxes, net of refunds.
Year Ended | |||||
| December 27, 2025 | |||||
Cash paid for income taxes, net of refunds: | (In millions) | ||||
| Federal | $ | ||||
| State | |||||
| Foreign | |||||
Total cash paid for income taxes, net of refunds | $ | ||||
In 2025, cash paid for income taxes in California was $62 million. The Company has elected a refundable credit for the payments made as a result of the Business Credit Limitation in California.
Discontinued Operations
NOTE 18 – Other Income (Expense), Net
The following table summarizes the components of Other income (expense), net:
| Year Ended | |||||||||||||||||
| December 27, 2025 | December 28, 2024 | December 30, 2023 | |||||||||||||||
| (In millions) | |||||||||||||||||
| Interest income | $ | $ | $ | ||||||||||||||
Gains (losses) on long-term investments, net | ( | ||||||||||||||||
| Other income (expense) | ( | ( | |||||||||||||||
| Other income (expense), net | $ | $ | $ | ||||||||||||||
NOTE 19 – Subsequent Events
Subsequent to December 27, 2025, the Company entered into an agreement to guarantee a commercial partner's data center lease obligations in the event of their default. The maximum gross exposure is $4.1 billion, which will be reduced as the commercial partner makes payments to the lessor over 15 years, or if the commercial partner enters into an agreement to sell the data center capacity to a third party. The fair value of the guarantee liability is not expected to be material to the Consolidated Financial Statements.
91
Report of Independent Registered Public Accounting Firm
To the Stockholders and the Board of Directors of Advanced Micro Devices, Inc.
Opinion on the Financial Statements
We have audited the accompanying consolidated balance sheets of Advanced Micro Devices, Inc. (the Company) as of December 27, 2025 and December 28, 2024, the related consolidated statements of operations, comprehensive income, stockholders’ equity and cash flows for each of the three years in the period ended December 27, 2025, and the related notes (collectively referred to as the “consolidated financial statements”). In our opinion, the consolidated financial statements present fairly, in all material respects, the financial position of the Company at December 27, 2025 and December 28, 2024, and the results of its operations and its cash flows for each of the three years in the period ended December 27, 2025, in conformity with U.S. generally accepted accounting principles.
We also have audited, in accordance with the standards of the Public Company Accounting Oversight Board (United States) (PCAOB), the Company’s internal control over financial reporting as of December 27, 2025, based on criteria established in Internal Control—Integrated Framework issued by the Committee of Sponsoring Organizations of the Treadway Commission (2013 framework), and our report dated February 3, 2026 expressed an unqualified opinion thereon.
Basis for Opinion
These financial statements are the responsibility of the Company's management. Our responsibility is to express an opinion on the Company’s financial statements based on our audits. We are a public accounting firm registered with the PCAOB and are required to be independent with respect to the Company in accordance with the U.S. federal securities laws and the applicable rules and regulations of the Securities and Exchange Commission and the PCAOB.
We conducted our audits in accordance with the standards of the PCAOB. Those standards require that we plan and perform the audit to obtain reasonable assurance about whether the financial statements are free of material misstatement, whether due to error or fraud. Our audits included performing procedures to assess the risks of material misstatement of the financial statements, whether due to error or fraud, and performing procedures that respond to those risks. Such procedures included examining, on a test basis, evidence regarding the amounts and disclosures in the financial statements. Our audits also included evaluating the accounting principles used and significant estimates made by management, as well as evaluating the overall presentation of the financial statements. We believe that our audits provide a reasonable basis for our opinion.
Critical Audit Matter
The critical audit matter communicated below is a matter arising from the current period audit of the financial statements that was communicated or required to be communicated to the audit committee and that: (1) relates to accounts or disclosures that are material to the financial statements and (2) involved our especially challenging, subjective or complex judgments. The communication of the critical audit matter does not alter in any way our opinion on the consolidated financial statements, taken as a whole, and we are not, by communicating the critical audit matter below, providing a separate opinion on the critical audit matter or on the accounts or disclosures to which it relates.
92
Inventory Valuation | ||||||||
| Description of the Matter | At December 27, 2025, the Company’s net inventory balance was $7,920 million. As discussed in Note 2 to the consolidated financial statements, the Company adjusts the inventory carrying value to the lower of actual cost or the estimated net realizable value after completing ongoing reviews of on-hand inventory quantities exceeding forecasted demand, and by considering recent historical activity as well as anticipated demand. Auditing management’s inventory excess and obsolescence reserves involved significant judgment because the estimates are based on several factors that are affected by market, industry, and competitive conditions outside the Company's control. In estimating excess and obsolescence reserves, management developed certain assumptions, including forecasted demand which are sensitive to the competitiveness of product offerings, customer requirements, and product life cycles. These significant assumptions are forward-looking and could be affected by future economic and market conditions. | |||||||
| How We Addressed the Matter in Our Audit | We obtained an understanding, evaluated the design and tested the operating effectiveness of internal controls over the Company's inventory excess and obsolescence reserves estimation process, including the basis for developing the above-described assumptions and management’s judgments. Our audit procedures included, among others, testing the reasonableness of management’s key assumptions and judgments and testing the accuracy and completeness of the underlying data used to determine the amount of excess and obsolescence reserves. We compared the quantities and carrying value of on-hand inventories to related unit sales, both historical and forecasted, and evaluated the appropriateness and adequacy of management’s adjustments to such sales forecasts by analyzing potential technological changes in line with product life cycles. We also assessed the accuracy of forecasts underlying management's estimates by comparing management’s historical forecasts to actual results, evaluated industry and market factors and performed sensitivity analyses over the forecasted demand used by management to determine inventory excess and obsolescence reserves. | |||||||
/s/ Ernst & Young LLP
We have served as the Company’s auditor since 1970.
February 3, 2026
93
Report of Independent Registered Public Accounting Firm
To the Stockholders and the Board of Directors of Advanced Micro Devices, Inc.
Opinion on Internal Control Over Financial Reporting
We have audited Advanced Micro Devices, Inc.’s internal control over financial reporting as of December 27, 2025, based on criteria established in Internal Control—Integrated Framework issued by the Committee of Sponsoring Organizations of the Treadway Commission (2013 framework) (the COSO criteria). In our opinion, Advanced Micro Devices, Inc. (the Company) maintained, in all material respects, effective internal control over financial reporting as of December 27, 2025, based on the COSO criteria.
We also have audited, in accordance with the standards of the Public Company Accounting Oversight Board (United States) (PCAOB), the consolidated balance sheets of the Company as of December 27, 2025 and December 28, 2024, the related consolidated statements of operations, comprehensive income, stockholders’ equity and cash flows for each of the three years in the period ended December 27, 2025, and the related notes and our report dated February 3, 2026 expressed an unqualified opinion thereon.
Basis for Opinion
The Company’s management is responsible for maintaining effective internal control over financial reporting and for its assessment of the effectiveness of internal control over financial reporting included in the accompanying Management’s Report on Internal Control over Financial Reporting. Our responsibility is to express an opinion on the Company’s internal control over financial reporting based on our audit. We are a public accounting firm registered with the PCAOB and are required to be independent with respect to the Company in accordance with the U.S. federal securities laws and the applicable rules and regulations of the Securities and Exchange Commission and the PCAOB.
We conducted our audit in accordance with the standards of the PCAOB. Those standards require that we plan and perform the audit to obtain reasonable assurance about whether effective internal control over financial reporting was maintained in all material respects.
Our audit included obtaining an understanding of internal control over financial reporting, assessing the risk that a material weakness exists, testing and evaluating the design and operating effectiveness of internal control based on the assessed risk, and performing such other procedures as we considered necessary in the circumstances. We believe that our audit provides a reasonable basis for our opinion.
Definition and Limitations of Internal Control Over Financial Reporting
A company’s internal control over financial reporting is a process designed to provide reasonable assurance regarding the reliability of financial reporting and the preparation of financial statements for external purposes in accordance with generally accepted accounting principles. A company’s internal control over financial reporting includes those policies and procedures that (1) pertain to the maintenance of records that, in reasonable detail, accurately and fairly reflect the transactions and dispositions of the assets of the company; (2) provide reasonable assurance that transactions are recorded as necessary to permit preparation of financial statements in accordance with generally accepted accounting principles, and that receipts and expenditures of the company are being made only in accordance with authorizations of management and directors of the company; and (3) provide reasonable assurance regarding prevention or timely detection of unauthorized acquisition, use, or disposition of the company’s assets that could have a material effect on the financial statements.
Because of its inherent limitations, internal control over financial reporting may not prevent or detect misstatements. Also, projections of any evaluation of effectiveness to future periods are subject to the risk that controls may become inadequate because of changes in conditions, or that the degree of compliance with the policies or procedures may deteriorate.
/s/ Ernst & Young LLP
San Jose, California
February 3, 2026
94
ITEM 9. CHANGES IN AND DISAGREEMENTS WITH ACCOUNTANTS ON ACCOUNTING AND FINANCIAL DISCLOSURE
None.
ITEM 9A. CONTROLS AND PROCEDURES
Disclosure Controls and Procedures
We maintain disclosure controls and procedures that are designed with the objective of providing reasonable assurance that information required to be disclosed in our reports filed under the Exchange Act, such as this Annual Report on Form 10-K is recorded, processed, summarized and reported within the time periods specified in the SEC’s rules and forms, and that such information is accumulated and communicated to our management, including our Chief Executive Officer and Chief Financial Officer, as appropriate, to allow timely decisions regarding required disclosure. In designing and evaluating our disclosure controls and procedures, our management recognizes that any controls and procedures, no matter how well designed and operated, can provide only reasonable assurance of achieving the desired control objectives, and our management is required to apply its judgment in evaluating the cost-benefit relationship of possible controls and procedures.
As of December 27, 2025, the end of the period covered by this report, we carried out an evaluation, under the supervision and with the participation of our management, including our Chief Executive Officer and Chief Financial Officer, of the effectiveness of the design and operation of our disclosure controls and procedures pursuant to Exchange Act Rules 13a-15(e) and 15d-15(e). This type of evaluation is performed on a quarterly basis so that conclusions of management, including our Chief Executive Officer and Chief Financial Officer, concerning the effectiveness of the disclosure controls can be reported in our periodic reports on Form 10-Q and Form 10-K. The overall goals of these evaluation activities are to monitor our disclosure controls and to modify them, as necessary. We intend to maintain the disclosure controls as dynamic systems that we adjust as circumstances merit. Based on the foregoing, our Chief Executive Officer and Chief Financial Officer concluded that our disclosure controls and procedures were effective at the reasonable assurance level as of the end of the period covered by this report.
Management’s Report on Internal Control over Financial Reporting
Internal control over financial reporting refers to the process designed by, or under the supervision of, our Chief Executive Officer and Chief Financial Officer, and effected by our Board of Directors, management and other personnel, to provide reasonable assurance regarding the reliability of financial reporting and the preparation of financial statements for external purposes in accordance with U.S. generally accepted accounting principles, and includes those policies and procedures that:
1.Pertain to the maintenance of records that in reasonable detail accurately and fairly reflect the transactions and dispositions of the assets of the Company;
2.Provide reasonable assurance that transactions are recorded as necessary to permit preparation of financial statements in accordance with U.S. generally accepted accounting principles, and that receipts and expenditures of the Company are being made only in accordance with authorizations of management and directors of the Company; and
3.Provide reasonable assurance regarding prevention or timely detection of unauthorized acquisition, use or disposition of the Company’s assets that could have a material effect on the financial statements. Internal control over financial reporting cannot provide absolute assurance of achieving financial reporting objectives because of its inherent limitations.
Internal control over financial reporting is a process that involves human diligence and compliance and is subject to lapses in judgment and breakdowns resulting from human failures. Internal control over financial reporting also can be circumvented by collusion or improper management override. Because of such limitations, there is a risk that material misstatements may not be prevented or detected on a timely basis by internal control over financial reporting. However, these inherent limitations are known features of the financial reporting process. Therefore, it is possible to design into the process safeguards to reduce, though not eliminate, this risk. Management is responsible for establishing and maintaining adequate internal control over financial reporting for the Company.
95
Management has used the 2013 framework set forth in the report entitled “Internal Control—Integrated Framework” published by the Committee of Sponsoring Organizations of the Treadway Commission to evaluate the effectiveness of the Company’s internal control over financial reporting. Management has concluded that the Company’s internal control over financial reporting was effective as of December 27, 2025 at the reasonable assurance level. Our independent registered public accounting firm, Ernst & Young LLP, has issued an attestation report on the Company’s internal control over financial reporting as of December 27, 2025, which is included in Part II, Item 8, above.
Changes in Internal Control over Financial Reporting
There has been no change in our internal controls over financial reporting during our most recently completed fiscal quarter that has materially affected, or is reasonably likely to materially affect, our internal controls over financial reporting.
ITEM 9B. OTHER INFORMATION
During the quarterly period ended December 27, 2025, the following directors and officers adopted, modified or terminated 10b5-1 plans:
On November 14, 2025 , Mark Papermaster, our Executive Vice President, Chief Technology Officer, adopted a Rule 10b5-1 trading plan, that is intended to satisfy the affirmative defense of Rule 10b5-1(c) under the Exchange Act, pursuant to which a maximum of 124,936 shares of our common stock may be sold. The plan will terminate on November 16, 2026 , or such date as the plan is otherwise terminated according to its terms.
ITEM 9C. DISCLOSURE REGARDING FOREIGN JURISDICTIONS THAT PREVENT INSPECTIONS
Not applicable.
96
PART III
ITEM 10. DIRECTORS, EXECUTIVE OFFICERS AND CORPORATE GOVERNANCE
AMD has adopted an insider trading policy governing the purchase, sale, and other dispositions of our securities by our directors, officers, employees and other individuals associated with us that we believe is reasonably designed to promote compliance with insider trading laws, rules and regulations, and any applicable listing standards. A copy of our insider trading policy is filed as Exhibit 19.1 to this Annual Report on Form 10-K.
The information under the captions “Item 1—Election of Directors” (including “Consideration of Stockholder Nominees for Director”), “Corporate Governance,” “Meetings and Committees of the Board of Directors,” “Executive Officers” and “Delinquent Section 16(a) Reports” in our proxy statement for our 2026 annual meeting of stockholders (our 2026 Proxy Statement) is incorporated herein by reference. There were no material changes to the procedures by which stockholders may recommend nominees to our board of directors. See also, “Part 1, Item 1-Website Access to our SEC Filings and Corporate Governance Documents,” above.
ITEM 11. EXECUTIVE COMPENSATION
The information under the captions “Compensation Committee Interlocks and Insider Participation,” “Directors’ Compensation and Benefits” (including “2025 Non-Employee Director Compensation”), “Compensation Discussion and Analysis,” “Executive Compensation” (including “2025 Summary Compensation Table,” “2025 Nonqualified Deferred Compensation,” “Outstanding Equity Awards at 2025 Fiscal Year-End,” “Grants of Plan-Based Awards in 2025” and “Option Exercises and Stock Vested in 2025,” “Severance and Change in Control Arrangements” and “Chief Executive Officer Pay Ratio”), and “Compensation and Leadership Resources Committee Report” in our 2026 Proxy Statement is incorporated herein by reference.
ITEM 12. SECURITY OWNERSHIP OF CERTAIN BENEFICIAL OWNERS AND MANAGEMENT AND RELATED STOCKHOLDER MATTERS
The information under the captions “Principal Stockholders,” “Security Ownership of Directors and Executive Officers” and “Equity Compensation Plan Information” in our 2026 Proxy Statement is incorporated herein by reference.
ITEM 13. CERTAIN RELATIONSHIPS AND RELATED TRANSACTIONS AND DIRECTOR INDEPENDENCE
The information under the captions “Corporate Governance—Independence of Directors” and “Certain Relationships and Related Transactions” in our 2026 Proxy Statement is incorporated herein by reference.
ITEM 14. PRINCIPAL ACCOUNTANT FEES AND SERVICES
The information under the captions “Item 2—Ratification of Appointment of Independent Registered Public Accounting Firm—Independent Registered Public Accounting Firm’s Fees” in our 2026 Proxy Statement is incorporated herein by reference.
With the exception of the information specifically incorporated by reference in Part III of this Annual Report on Form 10-K from our 2026 Proxy Statement, our 2026 Proxy Statement will not be deemed to be filed as part of this report. Without limiting the foregoing, the information under the captions “Compensation and Leadership Resources Committee Report” and “Audit and Finance Committee Report” in our 2026 Proxy Statement is not incorporated by reference in this Annual Report on Form 10-K.
97
PART IV
ITEM 15. EXHIBITS AND FINANCIAL STATEMENT SCHEDULES
1. Financial Statements
The financial statements of AMD are set forth in Item 8 of this Annual Report on Form 10-K, as indexed below.
Index to Consolidated Financial Statements
Reports of Independent Registered Public Accounting Firm (PCAOB ID: | ||||||||
All schedules have been omitted because the information is not required, is not applicable, or is included in the Notes to the Consolidated Financial Statements.
2. Exhibits
The exhibits listed in the accompanying Index to Exhibits are filed as part of, or incorporated by reference into, this Annual Report on Form 10-K. The following is a list of such Exhibits:
| Exhibit | Description of Exhibits | |||||||||||||
| 2.1 | ||||||||||||||
2.2 | ||||||||||||||
2.3 | ||||||||||||||
| 3.1 | ||||||||||||||
| 3.2 | ||||||||||||||
| 4.1 | ||||||||||||||
| 4.2 | ||||||||||||||
98
| 4.3 | ||||||||||||||
| 4.4 | ||||||||||||||
| 4.5 | ||||||||||||||
4.6 | ||||||||||||||
4.7 | ||||||||||||||
4.8 | ||||||||||||||
4.9 | ||||||||||||||
| *10.1 | ||||||||||||||
| *10.2 | ||||||||||||||
| *10.3 | ||||||||||||||
| *10.4 | ||||||||||||||
| *10.5 | ||||||||||||||
| *10.6 | ||||||||||||||
| *10.7 | ||||||||||||||
*10.8 | ||||||||||||||
| 10.9 | ||||||||||||||
99
**10.10 | ||||||||||||||
10.11 | ||||||||||||||
10.12 | ||||||||||||||
10.13 | ||||||||||||||
*10.14 | ||||||||||||||
*10.15 | ||||||||||||||
*10.16 | ||||||||||||||
*10.17 | ||||||||||||||
*10.18 | ||||||||||||||
| 10.19 | ||||||||||||||
*10.20 | ||||||||||||||
*10.21 | ||||||||||||||
*10.22 | ||||||||||||||
*10.23 | ||||||||||||||
*10.24 | ||||||||||||||
*10.25 | ||||||||||||||
100
*10.26 | ||||||||||||||
*10.27 | ||||||||||||||
*10.28 | ||||||||||||||
*10.29 | ||||||||||||||
*10.30 | ||||||||||||||
*10.31 | ||||||||||||||
*10.32 | ||||||||||||||
*10.33 | ||||||||||||||
*10.34 | ||||||||||||||
*10.35 | ||||||||||||||
*10.36 | ||||||||||||||
*10.37 | ||||||||||||||
*10.38 | ||||||||||||||
*10.39 | ||||||||||||||
*10.40 | ||||||||||||||
101
*10.41 | ||||||||||||||
*10.42 | ||||||||||||||
| 10.43 | ||||||||||||||
*10.44 | ||||||||||||||
*10.45 | ||||||||||||||
*10.46 | ||||||||||||||
| 10.47 | ||||||||||||||
*10.48 | ||||||||||||||
*10.49 | ||||||||||||||
*10.50 | ||||||||||||||
*10.51 | ||||||||||||||
*10.52 | ||||||||||||||
*10.53 | ||||||||||||||
*10.54 | ||||||||||||||
*10.55 | ||||||||||||||
102
*10.56 | ||||||||||||||
*10.57 | ||||||||||||||
| 10.58 | ||||||||||||||
| 10.59 | ||||||||||||||
*10.60 | ||||||||||||||
*10.61 | ||||||||||||||
**10.62 | ||||||||||||||
**10.63 | ||||||||||||||
*10.64 | ||||||||||||||
*10.65 | ||||||||||||||
*10.66 | ||||||||||||||
*10.67 | ||||||||||||||
*10.68 | ||||||||||||||
*10.69 | ||||||||||||||
103
*10.70 | ||||||||||||||
| 10.71 | ||||||||||||||
| 10.72 | ||||||||||||||
*10.73 | ||||||||||||||
*10.74 | ||||||||||||||
*10.75 | ||||||||||||||
| 19.1 | ||||||||||||||
| 21 | ||||||||||||||
| 23 | ||||||||||||||
| 24 | ||||||||||||||
| 31.1 | ||||||||||||||
| 31.2 | ||||||||||||||
| 32.1 | ||||||||||||||
| 32.2 | ||||||||||||||
97 | ||||||||||||||
| 101.INS | XBRL Instance Document -the instance document does not appear in the Interactive Data File because its XBRL tags are embedded within the Inline XBRL document | |||||||||||||
| 101.SCH | XBRL Taxonomy Extension Schema Document | |||||||||||||
| 101.CAL | XBRL Taxonomy Extension Calculation Linkbase Document | |||||||||||||
| 101.DEF | XBRL Taxonomy Extension Definition Linkbase Document | |||||||||||||
| 101.LAB | XBRL Taxonomy Extension Label Linkbase Document | |||||||||||||
| 101.PRE | XBRL Taxonomy Extension Presentation Linkbase Document | |||||||||||||
| 104 | Cover Page Interactive Data File -the Cover Page Interactive Data File does not appear in the Interactive Data File because its XBRL tags are embedded within the Inline XBRL document | |||||||||||||
104
_____________________
* Management contracts and compensatory plans or arrangements.
** Portions of this exhibit have been omitted because they are both (i) not material and (ii) would be competitively harmful if publicly disclosed.
AMD will furnish a copy of any exhibit on request and payment of AMD’s reasonable expenses of furnishing such exhibit.
ITEM 16. FORM 10-K SUMMARY
Not applicable.
105
SIGNATURES
Pursuant to the requirements of Section 13 or 15(d) of the Securities Exchange Act of 1934, the registrant has duly caused this report to be signed on its behalf by the undersigned, thereunto duly authorized.
| February 3, 2026 | ADVANCED MICRO DEVICES, INC. | ||||||||||
| By: | /s/ Jean Hu | ||||||||||
Jean Hu | |||||||||||
Executive Vice President, Chief Financial Officer and Treasurer | |||||||||||
Pursuant to the requirements of the Securities Exchange Act of 1934, this report has been signed below by the following persons, on behalf of the registrant and in the capacities and on the dates indicated.
| Signature | Title | Date | |||||||||||||||
| /s/Lisa T. Su | President and Chief Executive Officer (Principal Executive Officer), Director | February 3, 2026 | |||||||||||||||
| Lisa T. Su | |||||||||||||||||
| /s/Jean Hu | Executive Vice President, Chief Financial Officer and Treasurer (Principal Financial Officer) | February 3, 2026 | |||||||||||||||
| Jean Hu | |||||||||||||||||
/s/Emily Ellis | Corporate Vice President, Chief Accounting Officer (Principal Accounting Officer) | February 3, 2026 | |||||||||||||||
Emily Ellis | |||||||||||||||||
| * | Lead Independent Director | February 3, 2026 | |||||||||||||||
| Nora M. Denzel | |||||||||||||||||
| * | Director | February 3, 2026 | |||||||||||||||
Mike P. Gregoire | |||||||||||||||||
| * | Director | February 3, 2026 | |||||||||||||||
Joe A. Householder | |||||||||||||||||
| * | Director | February 3, 2026 | |||||||||||||||
John W. Marren | |||||||||||||||||
| * | Director | February 3, 2026 | |||||||||||||||
KC McClure | |||||||||||||||||
| * | Director | February 3, 2026 | |||||||||||||||
| Jon A. Olson | |||||||||||||||||
| * | Director | February 3, 2026 | |||||||||||||||
| Abhi Y. Talwalkar | |||||||||||||||||
| * | Director | February 3, 2026 | |||||||||||||||
| Beth W. Vanderslice | |||||||||||||||||
| *By: | /s/Jean Hu | ||||
Jean Hu, Attorney-in-Fact | |||||
106