EX-99.2
Published on August 4, 2026
AMD Financial Results Second Quarter 2026 August 4, 2026
2 | | Q2 2026 FINANCIAL RESULTS – August 4, 2026 Cautionary Statement This presentation contains forward-looking statements concerning Advanced Micro Devices, Inc. (AMD), such as the features, functionality, performance, availability, timing and expected benefits of future AMD products; AMD's large growth opportunities across diverse set of markets; AMD's data center AI accelerator opportunity; the expected plans, benefits and timing of AMD’s partnerships and strategic collaborations, including with Microsoft and Cisco; the strategic partnership with Anthropic and the deployment of up to two gigawatts of AMD Instinct GPUs in AMD Helios racks; AMD's expected third quarter 2026 financial outlook, including revenue, non-GAAP gross margin, non-GAAP operating expenses, non- GAAP Interest Expense/Other Income (Expense), net, non-GAAP tax rate and diluted share count; AMD’s large and compelling TAM; AMD’s ability to expand Data Center and AI leadership; AMD's financial and operating performance, including earnings growth and margin expansion; and AMD’s ability to drive long-term shareholder returns, which are made pursuant to the Safe Harbor provisions of the Private Securities Litigation Reform Act of 1995. Forward-looking statements are commonly identified by words such as "would," "may," "expects," "believes," "plans," "intends," "projects" and other terms with similar meaning. Investors are cautioned that the forward-looking statements in this presentation are based on current beliefs, assumptions and expectations, speak only as of the date of this presentation and involve risks and uncertainties that could cause actual results to differ materially from current expectations. Such statements are subject to certain known and unknown risks and uncertainties, many of which are difficult to predict and are generally beyond AMD’s control, that could cause actual results and other future events to differ materially from those expressed in, or implied or projected by, the forward-looking information and statements. Material factors that could cause actual results to differ materially from current expectations include, without limitation, the following: impact of government actions and regulations such as export regulations, national-security-based regulations, import tariffs, trade protection measures, and licensing requirements; competitive markets in which AMD’s products are sold; the cyclical nature of the semiconductor industry; market conditions of the industries in which AMD products are sold; AMD's ability to introduce products on a timely basis with expected features and performance levels; loss of a significant customer; economic and market uncertainty; quarterly and seasonal sales patterns; AMD's ability to adequately protect its technology or other intellectual property; unfavorable currency exchange rate fluctuations; ability of third party manufacturers to manufacture AMD's products on a timely basis in sufficient quantities and using competitive technologies; availability of essential equipment, materials, components (such as memory), substrates or manufacturing processes; ability to achieve expected manufacturing yields for AMD’s products; AMD's ability to generate revenue from its semi-custom SoC products; potential security vulnerabilities; potential security incidents including IT outages, data loss, data breaches and cyberattacks; uncertainties involving the ordering and shipment of AMD’s products; AMD’s reliance on third-party intellectual property to design and introduce new products; AMD's reliance on third-party companies for design, manufacture and supply of motherboards, software, memory and other computer platform components; AMD's reliance on Microsoft and other software vendors' support to design and develop software to run on AMD’s products; AMD’s reliance on third-party distributors and add-in-board partners; impact of modification or interruption of AMD’s internal business processes and information systems; compatibility of AMD’s products with some or all industry-standard software and hardware; costs related to defective products; failure to maintain an efficient supply chain as customer demand changes; AMD's ability to rely on third party supply-chain logistics functions; AMD’s ability to effectively control sales of its products on the gray market; impact of climate change on AMD’s business; AMD’s ability to realize its deferred tax assets; potential tax liabilities; current and future claims and litigation; impact of environmental laws, conflict minerals related provisions and other laws or regulations; evolving expectations from governments, investors, customers and other stakeholders regarding corporate responsibility matters; issues related to the responsible use of AI; restrictions imposed by agreements governing AMD’s notes, the guarantees of Xilinx’s notes and the revolving credit agreement; AMD’s ability to satisfy financial obligations under guarantees, leases and other commercial commitments; impact of acquisitions, joint ventures and/or investments on AMD’s business and AMD’s ability to integrate acquired businesses; impact of any impairment of the combined company’s assets; political, legal and economic risks and natural disasters; future impairments of technology license purchases; AMD’s ability to attract and retain key employees; and AMD’s stock price volatility. Investors are urged to review in detail the risks and uncertainties in AMD’s Securities and Exchange Commission filings, including but not limited to AMD’s most recent reports on Forms 10-K and 10-Q. This presentation also contains estimates and other statistical data made by independent parties and by us relating to market size and other data about our industry. This data involves a number of assumptions and limitations, and you are cautioned not to give undue weight to such estimates. NON-GAAP Financial Measures In this presentation, in addition to GAAP financial results, AMD has provided non-GAAP financial measures including non-GAAP gross profit, non-GAAP gross margin, non-GAAP operating expenses, non-GAAP operating expenses/revenue percent, non-GAAP operating income, non-GAAP operating margin, non-GAAP net income and non-GAAP diluted earnings per share. AMD uses a normalized tax rate in its computation of the non-GAAP income tax provision to provide better consistency across the reporting periods. For fiscal 2026, AMD uses a projected non-GAAP tax rate of 13%, which excludes the tax impact of pre-tax non-GAAP adjustments. Additionally, AMD has provided an adjusted non-GAAP gross profit and gross margin for Q2’25 which excludes the inventory and related charges associated with U.S. export restrictions. AMD also provides adjusted free cash flow as supplemental non-GAAP measures of its performance. AMD is providing these financial measures because it believes this non-GAAP presentation makes it easier for investors to compare its operating results for current and historical periods and also because AMD believes it assists investors in comparing AMD’s performance across reporting periods on a consistent basis by excluding items that it does not believe are indicative of its core operating performance. The non-GAAP financial measures disclosed in this presentation should be viewed in addition to and not as a substitute for or superior to AMD’s reported results prepared in accordance with GAAP and should be read only in conjunction with AMD’s Consolidated Financial Statements prepared in accordance with GAAP. These non-GAAP financial measures referenced are reconciled to their most directly comparable GAAP financial measures in the Appendices at the end of this presentation. This presentation also contains forward-looking non-GAAP measures concerning AMD’s financial outlook such as gross margin, operating expenses, interest expense/other income (expense), net, tax rate and diluted share count. These forward-looking non-GAAP measures are based on current expectations as of August 4, 2026, and assumptions and beliefs that involve numerous risks and uncertainties. AMD undertakes no intent or obligation to publicly update or revise its forward-looking statements made in this presentation except as may be required by law.
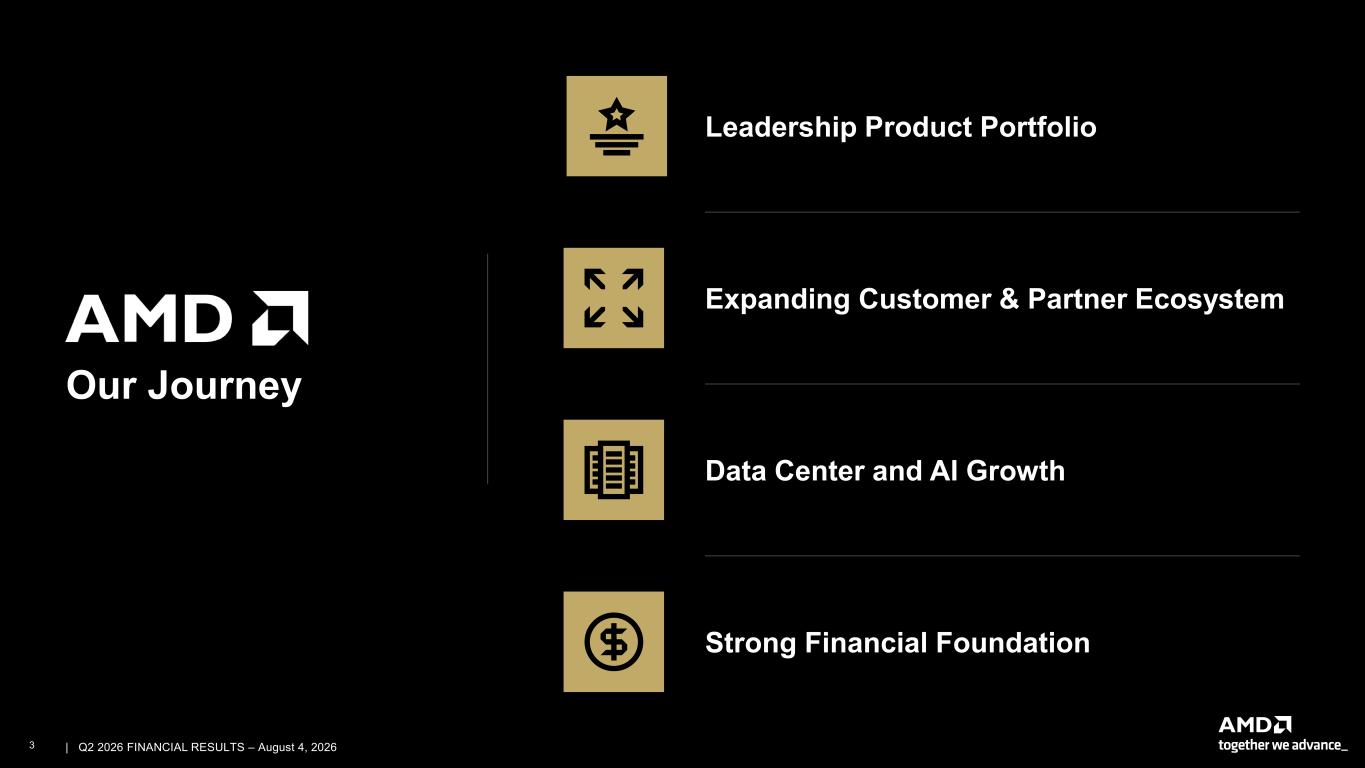
3 | | Q2 2026 FINANCIAL RESULTS – August 4, 2026 Our Journey Leadership Product Portfolio Expanding Customer & Partner Ecosystem Data Center and AI Growth Strong Financial Foundation
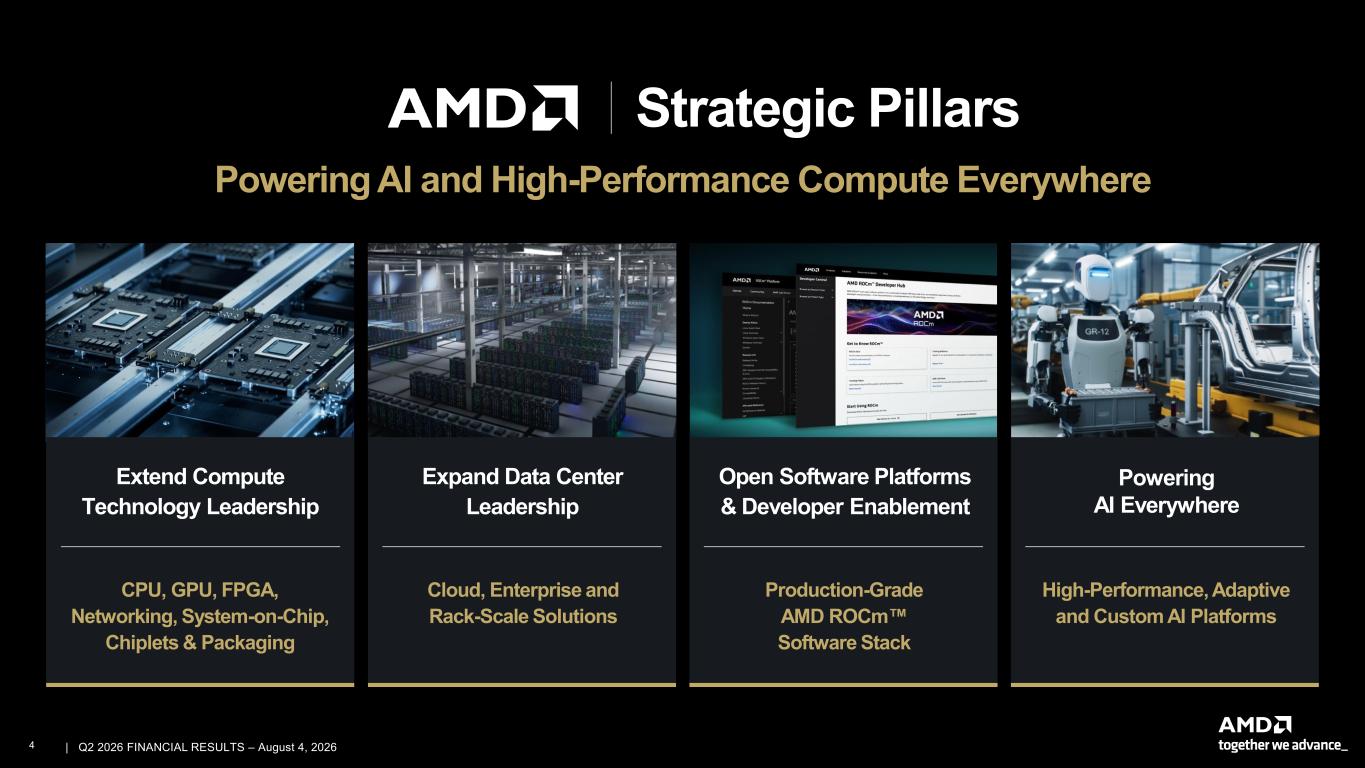
4 | | Q2 2026 FINANCIAL RESULTS – August 4, 2026 Powering AI and High-Performance Compute Everywhere Strategic Pillars High-Performance, Adaptive and Custom AI Platforms Powering AI Everywhere Cloud, Enterprise and Rack-Scale Solutions Expand Data Center Leadership Production-Grade AMD ROCm Software Stack Open Software Platforms & Developer Enablement CPU, GPU, FPGA, Networking, System-on-Chip, Chiplets & Packaging Extend Compute Technology Leadership
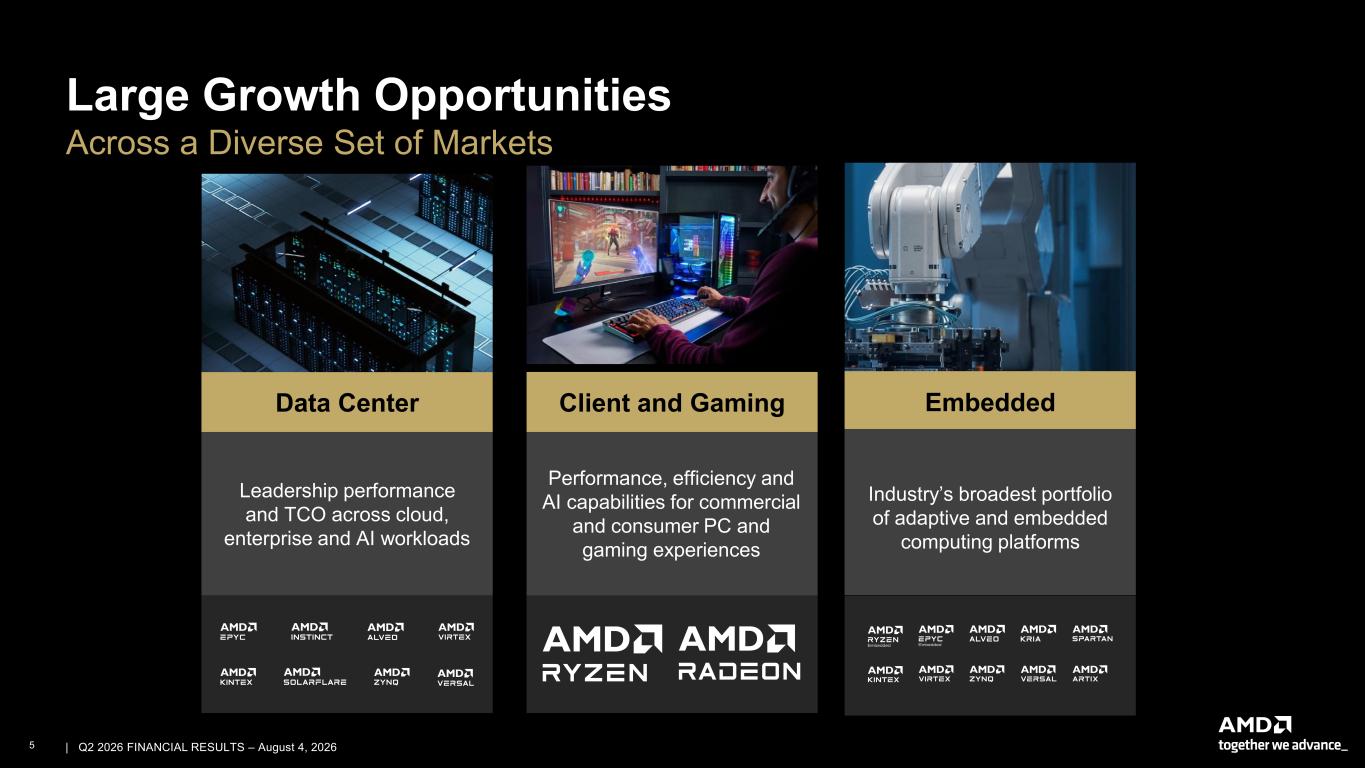
5 | | Q2 2026 FINANCIAL RESULTS – August 4, 2026 Large Growth Opportunities Across a Diverse Set of Markets Embedded Industry’s broadest portfolio of adaptive and embedded computing platforms Data Center Leadership performance and TCO across cloud, enterprise and AI workloads Client and Gaming Performance, efficiency and AI capabilities for commercial and consumer PC and gaming experiences
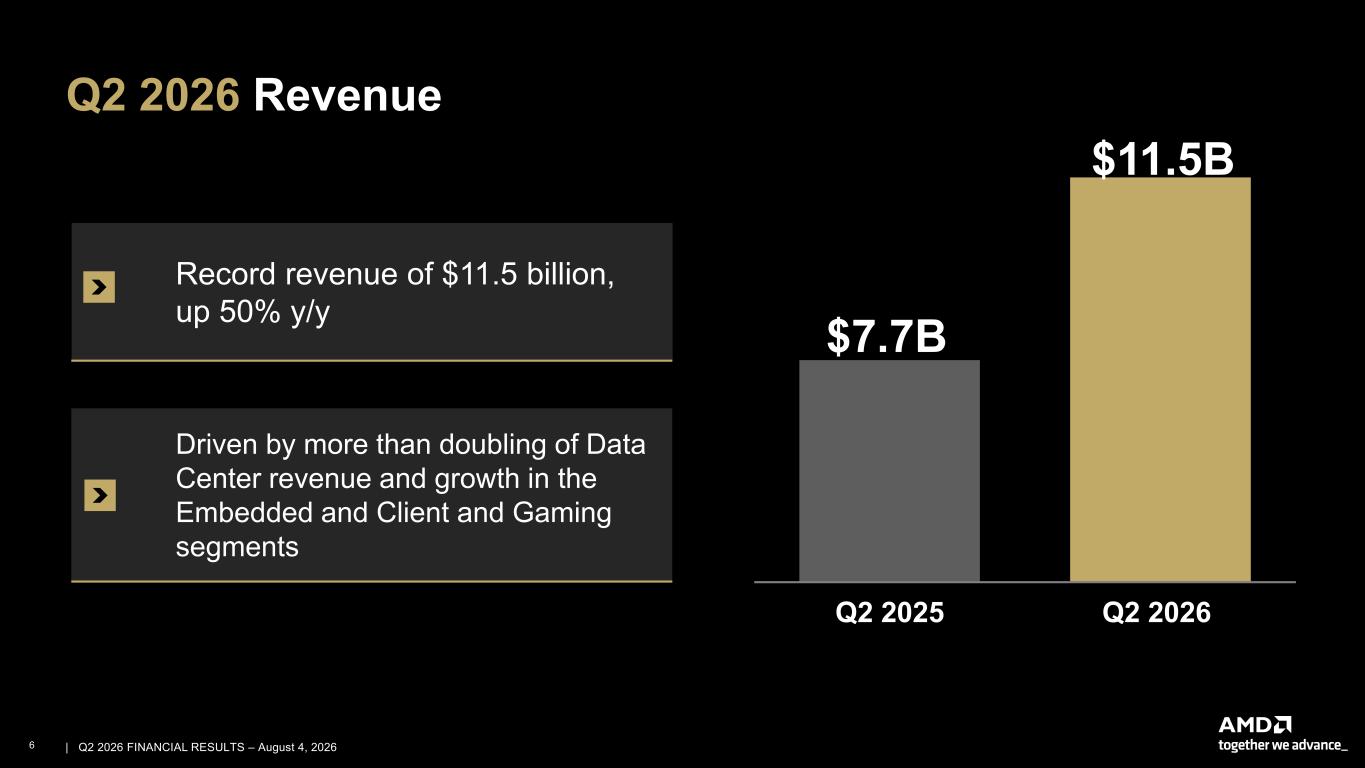
6 | | Q2 2026 FINANCIAL RESULTS – August 4, 2026 Q2 2026 Revenue Record revenue of $11.5 billion, up 50% y/y Driven by more than doubling of Data Center revenue and growth in the Embedded and Client and Gaming segments $7.7B $11.5B Q2 2025 Q2 2026
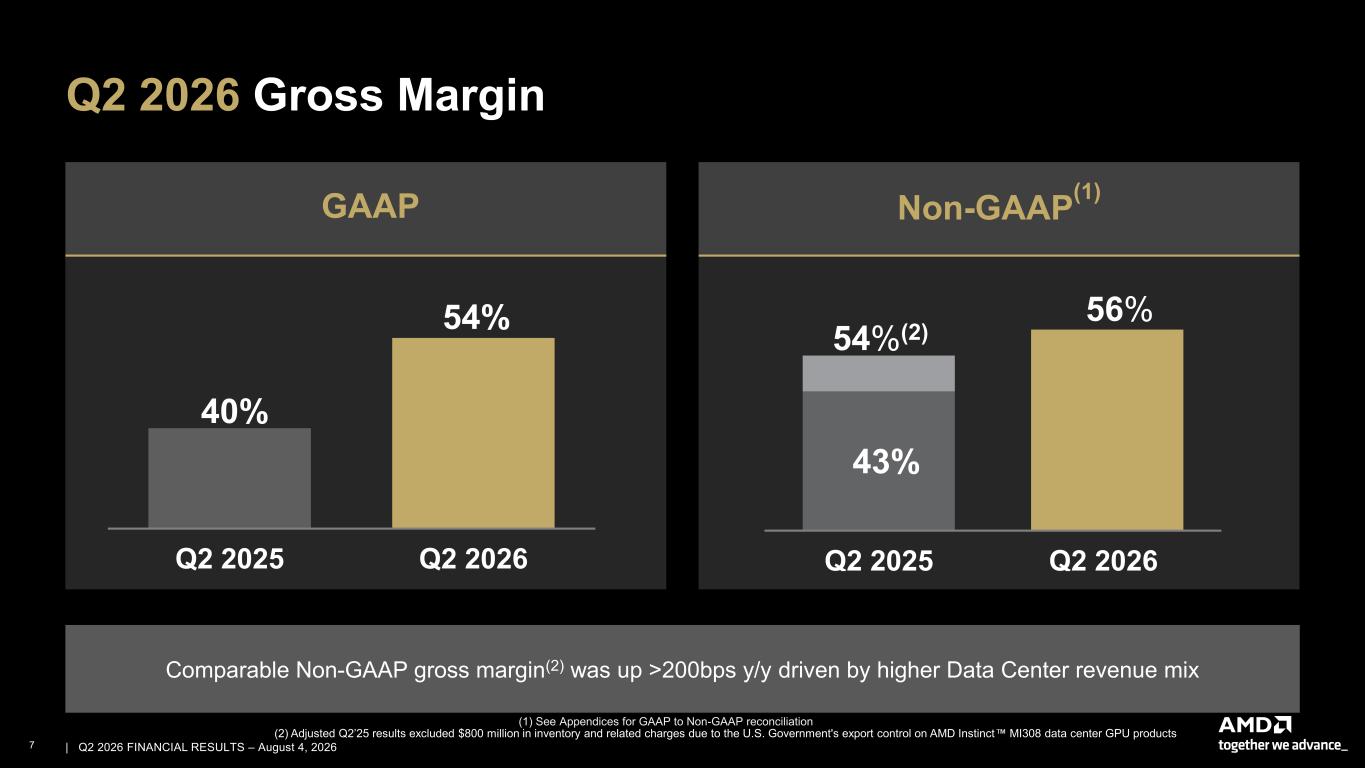
7 | | Q2 2026 FINANCIAL RESULTS – August 4, 2026 Q2 2026 Gross Margin (1) See Appendices for GAAP to Non-GAAP reconciliation GAAP Non-GAAP (1) Comparable Non-GAAP gross margin(2) was up >200bps y/y driven by higher Data Center revenue mix 54% Q2 2025 Q2 2026 43% Q2 2025 Q2 2026 56% 54%(2) (2) Adjusted Q2’25 results excluded $800 million in inventory and related charges due to the U.S. Government's export control on AMD Instinct MI308 data center GPU products 40%
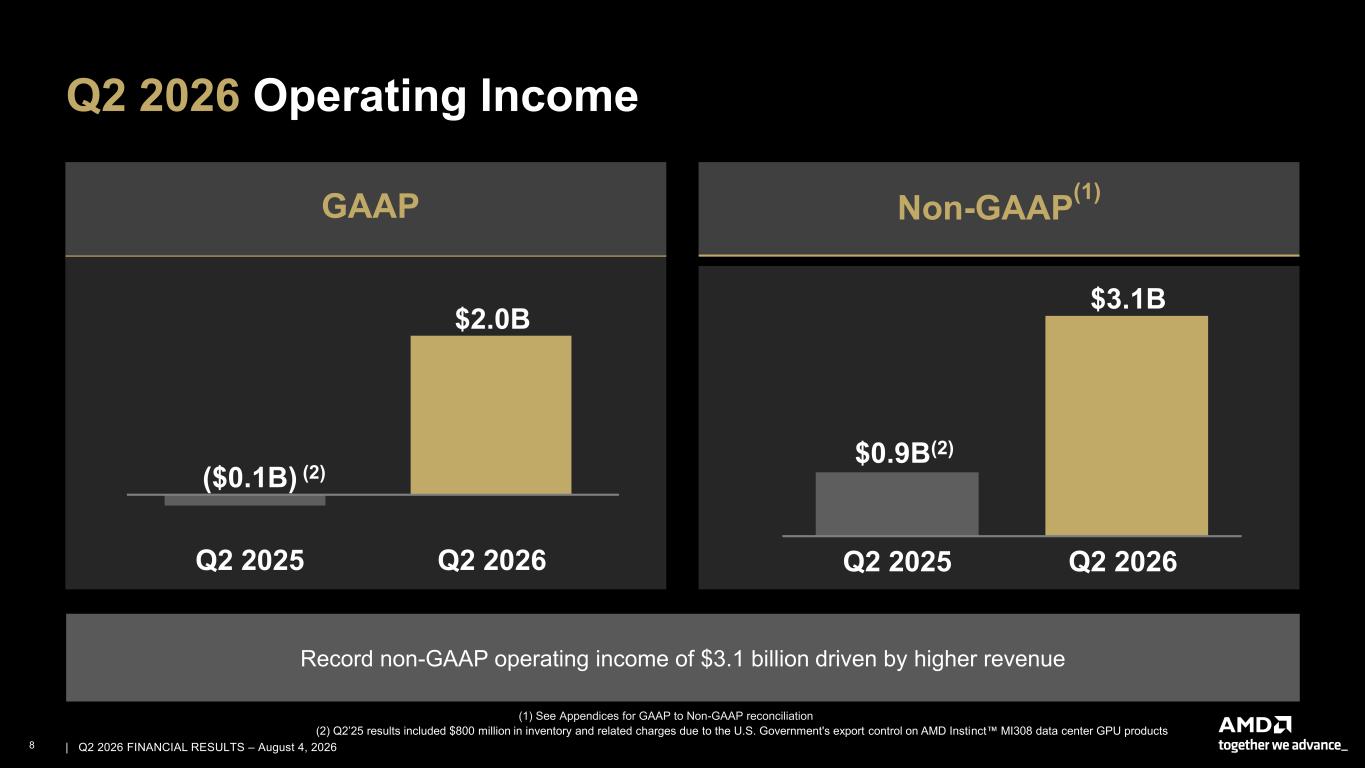
8 | | Q2 2026 FINANCIAL RESULTS – August 4, 2026 Q2 2026 Operating Income Non-GAAP (1) Record non-GAAP operating income of $3.1 billion driven by higher revenue ($0.1B) (2) $2.0B Q2 2025 Q2 2026 (1) See Appendices for GAAP to Non-GAAP reconciliation $0.9B(2) $3.1B Q2 2025 Q2 2026 (2) Q2’25 results included $800 million in inventory and related charges due to the U.S. Government's export control on AMD Instinct MI308 data center GPU products GAAP
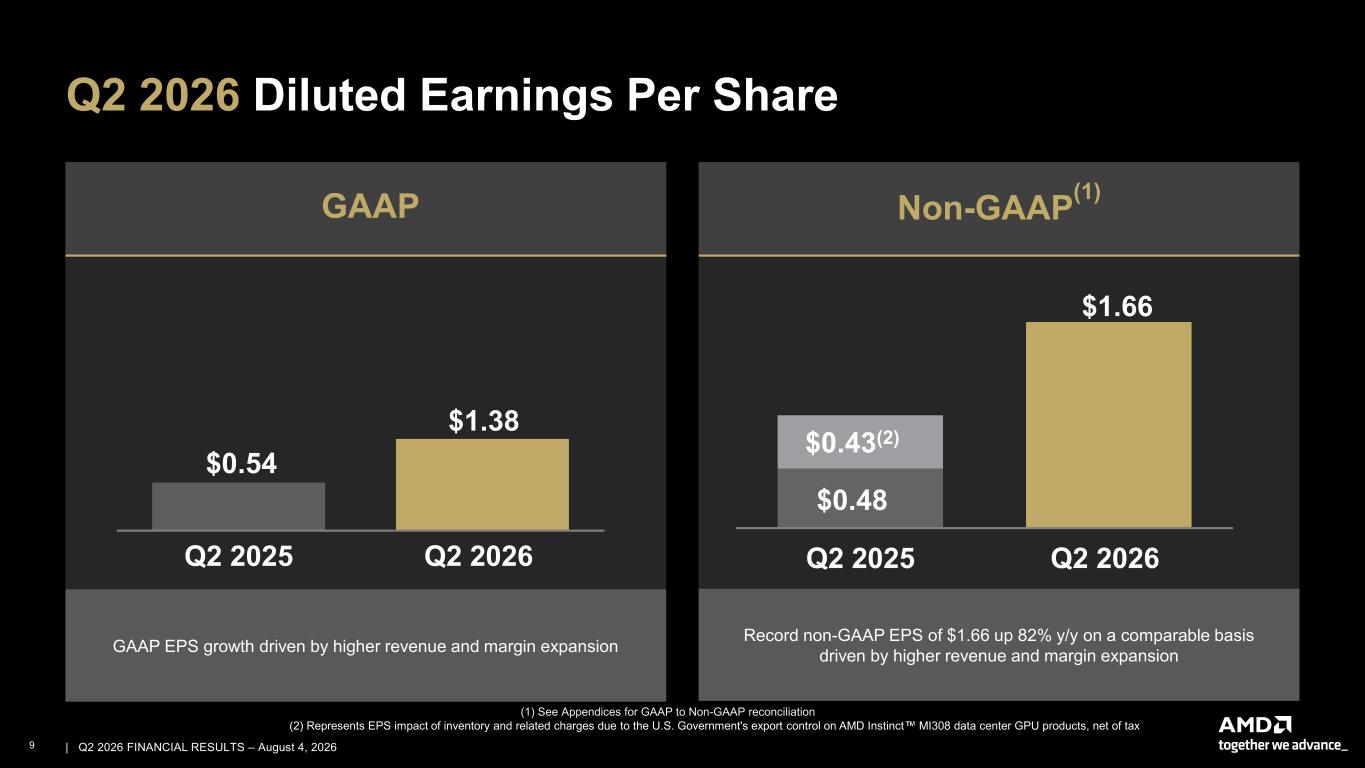
9 | | Q2 2026 FINANCIAL RESULTS – August 4, 2026 GAAP EPS growth driven by higher revenue and margin expansion Q2 2026 Diluted Earnings Per Share GAAP Non-GAAP (1) (1) See Appendices for GAAP to Non-GAAP reconciliation $0.54 $1.38 Q2 2025 Q2 2026 Record non-GAAP EPS of $1.66 up 82% y/y on a comparable basis driven by higher revenue and margin expansion $0.48 $0.43(2) Q2 2025 Q2 2026 $1.66 (2) Represents EPS impact of inventory and related charges due to the U.S. Government's export control on AMD Instinct MI308 data center GPU products, net of tax
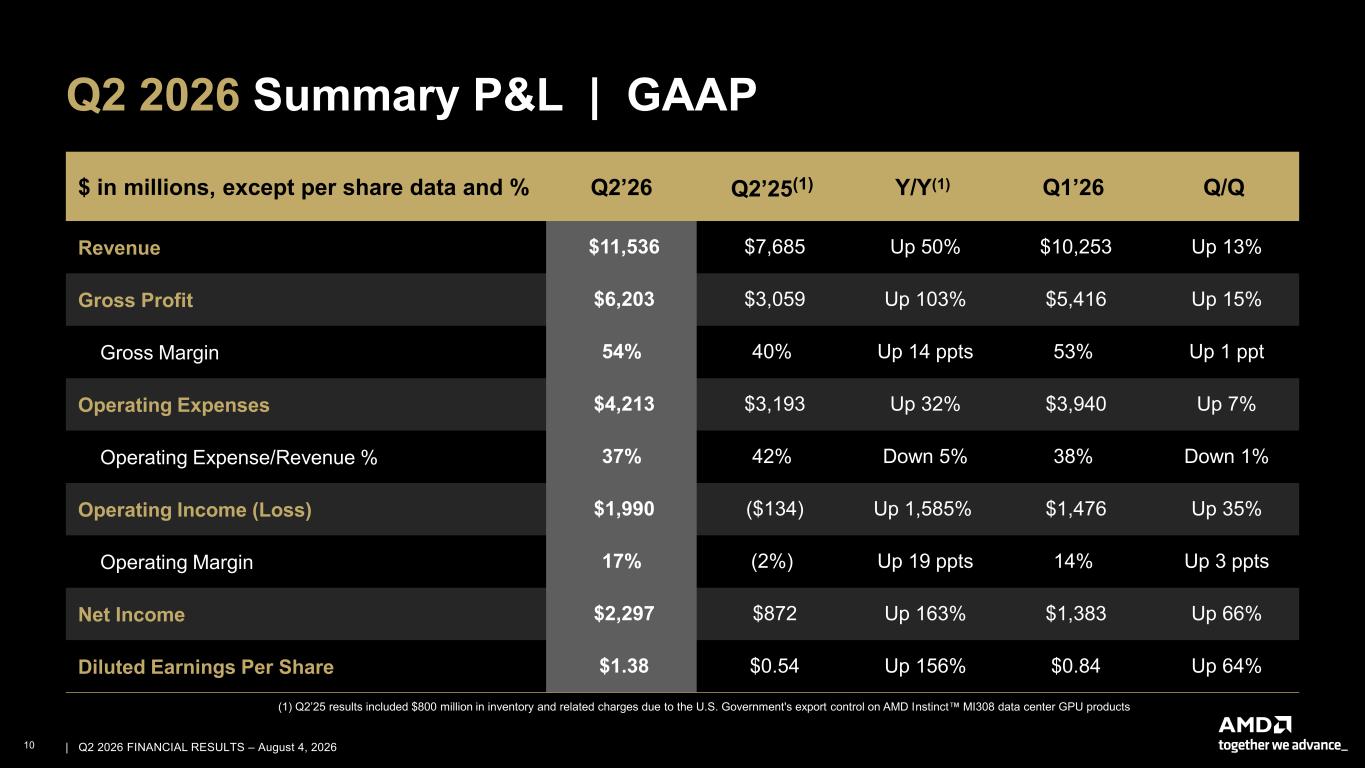
10 | | Q2 2026 FINANCIAL RESULTS – August 4, 2026 Q2 2026 Summary P&L | GAAP $ in millions, except per share data and % Q2’26 Q2’25(1) Y/Y(1) Q1’26 Q/Q Revenue $11,536 $7,685 Up 50% $10,253 Up 13% Gross Profit $6,203 $3,059 Up 103% $5,416 Up 15% Gross Margin 54% 40% Up 14 ppts 53% Up 1 ppt Operating Expenses $4,213 $3,193 Up 32% $3,940 Up 7% Operating Expense/Revenue % 37% 42% Down 5% 38% Down 1% Operating Income (Loss) $1,990 ($134) Up 1,585% $1,476 Up 35% Operating Margin 17% (2%) Up 19 ppts 14% Up 3 ppts Net Income $2,297 $872 Up 163% $1,383 Up 66% Diluted Earnings Per Share $1.38 $0.54 Up 156% $0.84 Up 64% (1) Q2’25 results included $800 million in inventory and related charges due to the U.S. Government's export control on AMD Instinct MI308 data center GPU products
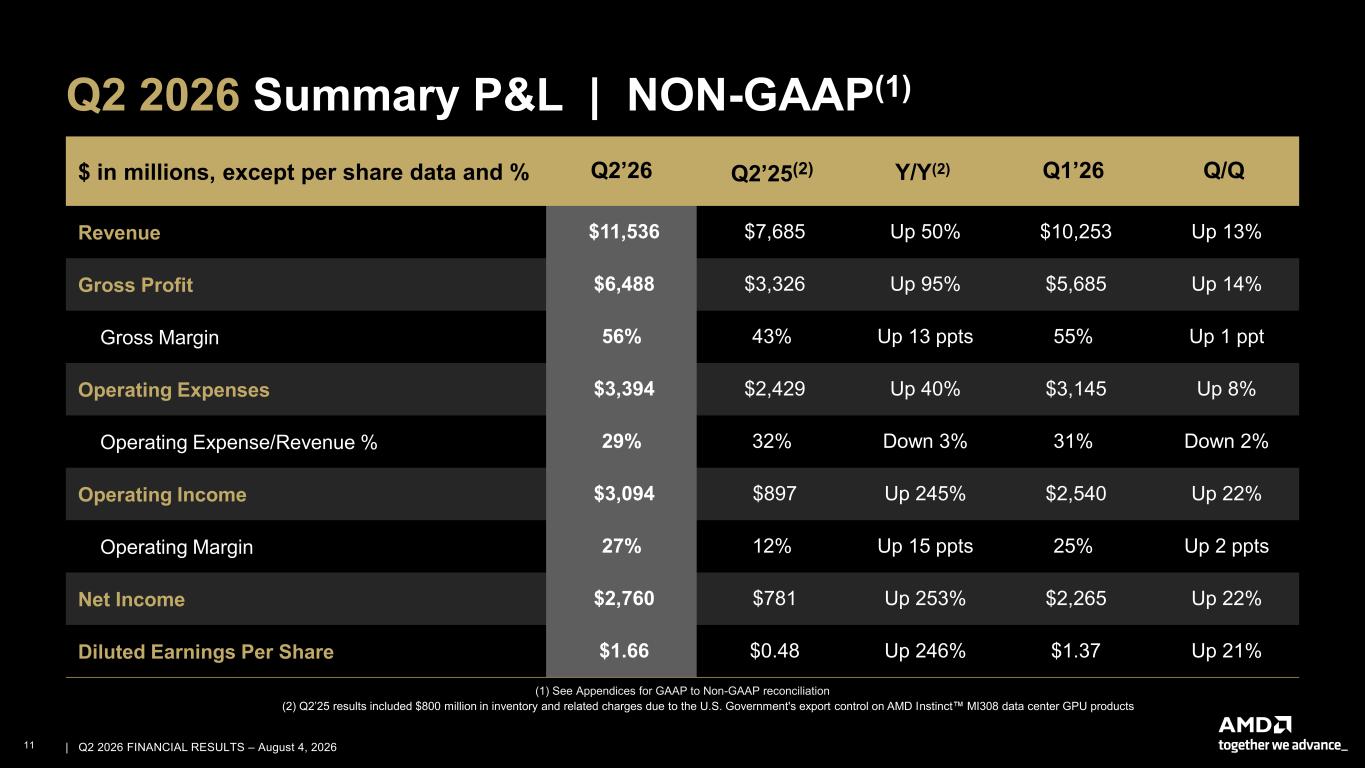
11 | | Q2 2026 FINANCIAL RESULTS – August 4, 2026 Q2 2026 Summary P&L | NON-GAAP(1) $ in millions, except per share data and % Q2’26 Q2’25(2) Y/Y(2) Q1’26 Q/Q Revenue $11,536 $7,685 Up 50% $10,253 Up 13% Gross Profit $6,488 $3,326 Up 95% $5,685 Up 14% Gross Margin 56% 43% Up 13 ppts 55% Up 1 ppt Operating Expenses $3,394 $2,429 Up 40% $3,145 Up 8% Operating Expense/Revenue % 29% 32% Down 3% 31% Down 2% Operating Income $3,094 $897 Up 245% $2,540 Up 22% Operating Margin 27% 12% Up 15 ppts 25% Up 2 ppts Net Income $2,760 $781 Up 253% $2,265 Up 22% Diluted Earnings Per Share $1.66 $0.48 Up 246% $1.37 Up 21% (1) See Appendices for GAAP to Non-GAAP reconciliation (2) Q2’25 results included $800 million in inventory and related charges due to the U.S. Government's export control on AMD Instinct MI308 data center GPU products
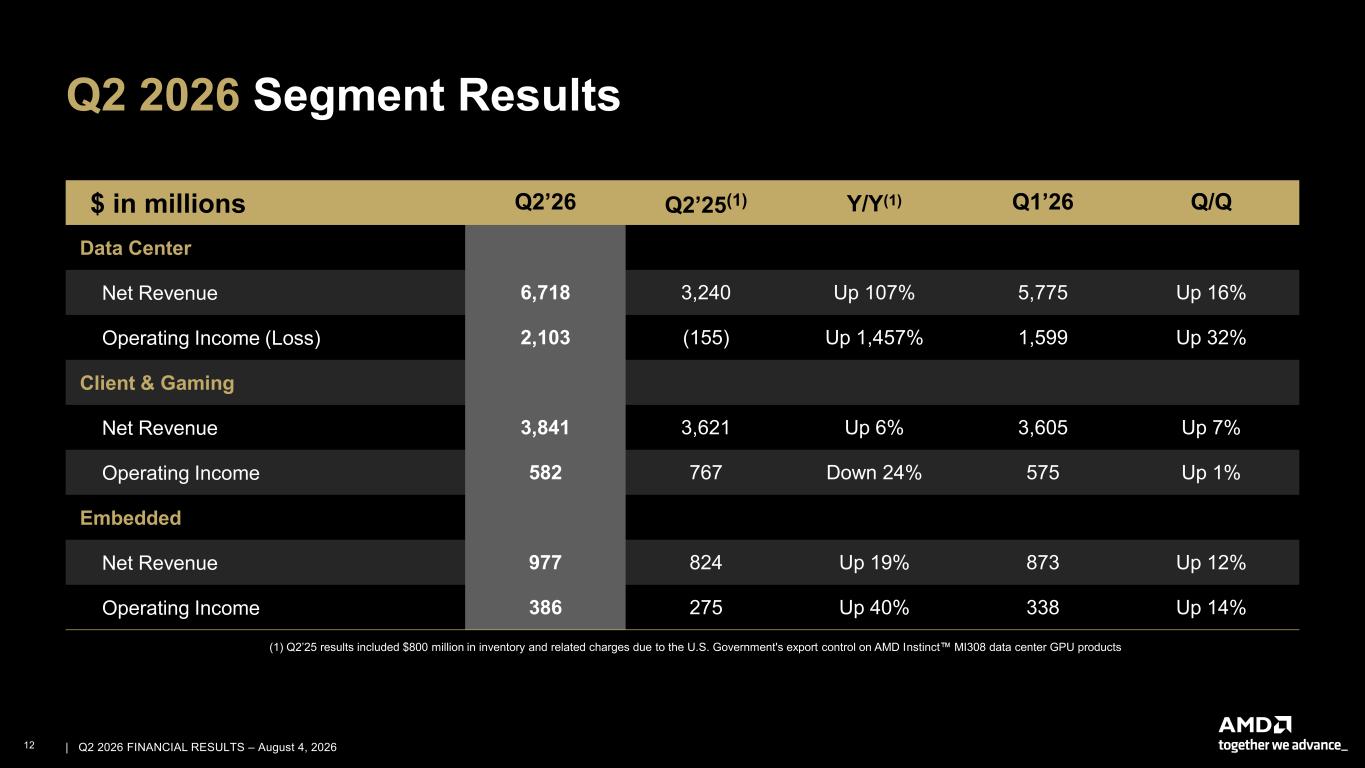
12 | | Q2 2026 FINANCIAL RESULTS – August 4, 2026 Q2 2026 Segment Results $ in millions Q2’26 Q2’25(1) Y/Y(1) Q1’26 Q/Q Data Center Net Revenue 6,718 3,240 Up 107% 5,775 Up 16% Operating Income (Loss) 2,103 (155) Up 1,457% 1,599 Up 32% Client & Gaming Net Revenue 3,841 3,621 Up 6% 3,605 Up 7% Operating Income 582 767 Down 24% 575 Up 1% Embedded Net Revenue 977 824 Up 19% 873 Up 12% Operating Income 386 275 Up 40% 338 Up 14% (1) Q2’25 results included $800 million in inventory and related charges due to the U.S. Government's export control on AMD Instinct MI308 data center GPU products
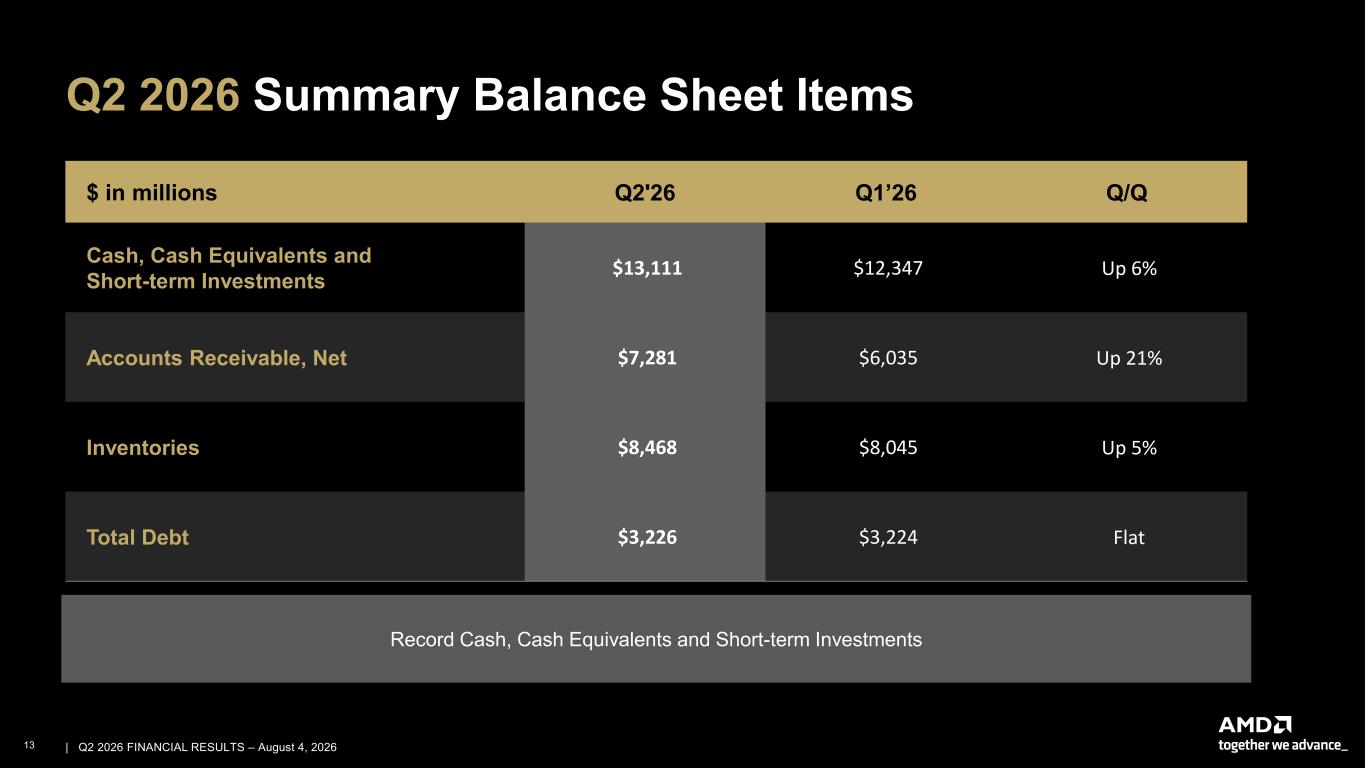
13 | | Q2 2026 FINANCIAL RESULTS – August 4, 2026 $ in millions Q2'26 Q1’26 Q/Q Cash, Cash Equivalents and Short-term Investments $13,111 $12,347 Up 6% Accounts Receivable, Net $7,281 $6,035 Up 21% Inventories $8,468 $8,045 Up 5% Total Debt $3,226 $3,224 Flat Q2 2026 Summary Balance Sheet Items Record Cash, Cash Equivalents and Short-term Investments
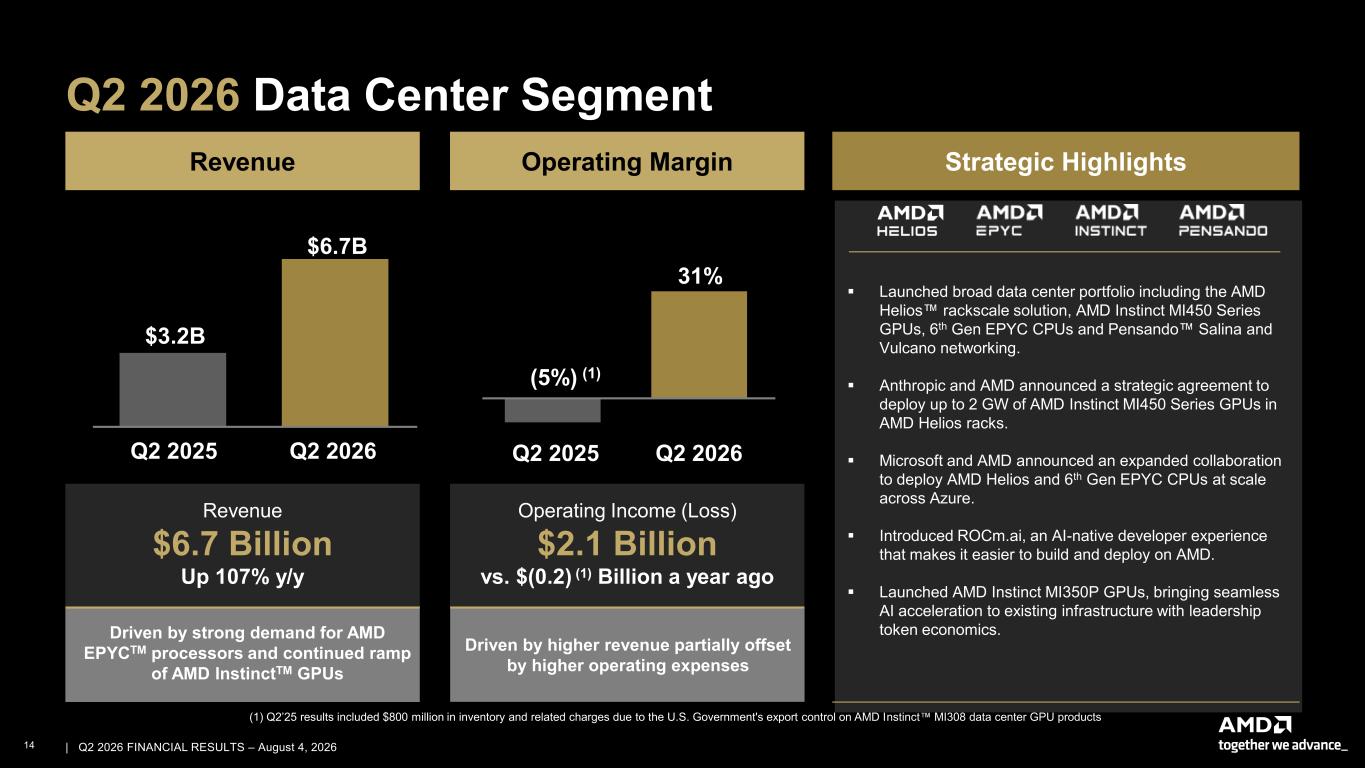
14 | | Q2 2026 FINANCIAL RESULTS – August 4, 2026 Driven by strong demand for AMD EPYCTM processors and continued ramp of AMD InstinctTM GPUs Strategic Highlights Q2 2026 Data Center Segment Revenue $3.2B $6.7B Q2 2025 Q2 2026 Revenue $6.7 Billion Up 107% y/y Operating Margin Driven by higher revenue partially offset by higher operating expenses Operating Income (Loss) $2.1 Billion vs. $(0.2) (1) Billion a year ago (5%) (1) 31% Q2 2025 Q2 2026 ▪ Launched broad data center portfolio including the AMD Helios rackscale solution, AMD Instinct MI450 Series GPUs, 6th Gen EPYC CPUs and Pensando Salina and Vulcano networking. ▪ Anthropic and AMD announced a strategic agreement to deploy up to 2 GW of AMD Instinct MI450 Series GPUs in AMD Helios racks. ▪ Microsoft and AMD announced an expanded collaboration to deploy AMD Helios and 6th Gen EPYC CPUs at scale across Azure. ▪ Introduced ROCm.ai, an AI-native developer experience that makes it easier to build and deploy on AMD. ▪ Launched AMD Instinct MI350P GPUs, bringing seamless AI acceleration to existing infrastructure with leadership token economics. (1) Q2’25 results included $800 million in inventory and related charges due to the U.S. Government's export control on AMD Instinct MI308 data center GPU products
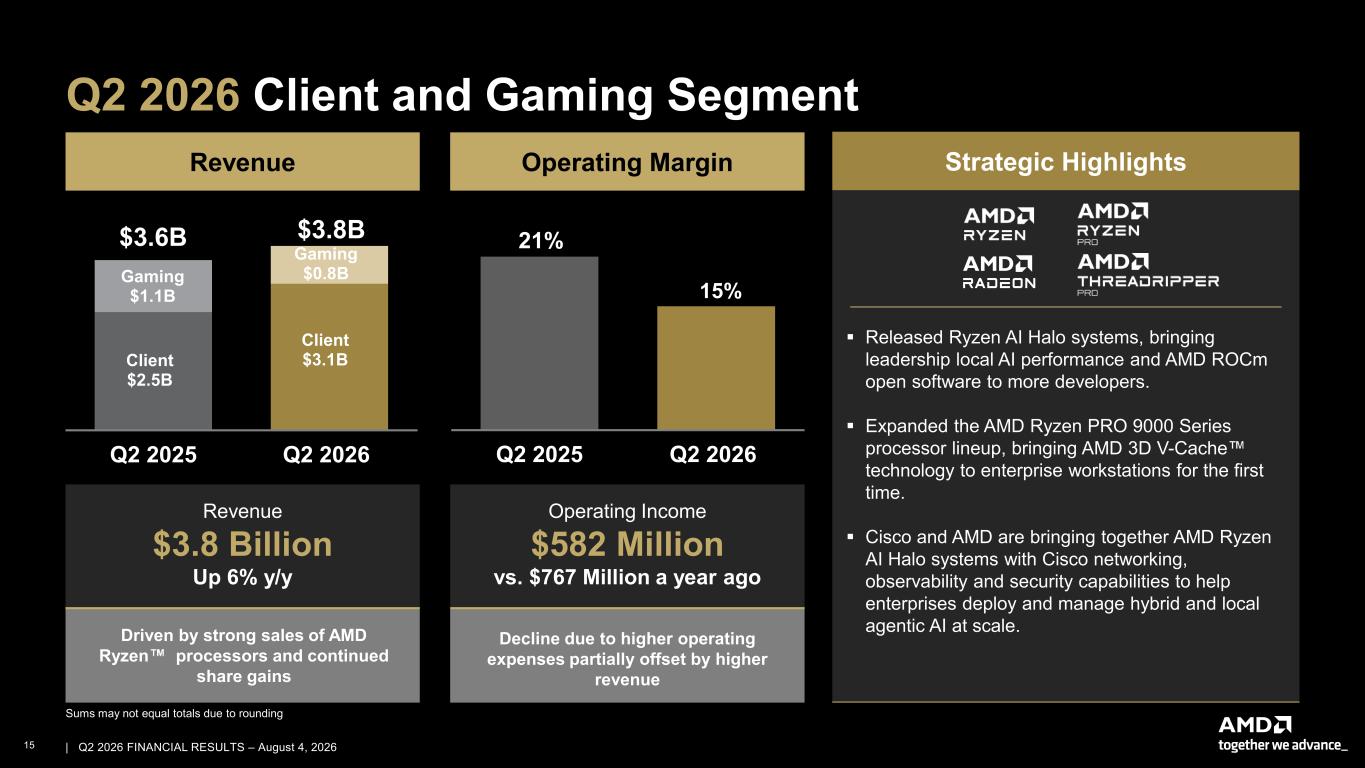
15 | | Q2 2026 FINANCIAL RESULTS – August 4, 2026 Q2 2026 Client and Gaming Segment 21% 15% Q2 2025 Q2 2026 Revenue Operating Margin Decline due to higher operating expenses partially offset by higher revenue Revenue $3.8 Billion Up 6% y/y Operating Income $582 Million vs. $767 Million a year ago Strategic Highlights Client $2.5B Client $3.1B Gaming $1.1B Gaming $0.8B Q2 2025 Q2 2026 $3.6B $3.8B Driven by strong sales of AMD Ryzen processors and continued share gains ▪ Released Ryzen AI Halo systems, bringing leadership local AI performance and AMD ROCm open software to more developers. ▪ Expanded the AMD Ryzen PRO 9000 Series processor lineup, bringing AMD 3D V-Cache technology to enterprise workstations for the first time. ▪ Cisco and AMD are bringing together AMD Ryzen AI Halo systems with Cisco networking, observability and security capabilities to help enterprises deploy and manage hybrid and local agentic AI at scale. Sums may not equal totals due to rounding
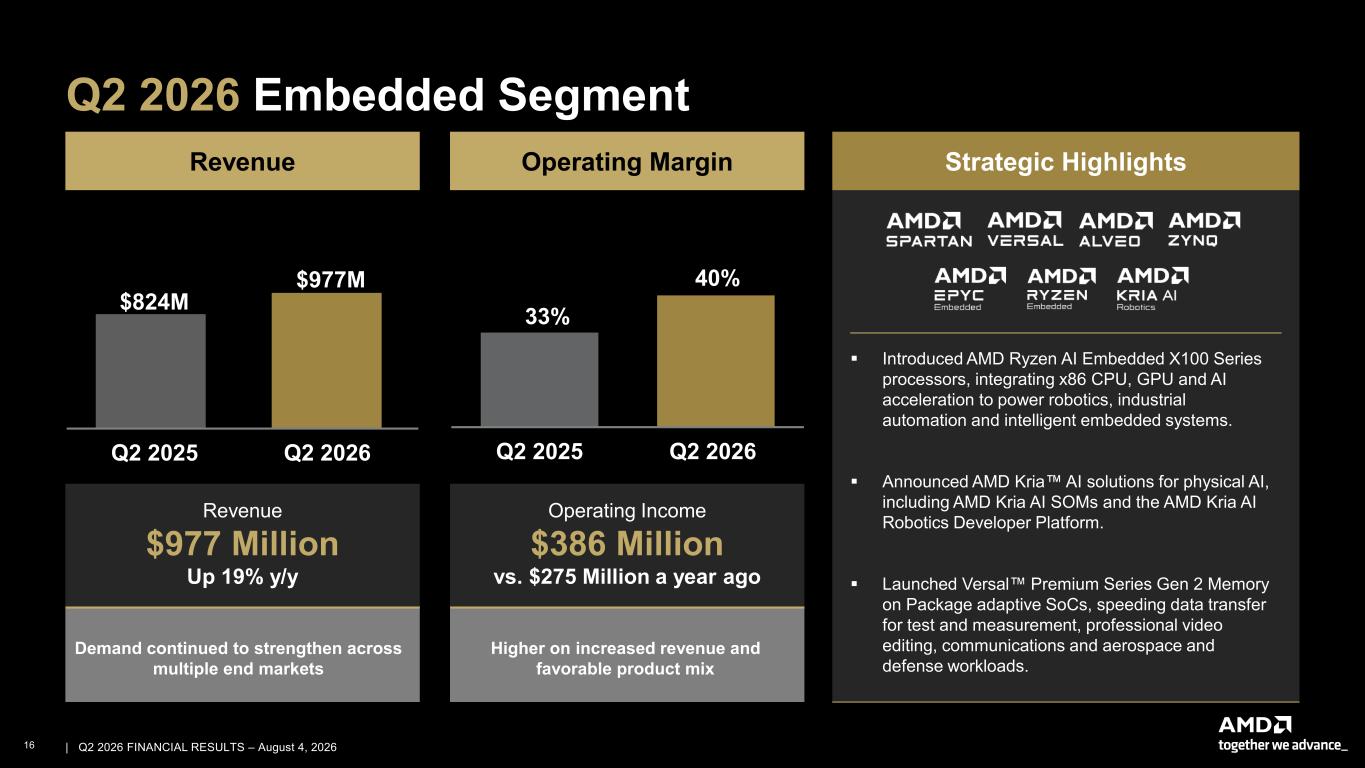
16 | | Q2 2026 FINANCIAL RESULTS – August 4, 2026 Q2 2026 Embedded Segment Revenue Demand continued to strengthen across multiple end markets Operating Margin Higher on increased revenue and favorable product mix $977M Q2 2025 Q2 2026 $824M 33% 40% Q2 2025 Q2 2026 Revenue $977 Million Up 19% y/y Operating Income $386 Million vs. $275 Million a year ago Strategic Highlights ▪ Introduced AMD Ryzen AI Embedded X100 Series processors, integrating x86 CPU, GPU and AI acceleration to power robotics, industrial automation and intelligent embedded systems. ▪ Announced AMD Kria AI solutions for physical AI, including AMD Kria AI SOMs and the AMD Kria AI Robotics Developer Platform. ▪ Launched Versal Premium Series Gen 2 Memory on Package adaptive SoCs, speeding data transfer for test and measurement, professional video editing, communications and aerospace and defense workloads.
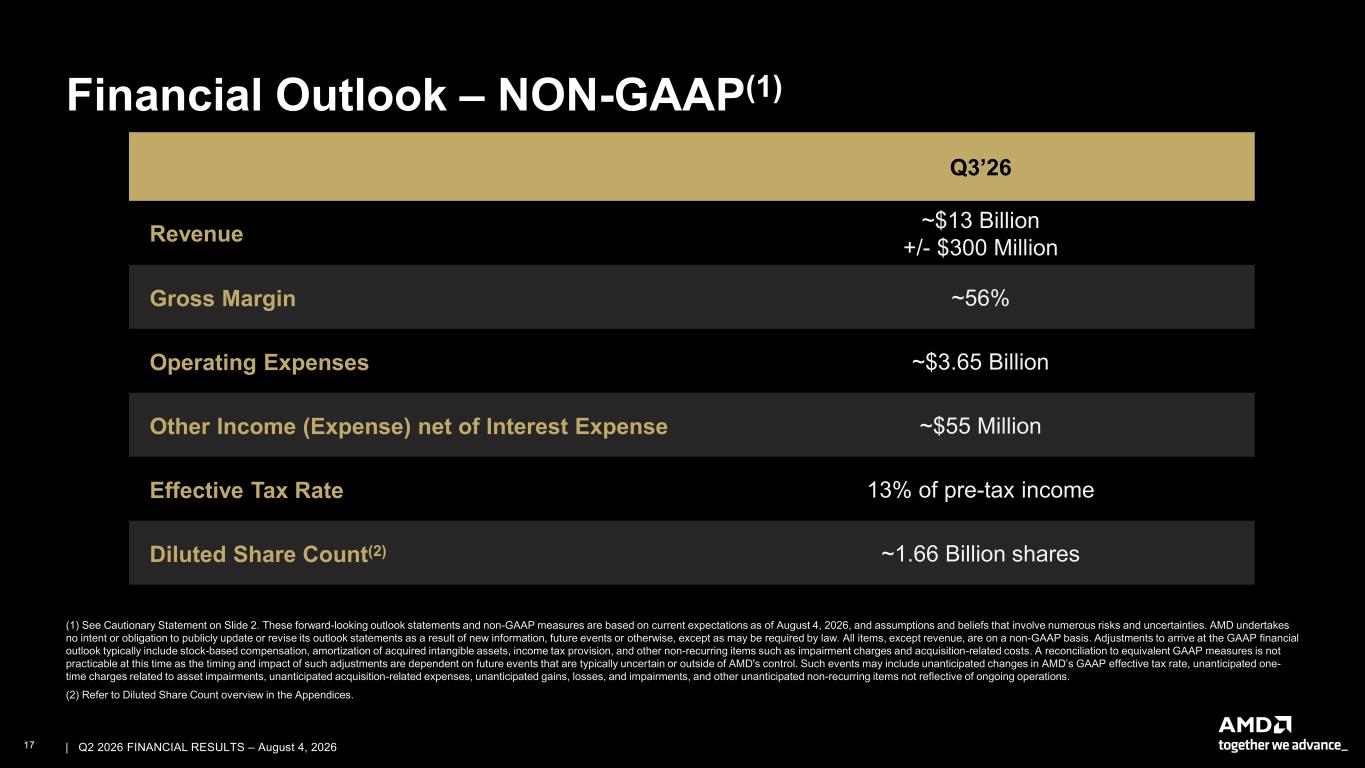
17 | | Q2 2026 FINANCIAL RESULTS – August 4, 2026 Financial Outlook – NON-GAAP(1) (1) See Cautionary Statement on Slide 2. These forward-looking outlook statements and non-GAAP measures are based on current expectations as of August 4, 2026, and assumptions and beliefs that involve numerous risks and uncertainties. AMD undertakes no intent or obligation to publicly update or revise its outlook statements as a result of new information, future events or otherwise, except as may be required by law. All items, except revenue, are on a non-GAAP basis. Adjustments to arrive at the GAAP financial outlook typically include stock-based compensation, amortization of acquired intangible assets, income tax provision, and other non-recurring items such as impairment charges and acquisition-related costs. A reconciliation to equivalent GAAP measures is not practicable at this time as the timing and impact of such adjustments are dependent on future events that are typically uncertain or outside of AMD's control. Such events may include unanticipated changes in AMD’s GAAP effective tax rate, unanticipated one- time charges related to asset impairments, unanticipated acquisition-related expenses, unanticipated gains, losses, and impairments, and other unanticipated non-recurring items not reflective of ongoing operations. (2) Refer to Diluted Share Count overview in the Appendices. Q3’26 Revenue ~$13 Billion +/- $300 Million Gross Margin ~56% Operating Expenses ~$3.65 Billion Other Income (Expense) net of Interest Expense ~$55 Million Effective Tax Rate 13% of pre-tax income Diluted Share Count(2) ~1.66 Billion shares
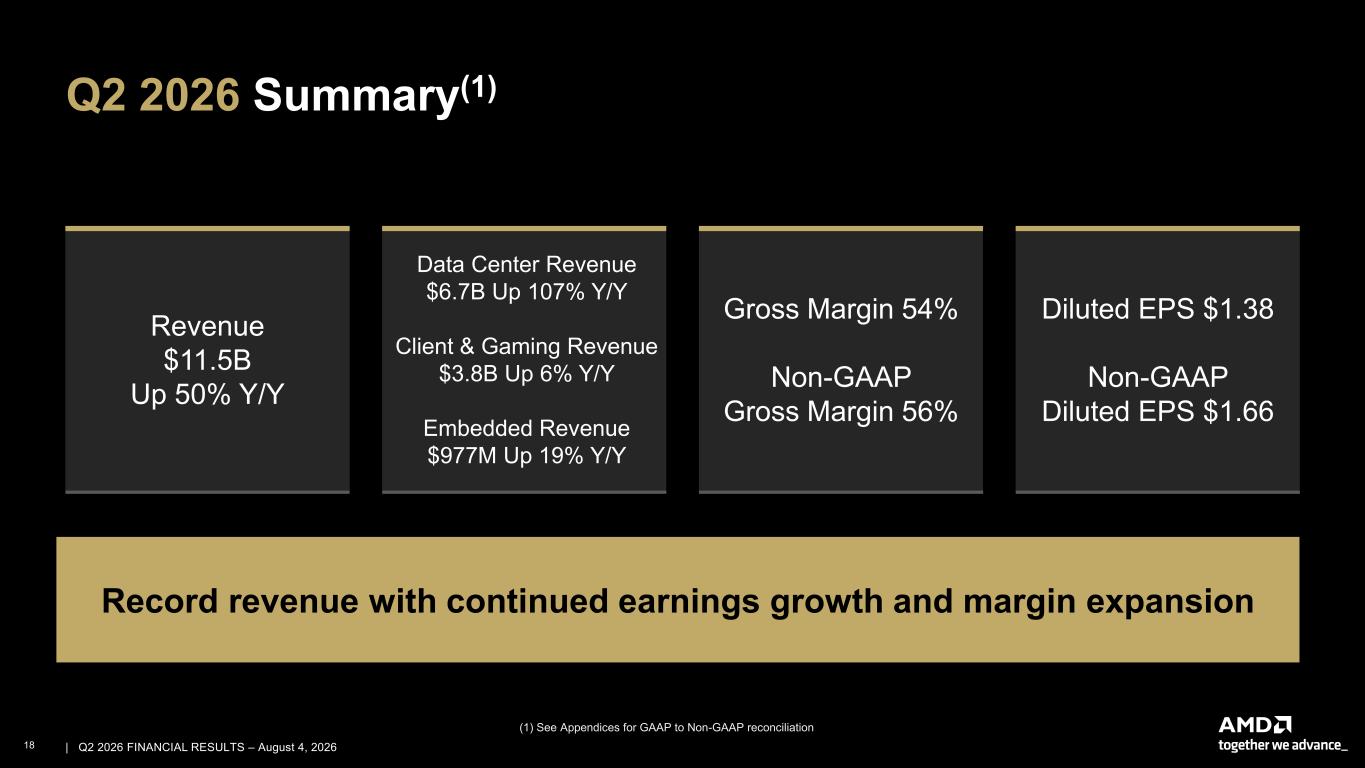
18 | | Q2 2026 FINANCIAL RESULTS – August 4, 2026 Q2 2026 Summary(1) (1) See Appendices for GAAP to Non-GAAP reconciliation Record revenue with continued earnings growth and margin expansion Revenue $11.5B Up 50% Y/Y Gross Margin 54% Non-GAAP Gross Margin 56% Data Center Revenue $6.7B Up 107% Y/Y Client & Gaming Revenue $3.8B Up 6% Y/Y Embedded Revenue $977M Up 19% Y/Y Diluted EPS $1.38 Non-GAAP Diluted EPS $1.66
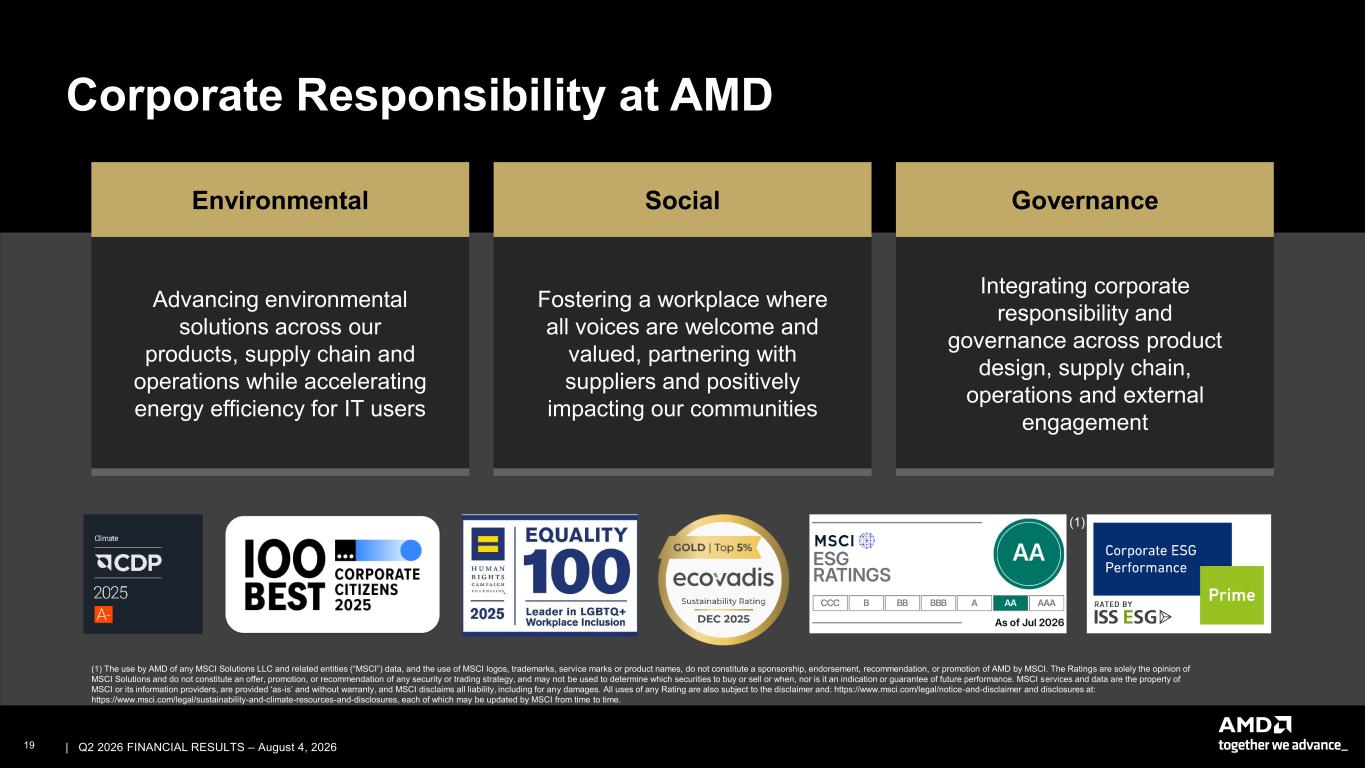
19 | | Q2 2026 FINANCIAL RESULTS – August 4, 2026 Corporate Responsibility at AMD Environmental Advancing environmental solutions across our products, supply chain and operations while accelerating energy efficiency for IT users Social Fostering a workplace where all voices are welcome and valued, partnering with suppliers and positively impacting our communities Governance Integrating corporate responsibility and governance across product design, supply chain, operations and external engagement (1) The use by AMD of any MSCI Solutions LLC and related entities (“MSCI”) data, and the use of MSCI logos, trademarks, service marks or product names, do not constitute a sponsorship, endorsement, recommendation, or promotion of AMD by MSCI. The Ratings are solely the opinion of MSCI Solutions and do not constitute an offer, promotion, or recommendation of any security or trading strategy, and may not be used to determine which securities to buy or sell or when, nor is it an indication or guarantee of future performance. MSCI services and data are the property of MSCI or its information providers, are provided ‘as-is’ and without warranty, and MSCI disclaims all liability, including for any damages. All uses of any Rating are also subject to the disclaimer and: https://www.msci.com/legal/notice-and-disclaimer and disclosures at: https://www.msci.com/legal/sustainability-and-climate-resources-and-disclosures, each of which may be updated by MSCI from time to time. (1)
20 | | Q2 2026 FINANCIAL RESULTS – August 4, 2026 Our Momentum Driving Long-term Shareholder Returns Large and Compelling TAM Expanding Data Center and AI Leadership World-Class Execution and Focus Strong Balance Sheet Technology Leadership
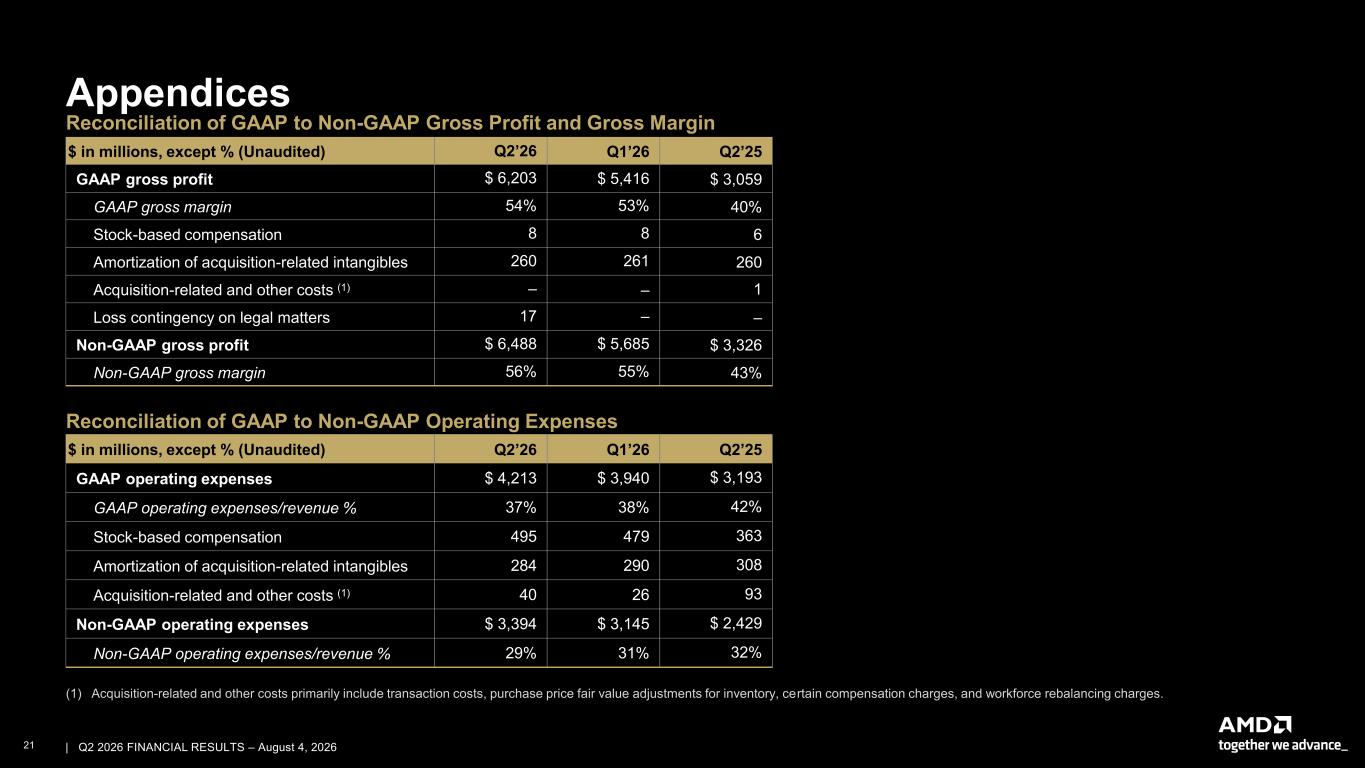
21 | | Q2 2026 FINANCIAL RESULTS – August 4, 2026 Appendices (1) Acquisition-related and other costs primarily include transaction costs, purchase price fair value adjustments for inventory, certain compensation charges, and workforce rebalancing charges. Reconciliation of GAAP to Non-GAAP Gross Profit and Gross Margin Reconciliation of GAAP to Non-GAAP Operating Expenses $ in millions, except % (Unaudited) Q2’26 Q1’26 Q2’25 GAAP operating expenses $ 4,213 $ 3,940 $ 3,193 GAAP operating expenses/revenue % 37% 38% 42% Stock-based compensation 495 479 363 Amortization of acquisition-related intangibles 284 290 308 Acquisition-related and other costs (1) 40 26 93 Non-GAAP operating expenses $ 3,394 $ 3,145 $ 2,429 Non-GAAP operating expenses/revenue % 29% 31% 32% $ in millions, except % (Unaudited) Q2’26 Q1’26 Q2’25 GAAP gross profit $ 6,203 $ 5,416 $ 3,059 GAAP gross margin 54% 53% 40% Stock-based compensation 8 8 6 Amortization of acquisition-related intangibles 260 261 260 Acquisition-related and other costs (1) – – 1 Loss contingency on legal matters 17 – – Non-GAAP gross profit $ 6,488 $ 5,685 $ 3,326 Non-GAAP gross margin 56% 55% 43%
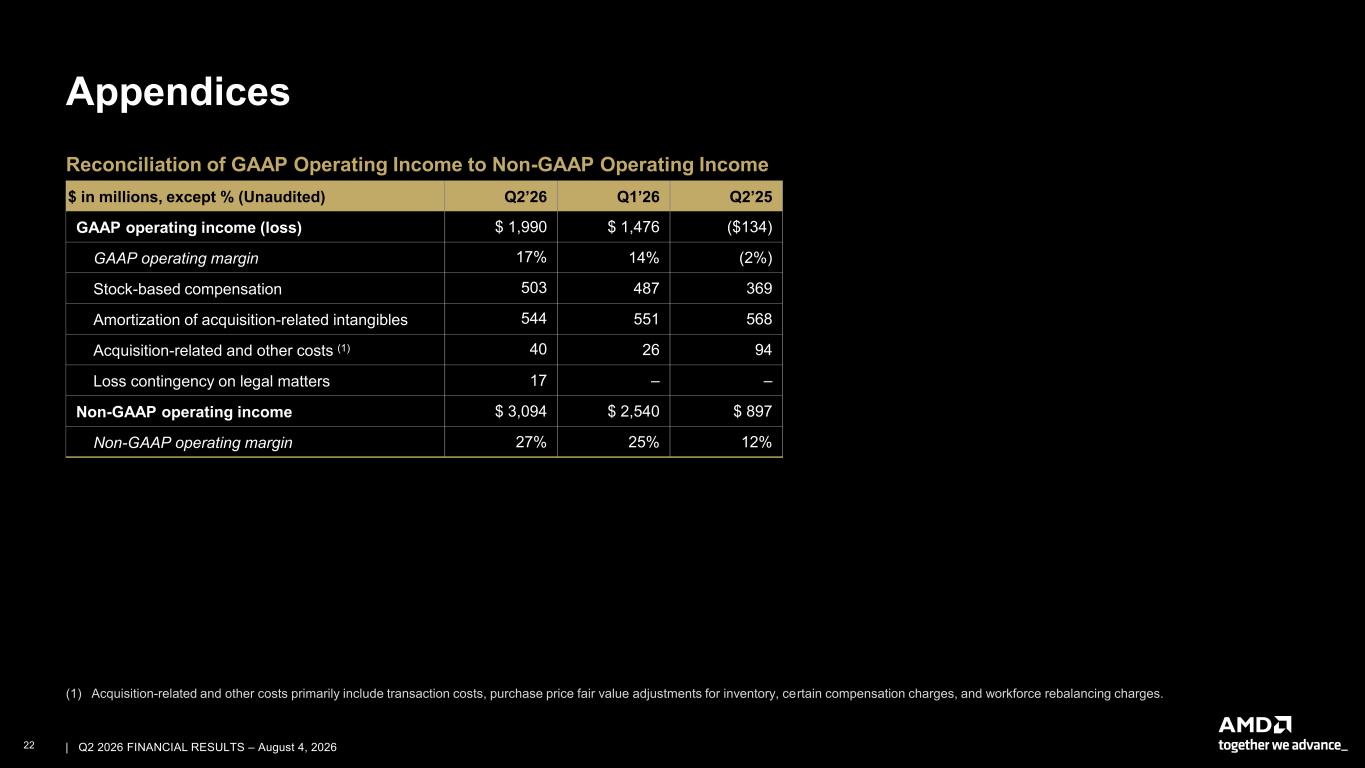
22 | | Q2 2026 FINANCIAL RESULTS – August 4, 2026 Appendices Reconciliation of GAAP Operating Income to Non-GAAP Operating Income $ in millions, except % (Unaudited) Q2’26 Q1’26 Q2’25 GAAP operating income (loss) $ 1,990 $ 1,476 ($134) GAAP operating margin 17% 14% (2%) Stock-based compensation 503 487 369 Amortization of acquisition-related intangibles 544 551 568 Acquisition-related and other costs (1) 40 26 94 Loss contingency on legal matters 17 – – Non-GAAP operating income $ 3,094 $ 2,540 $ 897 Non-GAAP operating margin 27% 25% 12% (1) Acquisition-related and other costs primarily include transaction costs, purchase price fair value adjustments for inventory, certain compensation charges, and workforce rebalancing charges.
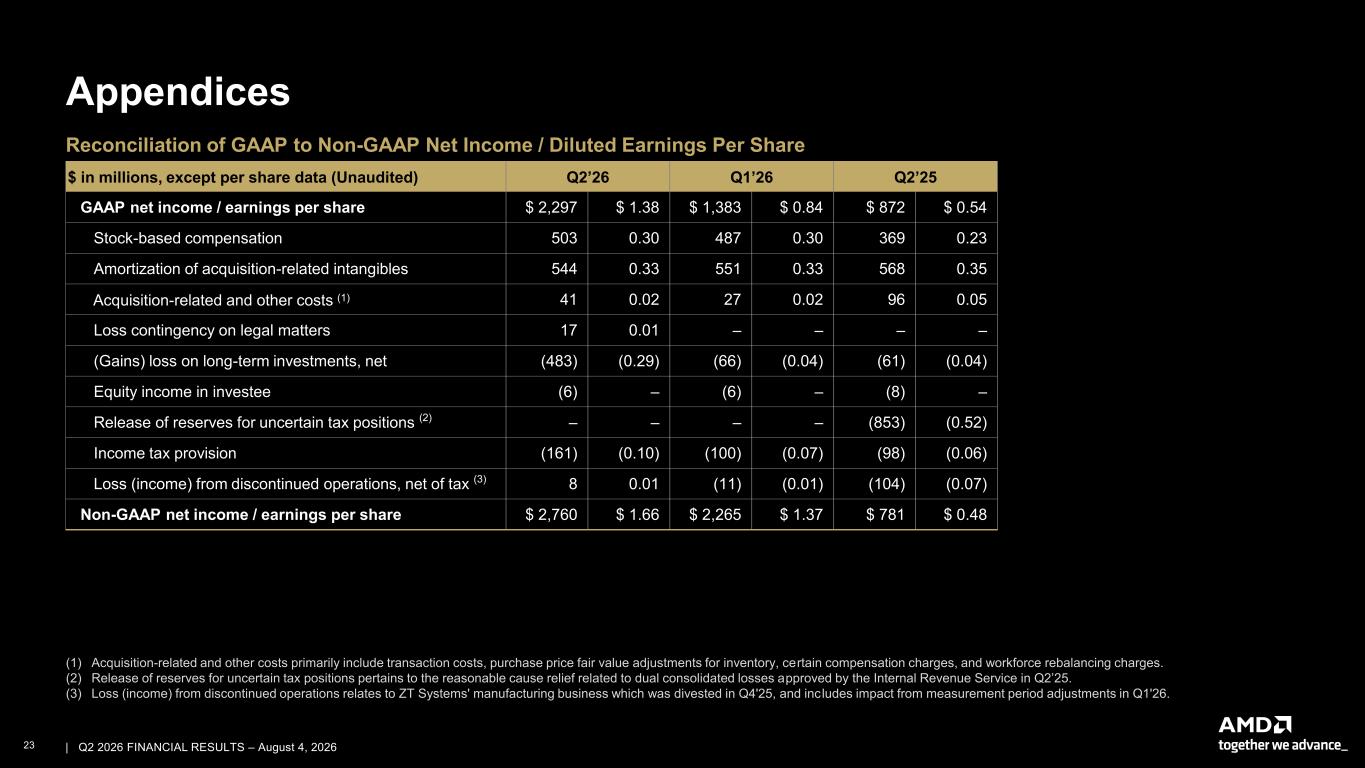
23 | | Q2 2026 FINANCIAL RESULTS – August 4, 2026 Appendices Reconciliation of GAAP to Non-GAAP Net Income / Diluted Earnings Per Share (1) Acquisition-related and other costs primarily include transaction costs, purchase price fair value adjustments for inventory, certain compensation charges, and workforce rebalancing charges. (2) Release of reserves for uncertain tax positions pertains to the reasonable cause relief related to dual consolidated losses approved by the Internal Revenue Service in Q2’25. (3) Loss (income) from discontinued operations relates to ZT Systems' manufacturing business which was divested in Q4'25, and includes impact from measurement period adjustments in Q1'26. $ in millions, except per share data (Unaudited) Q2’26 Q1’26 Q2’25 GAAP net income / earnings per share $ 2,297 $ 1.38 $ 1,383 $ 0.84 $ 872 $ 0.54 Stock-based compensation 503 0.30 487 0.30 369 0.23 Amortization of acquisition-related intangibles 544 0.33 551 0.33 568 0.35 Acquisition-related and other costs (1) 41 0.02 27 0.02 96 0.05 Loss contingency on legal matters 17 0.01 – – – – (Gains) loss on long-term investments, net (483) (0.29) (66) (0.04) (61) (0.04) Equity income in investee (6) – (6) – (8) – Release of reserves for uncertain tax positions (2) – – – – (853) (0.52) Income tax provision (161) (0.10) (100) (0.07) (98) (0.06) Loss (income) from discontinued operations, net of tax (3) 8 0.01 (11) (0.01) (104) (0.07) Non-GAAP net income / earnings per share $ 2,760 $ 1.66 $ 2,265 $ 1.37 $ 781 $ 0.48
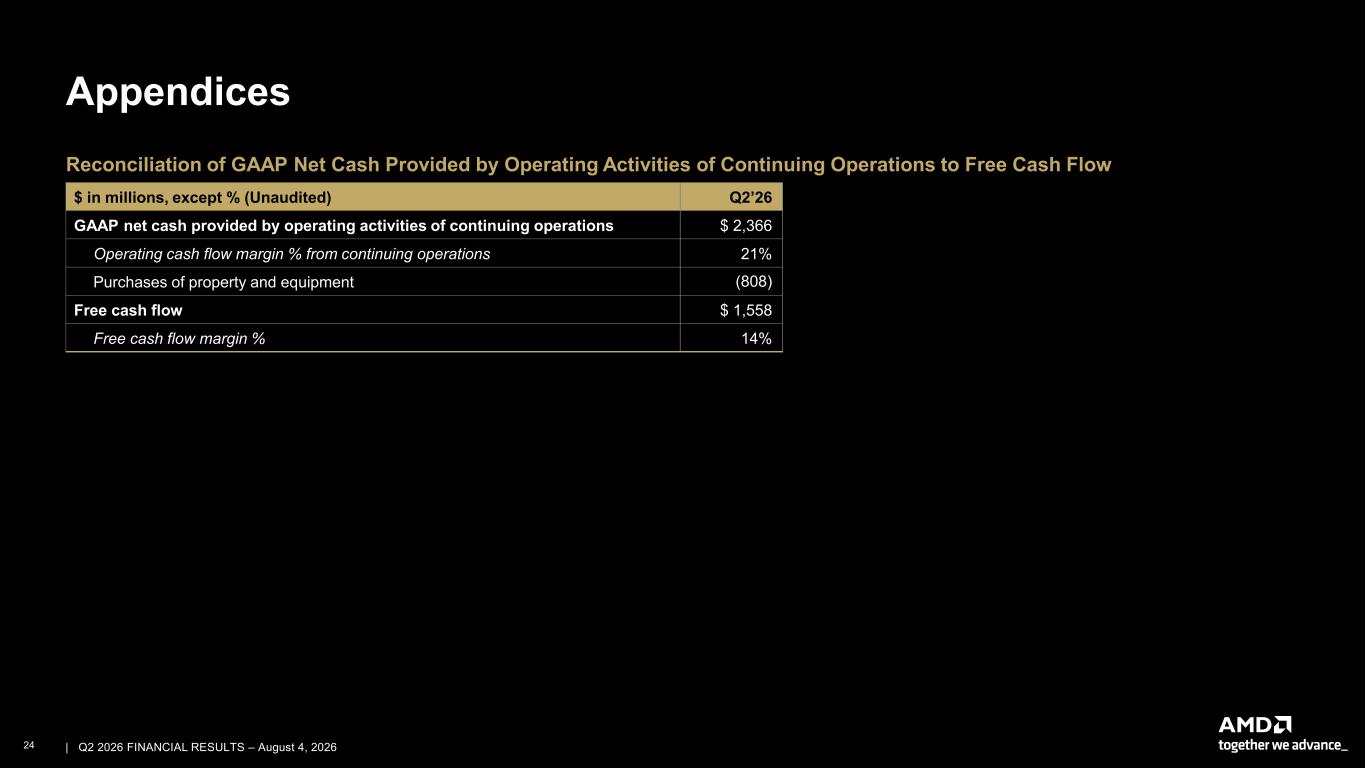
24 | | Q2 2026 FINANCIAL RESULTS – August 4, 2026 Appendices Reconciliation of GAAP Net Cash Provided by Operating Activities of Continuing Operations to Free Cash Flow $ in millions, except % (Unaudited) Q2’26 GAAP net cash provided by operating activities of continuing operations $ 2,366 Operating cash flow margin % from continuing operations 21% Purchases of property and equipment (808) Free cash flow $ 1,558 Free cash flow margin % 14%
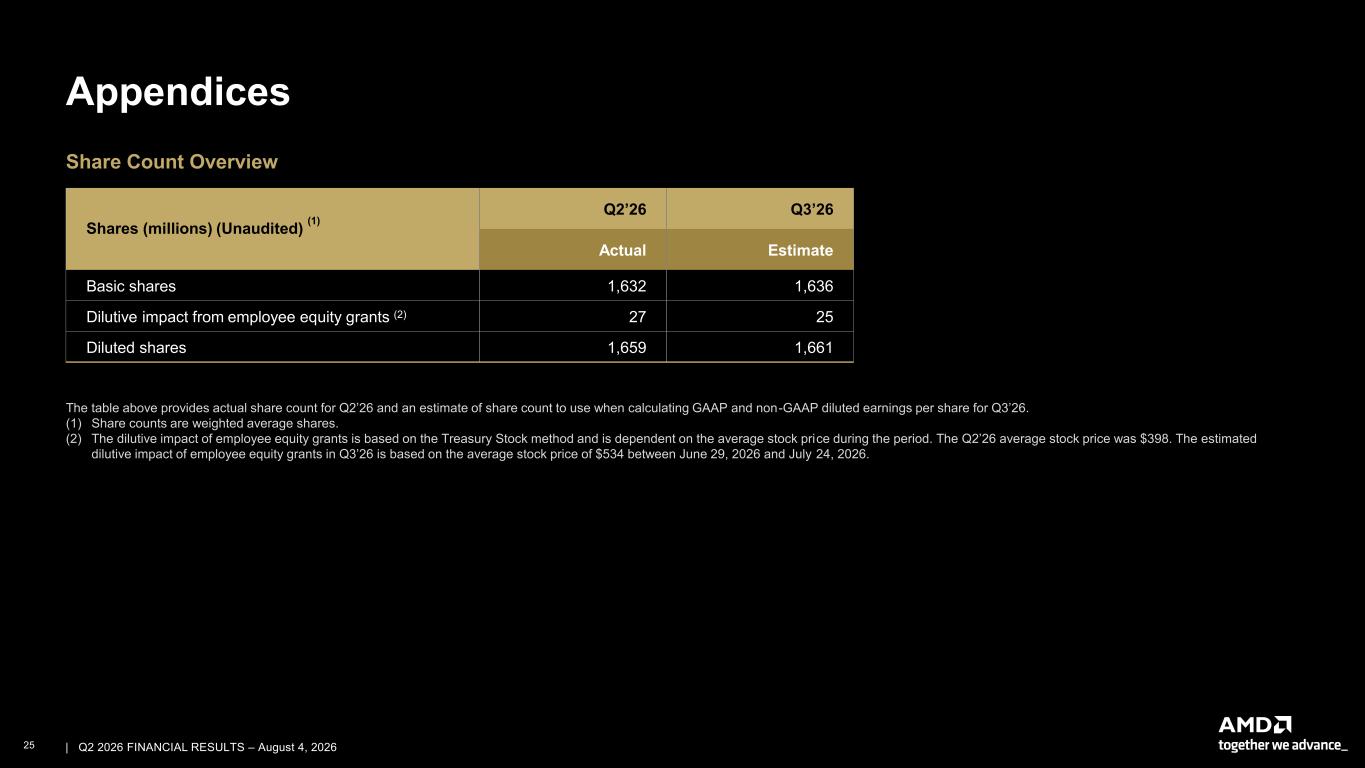
25 | | Q2 2026 FINANCIAL RESULTS – August 4, 2026 Appendices Share Count Overview The table above provides actual share count for Q2’26 and an estimate of share count to use when calculating GAAP and non-GAAP diluted earnings per share for Q3’26. (1) Share counts are weighted average shares. (2) The dilutive impact of employee equity grants is based on the Treasury Stock method and is dependent on the average stock price during the period. The Q2’26 average stock price was $398. The estimated dilutive impact of employee equity grants in Q3’26 is based on the average stock price of $534 between June 29, 2026 and July 24, 2026. Shares (millions) (Unaudited) (1) Q2’26 Q3’26 Actual Estimate Basic shares 1,632 1,636 Dilutive impact from employee equity grants (2) 27 25 Diluted shares 1,659 1,661
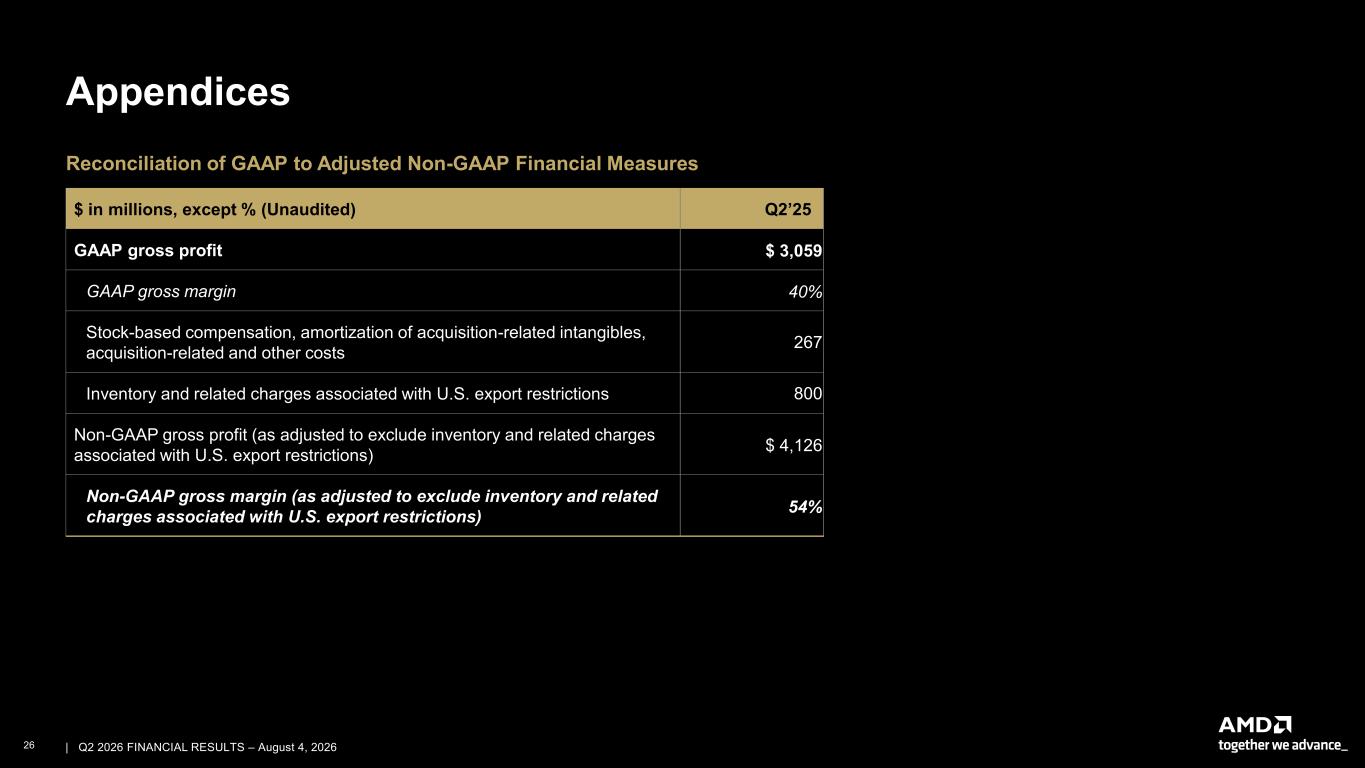
26 | | Q2 2026 FINANCIAL RESULTS – August 4, 2026 Appendices Reconciliation of GAAP to Adjusted Non-GAAP Financial Measures $ in millions, except % (Unaudited) Q2’25 GAAP gross profit $ 3,059 GAAP gross margin 40% Stock-based compensation, amortization of acquisition-related intangibles, acquisition-related and other costs 267 Inventory and related charges associated with U.S. export restrictions 800 Non-GAAP gross profit (as adjusted to exclude inventory and related charges associated with U.S. export restrictions) $ 4,126 Non-GAAP gross margin (as adjusted to exclude inventory and related charges associated with U.S. export restrictions) 54%
27 | | Q2 2026 FINANCIAL RESULTS – August 4, 2026